Shopify Customer Retention Report: Track CLV and Repeat Buyers

Shopify Customer Retention Report: Track Returning Customers, Cohorts, and CLV
A growing Shopify store cannot rely only on first-time buyers.
New customers are important, but returning customers show whether people trust your products enough to come back. That is where retention reporting matters. It helps you understand who buys again, how often they return, how much they spend over time, and which customer groups deserve more attention.
Sales reports tell you what happened. A customer retention report helps explain whether your customer base is getting stronger.
For Shopify merchants, the most useful retention view connects returning customers, one-time customers, customer cohorts, repeat purchase behavior, customer lifetime value, product preferences, and acquisition source. Once those pieces are connected, retention stops being a vague loyalty idea and becomes a measurable growth system.
What a Shopify Customer Retention Report Should Show
A customer retention report should help answer one core question:
Are customers coming back, and are they becoming more valuable over time?
To answer that properly, the report needs more than a customer list. It should show first purchase date, last purchase date, order count, total amount spent, average order value, repeat purchase behavior, cohort performance, and customer segment details.
Shopify provides customer reports that help with this, including one-time customers and customer cohort analysis. The one-time customers report shows customers whose order history includes only one order, while customer cohort analysis groups customers by the date of their first order and shows acquisition and retention behavior over time.
That native foundation is useful. The next step is turning those retention signals into reports your marketing, retention, and leadership teams can act on.
Where to Find Customer Retention Data in Shopify
The main path is:
Analytics > Reports > Category Filter > Customers
From there, customer reports can help you review one-time customers, cohort behavior, returning customer activity, and customer value patterns. The Customer cohort analysis report is especially useful because it shows how groups of customers behave after their first purchase. By default, customers are grouped into cohorts based on when they placed their first order, and the report can be customized with metrics, cohort definitions, and filters.
The cohort report can also show deeper details when you open a cohort interval, including total sales, average order value, average number of orders per customer, amount spent per customer, new or returning customers, top marketing channels, top sales channels, predicted spend tier, and one-time vs. subscription purchase ratio.
That makes it one of the strongest native starting points for retention analysis.
Key Retention Metrics to Track
Retention reporting becomes much clearer when each metric has a specific job. A table is useful here because merchants often need formulas and definitions in one place.
Shopify’s analytics fields include customer-focused metrics such as total amount spent, total amount spent per order, and total number of orders, which help merchants evaluate customer value and repeat purchase potential.
The important point is not to track all metrics equally. A replenishment brand may care most about purchase frequency. A high-ticket furniture store may care more about lifetime value and second-purchase timing. A fashion brand may care about cohort retention after major seasonal campaigns.
Why Returning Customers Matter More Than They Look
A returning customer is not just another order.
A repeat buyer usually has already crossed the hardest trust barrier. They know the product, the checkout experience, the delivery process, and the support quality. That makes the second purchase a strong signal of product satisfaction and customer confidence.
Returning customer reports help identify which buyers are worth nurturing. If customers who buy a certain product tend to return faster, that product may be a strong entry point. If customers from a certain channel buy once and disappear, that acquisition source may need closer review. If high-value customers tend to buy in specific categories, retention campaigns can be built around those patterns.
This is where customer reporting becomes more than a list of names. It becomes a guide for where to invest retention effort.
What Customer Cohorts Reveal
Cohort analysis helps you avoid judging all customers as one group.
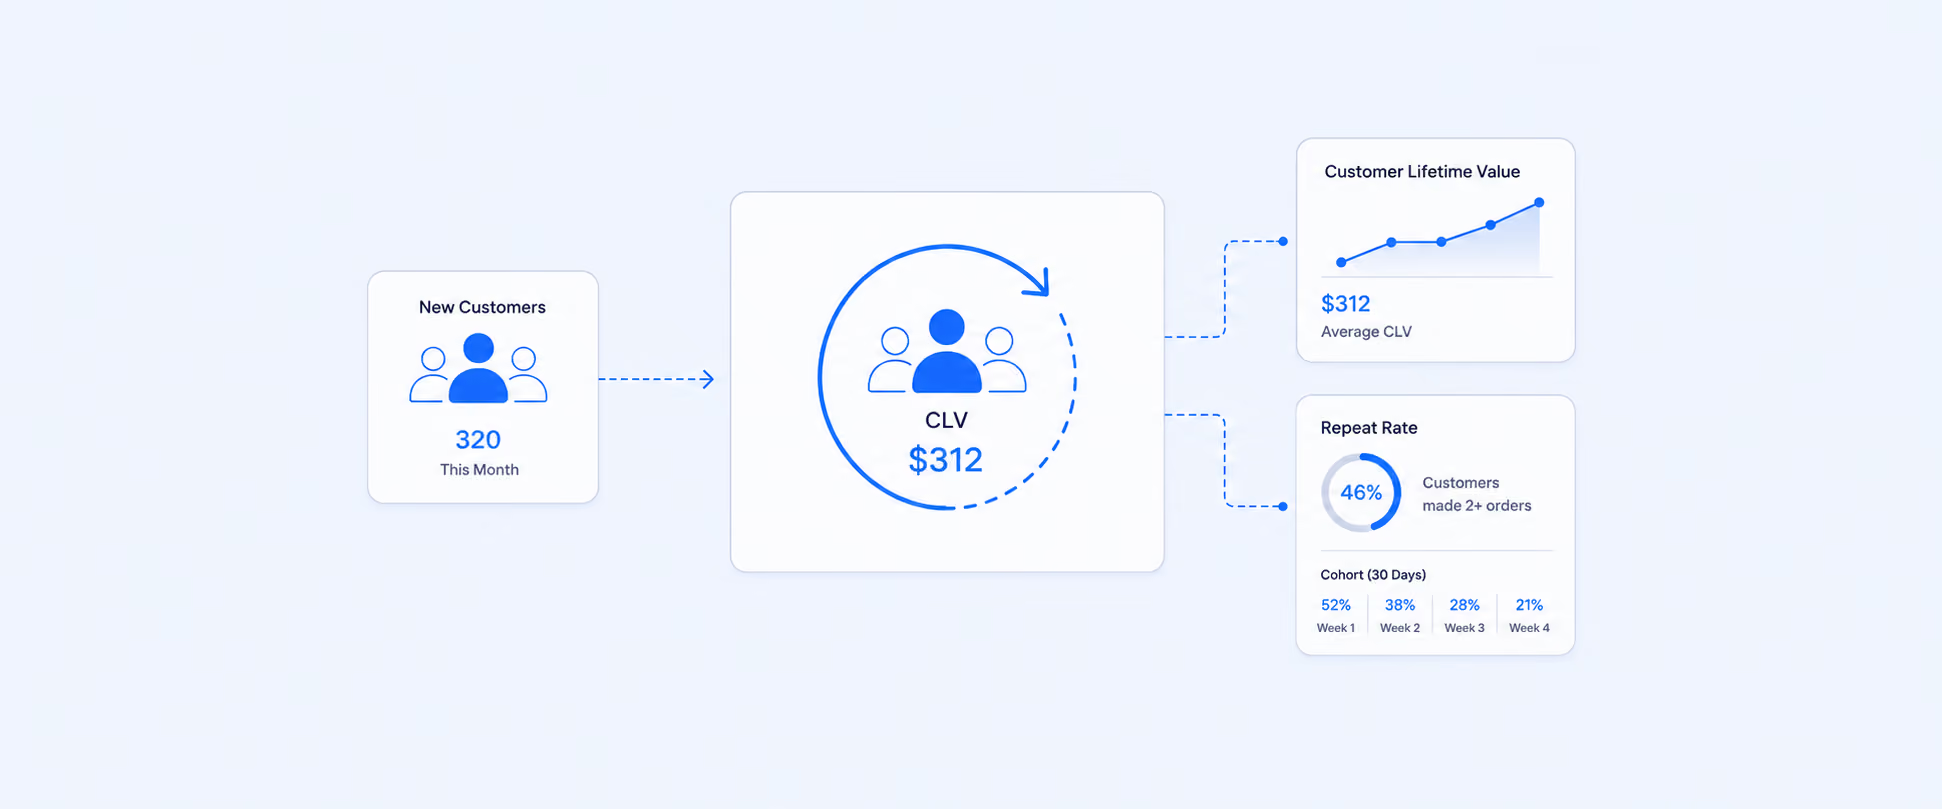
Instead of mixing every customer together, cohorts group customers by a shared starting point, usually the date of their first order. That allows you to compare how customers acquired in January behave against customers acquired in February, March, or later periods.
This matters because not all growth is equal. One month may bring many new customers but weak repeat behavior. Another month may bring fewer customers but stronger long-term value. Without cohort reporting, both months may look similar in a basic sales report.
A useful cohort review looks for patterns such as:
1. Which first-purchase month produced the best repeat behavior?
2. Which cohorts returned fastest after the first order?
3. Which cohorts had the highest amount spent per customer?
4. Which marketing channels brought customers who returned?
5. Which first-purchase products led to stronger retention?
Shopify’s customer cohort analysis supports this kind of retention review by showing cohort rows, repeat purchase behavior across periods, and cohort details such as sales, AOV, orders per customer, amount spent per customer, and top marketing or sales channels.
A Worked Example: When a Cohort Shows a Retention Problem
Imagine a skincare store acquires 1,000 first-time customers in January through a new customer discount.
By Month 2, only 90 customers have placed another order. The average amount spent per customer is low, and most repeat purchases come from customers who bought the moisturizer, not the cleanser.
The February cohort tells a different story. It has only 700 first-time customers, but 180 return by Month 2, and the amount spent per customer is higher. A closer look shows that many of those customers first bought a serum and then returned to buy a refill or complementary product.
The January campaign brought more customers, but the February cohort brought better customers.
That insight changes the next decision. The store may reduce broad first-order discounts, promote the serum as a stronger entry product, build replenishment emails around the moisturizer, and create a win-back flow for January customers who never returned.
That is the practical value of retention reporting. It shows which customers are worth more than their first order.
What Retention Reports Reveal That Sales Reports Miss
A sales report can show that revenue increased. It does not always show whether the increase came from loyal customers or one-time buyers.
That difference matters. A store that grows mainly through new customers may be spending heavily to replace buyers who never return. A store with stable repeat purchases may have a healthier foundation, even if new customer growth is slower.
Retention reports add context that sales reports cannot always show clearly. They help merchants see whether buyers are moving from first purchase to second purchase, whether high-value customers are concentrated in certain cohorts, and whether retention campaigns are working.
The best retention analysis usually connects customer behavior with product, channel, and timing. A returning customer report is useful. A returning customer report that also shows first product purchased, repeat product purchased, region, discount usage, and acquisition channel is far more useful.
When Customer Retention Reporting Needs More Than a Native View
Native Shopify customer reports are a strong starting point when you need to review customer cohorts, one-time customers, repeat behavior, and customer value inside Shopify.
The workflow becomes harder when retention reporting needs to combine customer data with products, discounts, marketing campaigns, subscription data, payment data, refunds, customer tags, regions, or multiple stores in one view. A cohort may show that customers returned, but the business may also need to know which product brought them back, which campaign acquired them, which segment has the highest value, or which customers need a win-back flow.
That is where Report Pundit becomes useful. Merchants can build custom customer reports using Shopify customer, order, product, sales, and app-connected data, then schedule those reports for recurring review. Report Pundit supports customer reports, custom reports, calculated data fields, automated report scheduling, multi-store reports, app data integrations, Google Sheets integration, and export workflows.
A retention report can track returning customers, high-value buyers, one-time customers, repeat purchase behavior, customer tags, region, product category, acquisition source, and total spend in a format that matches the way the team reviews retention.
The value is not just deeper customer data. It is making retention reporting repeatable, so the same customer questions can be reviewed every week or month without rebuilding spreadsheets.
Practical Retention Reports Merchants Often Need
Retention reporting works best when the report matches the decision.
A returning customers report helps identify buyers who have purchased more than once and may be ready for loyalty offers, replenishment campaigns, or VIP treatment. A one-time customers report helps identify buyers who never came back and may need education, win-back emails, or better post-purchase follow-up. A high-value customers report helps separate customers who spend heavily from those who only purchased once during a promotion.
A cohort report helps compare groups by first purchase month, product, source, or region. A customer lifetime value report helps decide how much the business can afford to spend on acquisition. A first-time vs. returning customer sales report helps show whether revenue growth is coming from new demand or repeat demand.
These are not separate reporting tasks. They are different angles on the same retention question: who should the business focus on next?
How to Turn Retention Reports Into Action
Retention data only matters if it changes what the store does next.
Customers who bought once but never returned may need a post-purchase education flow, product usage guide, or replenishment reminder. Customers with high lifetime value may deserve VIP offers, early access, or exclusive bundles. Customers who return only when discounts are offered may need different messaging, not just bigger promotions.
A cohort with strong repeat behavior can guide future acquisition. If one campaign brings customers who return faster and spend more, that campaign deserves more attention than a channel that only brings cheap first orders. A product with strong second-purchase behavior can become an entry product for new customer campaigns.
Retention reporting should lead to specific actions: better segmentation, better win-back timing, stronger product recommendations, smarter loyalty rewards, and cleaner acquisition decisions.
Native Shopify Retention Reporting vs. Custom Retention Workflows
Native customer reports are useful when the question can be answered inside Shopify’s existing customer and cohort reporting views.
Custom retention workflows become more useful when the report needs customer segments, product-level repeat behavior, marketing source, customer tags, subscription context, refunds, custom fields, app data, multi-store views, or scheduled delivery.
Use native reports when you need to review customer cohorts and one-time customers inside Shopify. Use a custom reporting workflow when retention data needs to drive ongoing campaigns, customer segmentation, loyalty planning, or CLV review.
Common Mistakes to Avoid
Revenue growth can hide weak retention. A store may keep growing sales because it keeps acquiring new customers, but if those customers do not return, growth becomes expensive to maintain.
A repeat customer rate means little without timing. A customer who returns after 20 days and a customer who returns after 14 months are very different retention signals. Purchase cycle matters, especially for consumables, apparel, supplements, beauty, and subscription products.
CLV can become misleading when costs are ignored. A customer who spends a lot may still be less profitable if they buy only with heavy discounts, return often, or require high support effort. Lifetime value should be read alongside margin, refunds, discounts, and acquisition cost.
Cohorts should not be compared without context. A holiday cohort, a clearance-sale cohort, and a full-price acquisition cohort may behave very differently. The date is useful, but campaign, product, and discount context explain the behavior.
Retention reports become weaker when customer identifiers are messy. Guest checkout behavior, duplicate customer records, different emails, or incomplete customer profiles can affect how cleanly repeat purchase behavior appears.
Conclusion
Customer retention is where Shopify growth starts to become more predictable.
A first order shows that someone was willing to try your brand. A second order shows trust. A third order starts to show habit. The more clearly you can track that movement, the easier it becomes to decide which products, campaigns, and customer groups deserve your attention.
Shopify’s customer and cohort reports give merchants a useful starting point. Report Pundit helps when retention reporting needs to become a repeatable workflow across returning customers, one-time buyers, cohorts, CLV, tags, products, and segments.
FAQ's
What Is a Shopify Customer Retention Report?
A Shopify customer retention report helps track whether customers return after their first purchase. It can include returning customers, one-time customers, repeat purchase rate, customer cohorts, total amount spent, average order value, order count, and customer lifetime value.
Where Can I Find Customer Retention Data in Shopify?
Go to Analytics > Reports, then filter by the Customers category. The Customer cohort analysis report is one of the most useful native reports for retention because it shows how customer cohorts behave after their first purchase.
Does Shopify Show Customer Cohort Analysis?
Yes. Shopify includes a Customer cohort analysis report that groups customers based on the date of their first order and shows repeat purchase behavior over time. The report can also be customized with metrics, cohort definitions, and filters.
How Do You Calculate Repeat Customer Rate?
A simple repeat customer rate formula is:
Repeat Customer Rate = Returning customers ÷ Customers
This shows what percentage of customers have placed more than one order.
How Do You Calculate Customer Lifetime Value?
A simple CLV formula is:
Customer Lifetime Value = Average Purchase Value x Purchase Frequency x Customer Lifespan
For Shopify reporting, CLV should be reviewed with total amount spent, total number of orders, purchase frequency, margin, discounts, and acquisition cost.
What Is the Difference Between One-Time Customers and Returning Customers?
One-time customers have only placed one order. Returning customers have purchased more than once. Shopify’s one-time customers report shows customers whose order history includes only one order.
Can Report Pundit Create Customer Retention Reports?
Yes. Report Pundit can help create customer reports for returning customers, high-value customers, one-time customers, customer tags, total spend, order count, and custom retention workflows. It also supports automated scheduling and export workflows for recurring retention reporting.

5.0 ( 2000+ Reviews)