Shopify Customer Journey Reports: Track Retention, CLV, and ROI

Shopify Customer Journey Reports: Track Retention, CLV, and Marketing ROI
A customer journey does not end when someone places an order.
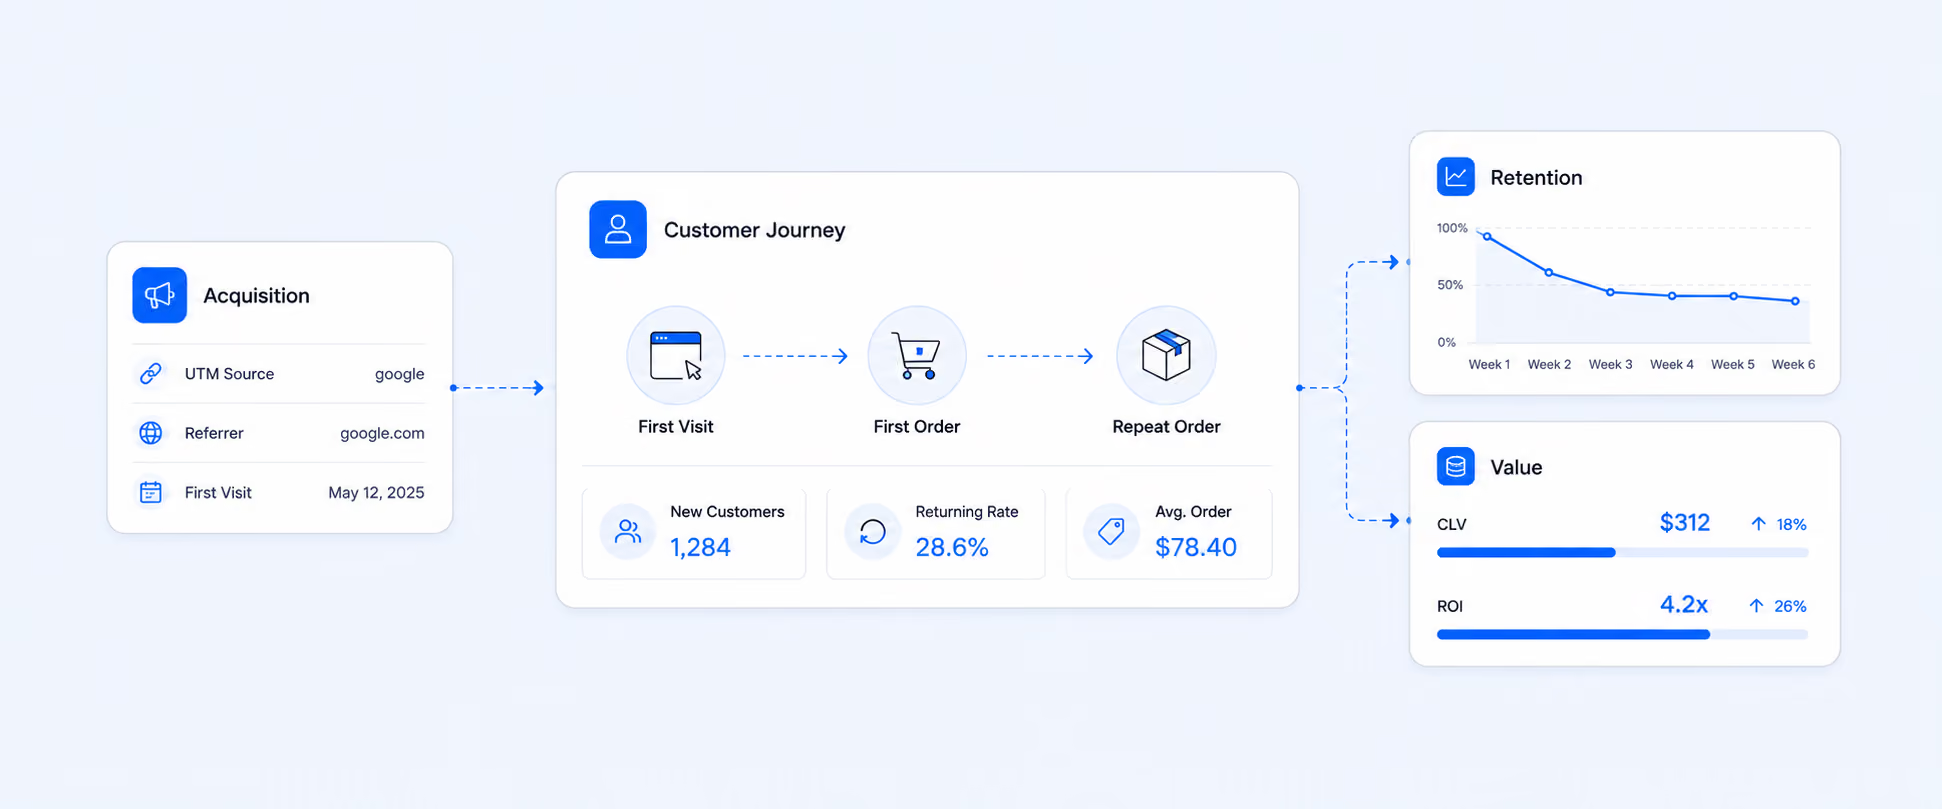
For a Shopify store, the real journey starts before the first visit, continues through the first purchase, and becomes more valuable when the customer returns. That means customer journey reporting should not only show where buyers came from. It should also show whether they came back, how much they spent over time, which channels brought better customers, and which customer groups deserve more attention.
This is where customer journey reporting connects marketing, retention, and revenue quality. A traffic report may show where visitors came from. A sales report may show what they bought. A customer journey report should help explain how customers move from discovery to purchase, and from first order to long-term value.
What is Shopify Customer Journey Report
A Shopify customer journey report can mean two related reporting views.
The first view is the pre-purchase journey. This looks at how a customer found your store, which referral source or campaign influenced the visit, how many visits happened before the order, and what happened before conversion.
The second view is the post-purchase journey. This looks at whether the customer returned, how often they bought again, how much they spent, which cohort they belong to, and whether they are loyal, at risk, dormant, or high-value.
Both views matter. A store that only tracks pre-purchase behavior may optimize campaigns that bring one-time buyers. A store that only tracks repeat customers may miss which channels created those customers in the first place. The strongest customer journey reporting connects both sides.
To make sense of Shopify customer journey data, it helps to distinguish it from standard customer reports. While both provide valuable insights, they focus on different aspects of customer behavior.
Customer Reports vs Customer Journey Reports
Where Shopify Shows Customer Journey Data
Shopify gives merchants several native views that support customer journey analysis.
At the order level, the conversion summary shows customer behavior leading up to a purchase. It can include the customer’s total number of orders, visits in the last 30 days, first visit origin, visit activity, session referrals, app details, and UTM parameters when available. It appears on the order details page, and detailed conversion data may take up to 48 hours to display.
For broader customer analysis, the Customers report category includes reports for returning customers, one-time customers, customer cohort analysis, predicted spend tier, RFM customer analysis, and RFM customer list. These reports help merchants understand acquisition, retention, customer value, and repeat purchase behavior.
For marketing journey analysis, Shopify’s Marketing reports help merchants understand what leads shoppers to the online store and what converts them into paying customers. These reports include views such as sales attributed to marketing, sessions attributed to marketing campaigns, and conversion by attribution model.
Shopify Customer Journey Metrics Worth Tracking
A useful customer journey report needs to connect acquisition, behavior, purchase quality, and retention. The table below is useful because these metrics are often reviewed together.
The goal is not to track every metric in isolation. The goal is to see how the path to purchase connects with the value after purchase.
The Native Customer Reports That Matter Most
Several native customer reports help explain the customer journey after the first purchase.
The Returning customers report shows customers whose order history includes two or more orders. It includes details such as name, email, marketing permission, first order date, most recent order date, order count, average amount spent per order, and total amount spent.
The One-time customers report shows customers whose order history includes only one order. It includes customer details such as name, email, marketing permission, first order date, order count, and order value. This report is useful when the store needs to identify customers who have not yet made a second purchase.
The Customer cohort analysis report groups customers by the date of their first order and shows how those cohorts behave over time. It can be customized through metrics, cohort definitions, intervals, comparisons, and filters. Cohort details can include total sales, average order value, average orders per customer, amount spent per customer, returning customer counts, top marketing channels, top sales channels, predicted spend tier, subscription ratio, and customer locations.
Together, these reports help merchants move beyond “how many customers did we get?” and toward “which customers are actually becoming valuable?”
What Cohort Analysis Reveals
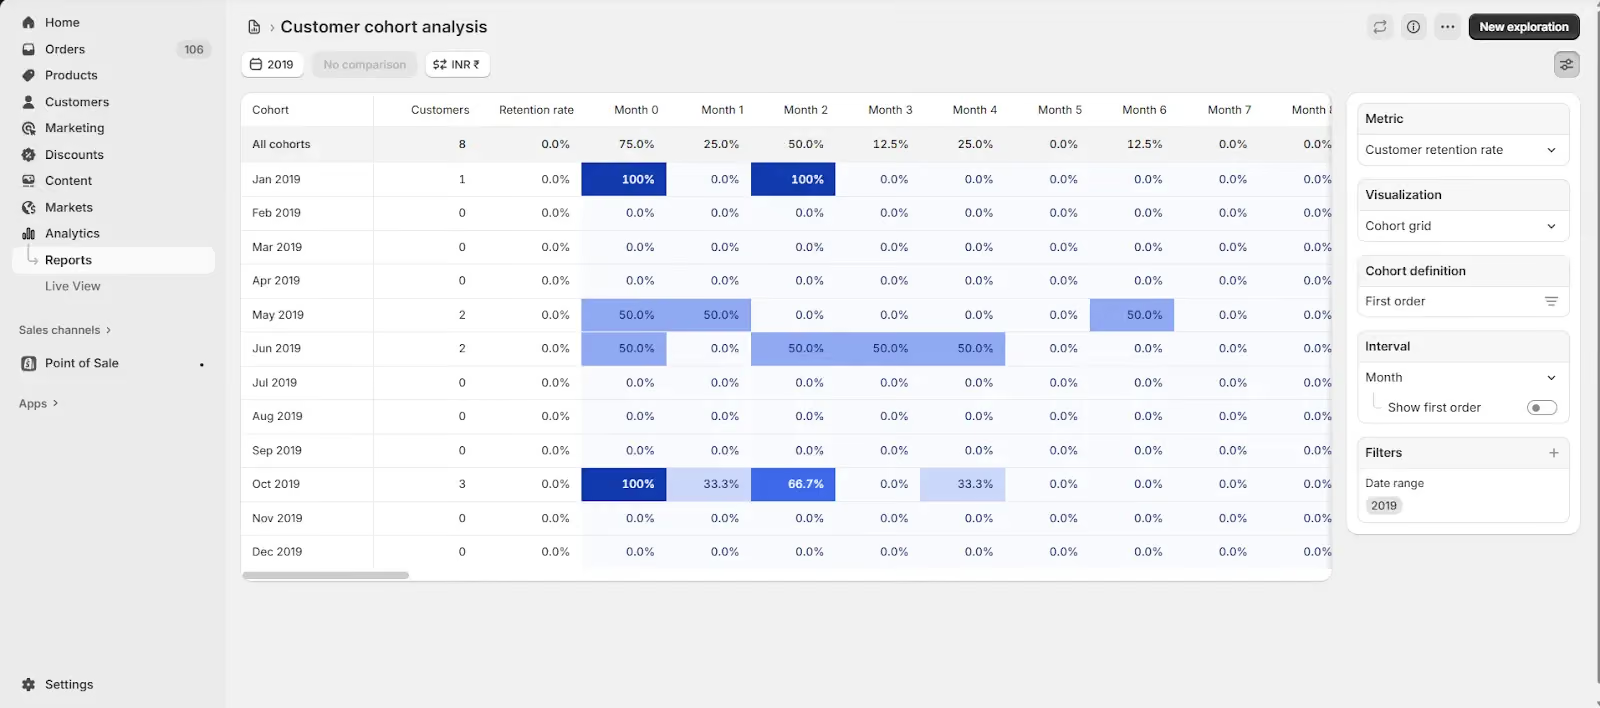
Cohort analysis is one of the most useful ways to understand customer value over time.
Instead of treating all customers as one group, cohorts group customers by a shared starting point, usually the date of their first order. That lets you compare how customers acquired in one month behave against customers acquired in another month.
For example, two months may generate similar first-order revenue, but their long-term value can be completely different. One cohort may return quickly, place more orders, and spend more per customer. Another may buy once during a discount campaign and disappear.
Cohort reporting helps answer questions such as:
- Which first-purchase month created the strongest repeat behavior?
- Which acquisition source brought customers who returned?
- Which first products led to stronger second purchases?
- Which cohorts had the highest amount spent per customer?
- Which customer group needs win-back attention?
A customer cohort report is not just a retention chart. It is a way to judge the quality of customer acquisition.
A Worked Example: When a Customer Journey Report Changes the Marketing Decision
Imagine a Shopify beauty brand runs two campaigns in the same quarter.
Campaign A brings 1,200 first-time customers through a 20% discount. The first-order revenue looks strong, but only 8% of those customers buy again within 60 days.
Campaign B brings only 700 first-time customers through an educational skincare quiz. The first-order revenue is lower, but 22% of those customers buy again within 60 days. The average amount spent per customer is also higher, and the repeat orders are concentrated around moisturizer refills and serum bundles.
A normal campaign report might make Campaign A look better because it brought more customers and more first-order sales. A customer journey report tells a different story. Campaign B created fewer customers, but better customers.
That changes the next decision. The brand may reduce broad discounting, invest more in the quiz journey, build replenishment emails around refill products, and create product education for Campaign A customers who have not returned.
This is the practical value of customer journey reporting. It shows not only where customers came from, but whether they became worth keeping.
How RFM Reporting Helps Segment the Journey
RFM analysis helps merchants understand where customers stand based on recency, frequency, and monetary value.
Recency means how recently the customer purchased. Frequency means how often they order. Monetary value means how much they spend. Shopify’s RFM analysis applies scores from 1 to 5 for each of these dimensions and groups customers into 11 predefined RFM categories. Individual RFM scores are not shown in the admin, but the customer’s RFM group is used for segmentation and planning.
This makes RFM useful for retention action. A Champion customer may deserve early access, referral prompts, or VIP rewards. An At Risk customer may need a personalized win-back offer. A Dormant customer may need a different message than a new customer who has only just made a first purchase.
RFM turns the customer journey into a customer status system. Instead of asking, “Who bought before?” the better question becomes, “What should we do with each group now?”
How UTM and Referrer Reports Connect Marketing to the Journey
Customer journey reporting also needs campaign context.
Marketing reports can help show which channels and campaigns led shoppers to the store and which interactions converted them into customers. Referrer analysis can distinguish first interaction and last interaction, which helps merchants understand whether a source introduced the customer or appeared just before the purchase.
UTM parameters add another layer. When links include UTM values, merchants can analyze campaign source, medium, and campaign name. At the order level, conversion details can also include UTM parameters when available.
This matters because the same order can look different depending on the reporting lens. A customer might first arrive from a paid social campaign, later return through email, and then complete the purchase after a direct visit. A last-click view may overvalue the final step. A first-interaction view may overvalue discovery. The better decision usually comes from comparing the journey, not forcing one attribution model to explain everything.
Where Native Customer Journey Reporting Starts to Feel Limited
Native Shopify reports give merchants useful customer, cohort, conversion, and marketing views. The challenge starts when those views need to become one repeatable workflow.
A merchant may need customer journey data with UTM source, product purchased, customer tag, first order date, repeat order date, total spend, RFM group, refunds, subscription status, payment data, region, and channel in one report. Another merchant may need the same journey report every Monday for marketing review or every month for leadership.
That is where Report Pundit becomes useful. Merchants can create customer behavior reports, customer reports, custom reports, app-connected reports, calculated fields, and scheduled exports. Report Pundit also supports marketing attribution, cohort analysis, lifetime value, UTM tracking, segmentation, multi-store reporting, Google Sheets integration, and automated scheduling.
A retention report can show returning customers, one-time buyers, total spend, order count, tags, regions, and segments. A marketing report can connect UTM source, campaign, referring site, sales, and orders. A customer value report can bring CLV, cohort behavior, purchase frequency, and customer segments into a repeatable view.
The value is not just more customer data. It is making the customer journey easier to review consistently without rebuilding spreadsheets.
Practical Customer Journey Reports Merchants Often Need
A strong customer journey workflow usually includes more than one report.
A Customer Cohort Report helps show which first-purchase groups return over time and how much value they generate after the first order.
A Returning Customers Report helps identify customers who already trust the store and may respond well to loyalty, subscription, replenishment, or VIP campaigns.
A One-Time Customers Report helps identify buyers who never made a second purchase and may need education, reminders, product recommendations, or win-back messaging.
An RFM Customer Report helps separate Champions, Loyal, Active, At Risk, Dormant, and other customer groups so retention campaigns match the customer’s current status.
A UTM and Referring Site Report helps connect traffic sources, campaigns, and customer acquisition quality.
A Customer Lifetime Value Report helps estimate which customer groups are worth more over time, instead of judging acquisition only by first-order revenue.
These reports should not live in separate silos. The best retention and ROI decisions come when customer journey, campaign source, product choice, repeat behavior, and customer value are reviewed together.
How to Turn Customer Journey Reports Into Action
Customer journey reporting should lead to specific actions.
If one cohort has weak second-purchase behavior, build post-purchase education and replenishment flows around the products they bought first. If customers from one campaign return more often, increase spend there even if first-order volume is lower. If a group has high spend but long gaps between purchases, create reminders based on expected replenishment timing. If RFM shows previously loyal customers drifting away, prioritize win-back campaigns before they become dormant.
The same logic applies to ROI. A campaign that brings cheap first orders may look efficient, but it may not be profitable if customers never return. A campaign with a higher acquisition cost may still be better if those customers buy again, spend more, and respond to retention campaigns.
The point is not just to describe the customer journey. It is to improve the next step in that journey.
Native Shopify Reports vs. Custom Customer Journey Reporting
Native Shopify reports are useful when you need to review customer cohorts, returning customers, one-time customers, conversion summaries, RFM groups, and marketing performance inside Shopify.
Custom customer journey reporting becomes more useful when the report needs customer tags, product-level behavior, UTM data, referring site, acquisition source, subscription data, refunds, payment data, app data, multi-store views, calculated metrics, or recurring delivery.
Use native reports when you need to inspect customer behavior inside Shopify. Use a custom workflow when customer journey reporting needs to drive recurring retention, marketing, CLV, and ROI decisions.
Common Mistakes to Avoid
A first-order campaign can look successful while retention is weak. If the campaign brings many buyers who never return, the store may be paying to refill a leaky bucket.
Customer journey data can be misread when attribution is treated as absolute truth. First interaction, last interaction, UTM source, referrer, and marketing platform data can all tell different parts of the same story. The goal is to compare the journey, not force one source to take all credit.
CLV becomes misleading when discounts, returns, and margin are ignored. A customer who spends more is not always more profitable if they buy only during heavy promotions or return products often.
Cohorts need context. Holiday buyers, clearance buyers, subscription buyers, and full-price buyers may behave very differently. Comparing cohorts without campaign, product, and discount context can lead to the wrong retention strategy.
RFM groups should guide action, not replace judgment. A customer marked At Risk may need a win-back offer, but the right message depends on what they bought, how recently they engaged, and whether they had a poor product or support experience.
Conclusion
A customer journey report should help you see the difference between a first order and a valuable customer relationship.
The first visit shows how someone found you. The first order shows they trusted you enough to buy. The second order shows whether the experience worked. The repeat pattern after that is where retention, CLV, and ROI become visible.
Shopify gives merchants useful native views across conversion summaries, customer cohorts, returning customers, RFM groups, and marketing reports. Report Pundit becomes useful when those views need to be combined into repeatable customer journey workflows that marketing, retention, and leadership teams can use consistently.
FAQ's
What Is a Shopify Customer Journey Report?
A Shopify customer journey report helps merchants understand how customers move from discovery to purchase and from first order to repeat purchase. It can include conversion details, referrers, UTM parameters, returning customers, cohorts, RFM groups, total spend, order count, and customer lifetime value.
Where Can I See Customer Journey Data in Shopify?
Order-level journey data is available in the conversion summary on the order details page. Broader customer journey data can be reviewed through Customers reports, Customer cohort analysis, RFM reports, and Marketing reports.
What Is Customer Cohort Analysis in Shopify?
Customer cohort analysis groups customers based on when they placed their first order and shows how those groups behave over time. It helps merchants understand acquisition quality, retention, repeat purchases, and customer value by cohort.
What Is RFM Customer Analysis?
RFM customer analysis segments customers based on recency, frequency, and monetary value. It helps merchants identify customer groups such as Champions, Loyal, Active, At Risk, Previously Loyal, Dormant, and others for retention and loyalty planning.
How Do UTM Reports Help With Customer Journey Tracking?
UTM reports help connect campaign links to sessions, orders, and sales. They make it easier to compare sources, mediums, and campaigns, especially when merchants need to understand which campaigns bring valuable customers instead of only traffic.
What Is the Difference Between Customer Journey and Customer Retention Reporting?
Customer journey reporting looks at the full path from discovery to purchase and repeat behavior. Customer retention reporting focuses more specifically on whether customers come back after the first purchase, how often they return, and how much value they generate over time.
Can Report Pundit Create Customer Journey Reports?
Yes. Report Pundit can help build customer journey reports using customer, order, sales, marketing, UTM, cohort, lifetime value, segmentation, and app-connected data, depending on the store setup. It also supports custom reports, calculated fields, scheduling, exports, Google Sheets integration, and multi-store reporting.

5.0 ( 2000+ Reviews)