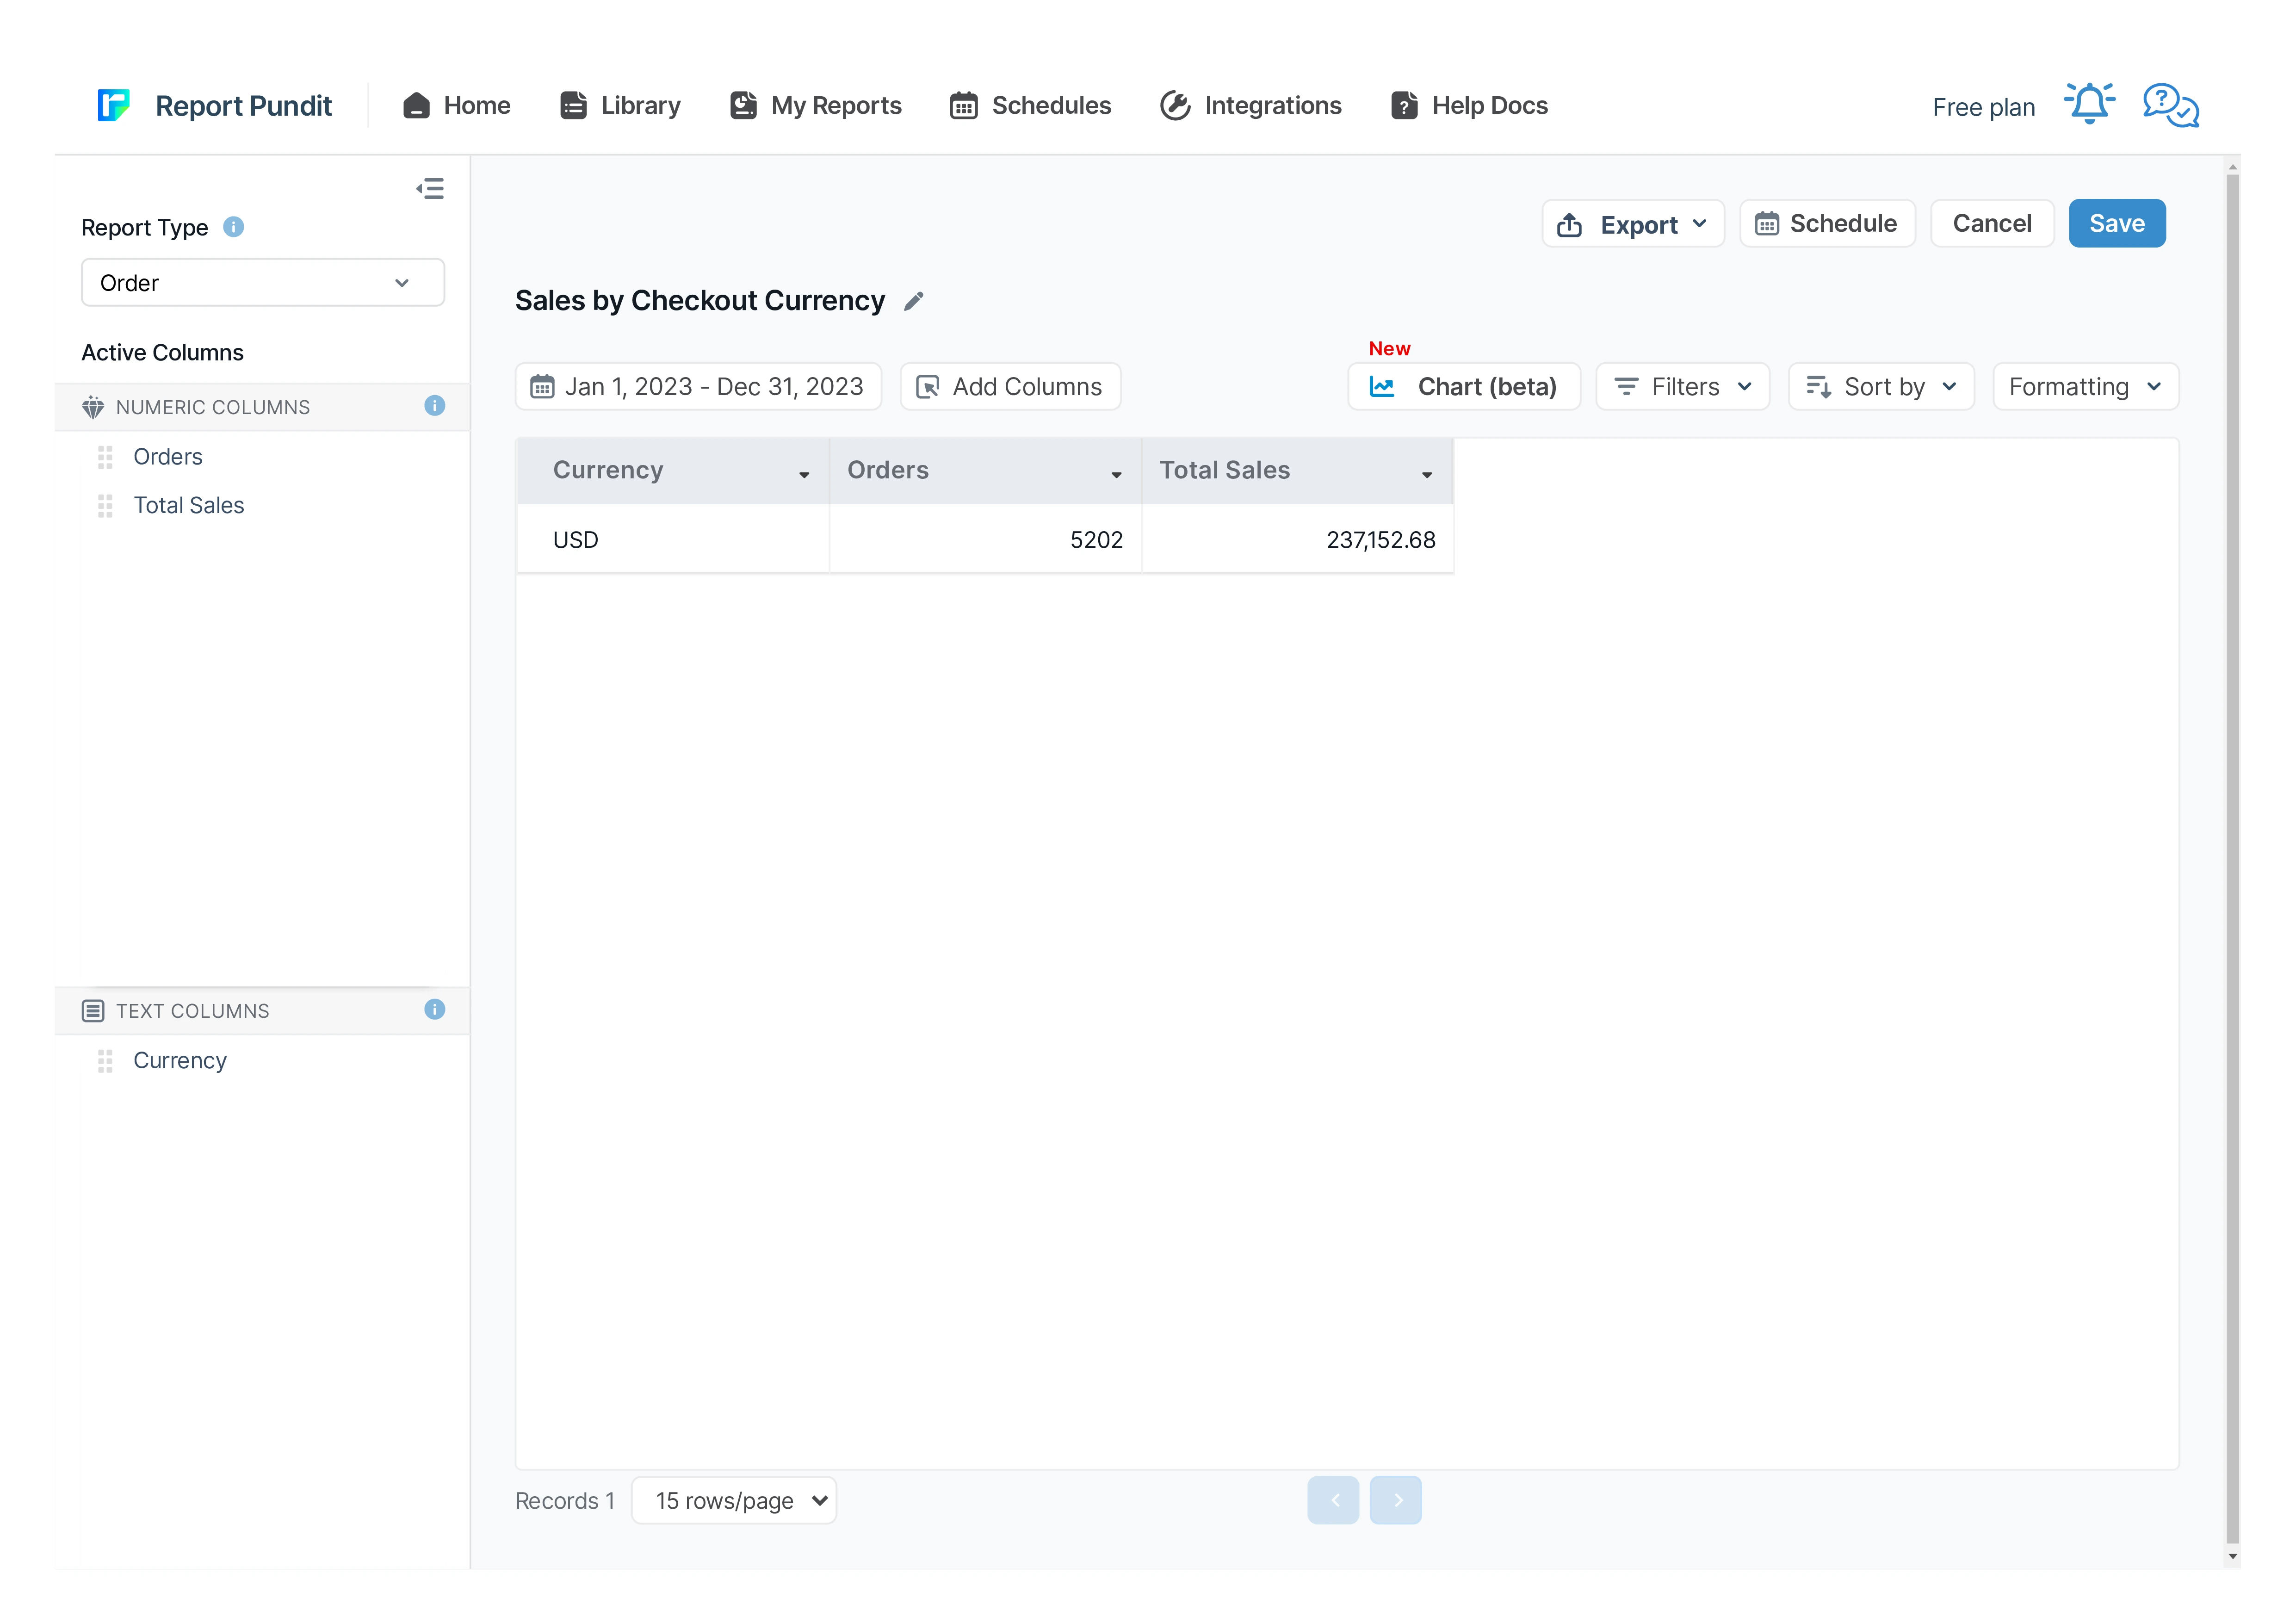
Sales by Checkout Currency Report for Shopify
This report displays the breakdown of your sales by customer currency used at the checkout with the total sales value also being displayed in your local currency.


5 from 1,800+ merchants
2,000+ data fields
Trusted by 40,000+ Shopify stores
Updated June 2026
.png)
.png)

.svg)
.svg)
.svg)
Why this report matters
If you sell internationally through Shopify Markets, customers check out in their own currency — USD, EUR, GBP, CAD. That’s great for conversion and painful for reporting, because your revenue arrives in a dozen denominations.
Shopify’s native reporting doesn’t give a clean per-currency breakdown with a reconciled local-currency total on lower plans. Finance ends up exporting and converting by hand, with exchange-rate guesswork baked in.
A currency report shows each checkout currency’s sales beside the same figure in your local currency. That’s the view that tells you which markets are actually growing — in money you can compare — and lets finance reconcile international revenue without a side spreadsheet.
What’s included
Currency
Checkout currency
The currency the customer paid in at checkout.
Example: USD, EUR, GBP, CAD, AUD.
Presentment vs store currency
What the customer saw vs your store’s base currency.
Heads up: Presentment amounts depend on the exchange rate at order time; a later report run won’t change a past order’s converted value.
Revenue
Sales in checkout currency
Net sales expressed in the currency the customer used.
Sales in local currency
The same sales converted to your store currency — the comparable figure.
Formula: Local sales = Checkout sales × exchange rate at order time
Orders & AOV
Order count and average order value per currency.
Formula: AOV = Local sales ÷ Orders
% of total
Each currency’s share of total net sales, in local terms.
Formula: Currency share = Currency local sales ÷ Total local sales × 100
Who uses this report
Finance
International growth
Owner
Ops / pricing
How to read the report
- Compare in local currency, always. Per-currency totals aren’t comparable until they’re in one currency; lead with the converted column.
- Read share to size markets. Currency share is a rough proxy for market size — useful for prioritizing localization.
- Remember rates are point-in-time. Converted values reflect the rate at order time, so historical totals won’t move with today’s rate.
- Watch AOV per currency. Big basket differences across markets often signal a pricing or shipping-threshold mismatch.
How to build the report in Report Pundit
- Open Report Pundit in your Shopify admin and choose Create Report (or the pre-built “Sales by Checkout Currency” template).
- Set the data source to Sales / Orders.
- Group the report by Checkout (presentment) currency.
- Add columns: Orders, Sales in checkout currency, Sales in local/store currency.
- Add a calculated AOV column and a currency-share column (in local terms).
- Set your date range and sort by local-currency sales descending.
- Run, confirm a known currency’s totals reconcile, and Save.
- Schedule a monthly send to finance, or export to Google Sheets for the reconciliation pack.
Sample report
Customization & filters
- Show checkout currency, local currency, or both.
- Filter to a single currency or market.
- Group currency then country for a market view.
- Add a prior-period comparison in local currency.
- Consolidate multiple stores into one reporting currency.
Automate & export
- Schedules — hourly, daily, weekly, monthly, or custom cron
- Delivery formats — Excel, CSV, PDF, or push to Google Sheets in real time
- Group by month or week — trends instead of a static snapshot
- Destinations — email (multiple recipients), Google Sheets, Google Drive, FTP/SFTP, Looker Studio, BigQuery
- Conditional alerts — get notified only if a channel's net sales drop more than X% week-over-week
Report Pundit vs Shopify's native Sales by Channel report
Frequently Asked Questions
Yes. Each currency’s sales appear both in the checkout currency and converted to your store’s local currency, so the totals are directly comparable and ready to reconcile.
The rate applied at order time, which is what Shopify recorded for that sale. Historical totals therefore don’t shift when today’s rate changes.
Yes — it’s designed for multi-currency and Markets stores where customers check out in their own currency, which native reporting handles thinly on lower plans.
Benefits

Track Currency Performance
Understand Overall Revenue
Boost Global Sales
Related Reports
Sales by Billing Location
The Sales by Billing Location report in Shopify provides a detailed breakdown of sales based on the billing addresses of your customers. This report categorizes sales data of your customer base by country, region, or city.
Sales by Vendor
The Sales by Vendor report analyzes how each vendor's products contribute to your store's success. By examining sales, purchase costs, and profitability, this report provides insights to make strategic decisions, maximize profits, and optimize inventory management based on vendor performance.
Order vs Return (Monthly)
A report interpreting monthly returns by comparing the total sales value with the sales value of returned orders, including percentage calculations for both return orders and return value.
Sales Over Time
Leverage historical data with the Sales Over Time Report. This report covers costs, order details, sales channels, and payment methods, helping you track trends, manage sales tax returns, and assess the effectiveness of each sales channel.
Sales by Discount Code
Sales by Discount Code report in Report Pundit provides a detailed analysis of sales generated through specific discount codes over a defined period.
Weekly Sales Pattern
Your true day-of-week rhythm — which days and hours actually sell — so you staff, schedule ads, and send emails when buyers are buying.
Sales by Variant
Gain detailed insights into each product variant's performance with the Sales by Variant Report. Beyond basic sales data, it shows how each variant impacts your store's success. Use it to fine-tune inventory management and identify popular options, helping you make strategic decisions to boost your bottom line.
Last 24 Hours Orders
Use the Last 24 Hours Orders report to stay updated on all orders placed within the past day. It provides critical insights into sales trends, customer transactions, and order statuses, allowing you to monitor your store's recent activity and make informed business decisions.
Sales by Fulfillment Location
Data reported to analyze sales based on order fulfillment locations for any specified date range, including product quantity sold and corresponding sales value.
Sales by Device ID
The report displays sales data segmented by device type, such as mobile, desktop, or tablet, allowing merchants to analyze performance based on customer device usage.
Order Tags and Line Item Properties
A detailed report built to include order tags and line items added to each placed order, along with essential sales and product details for thorough analysis and processing.
Sales by Product
The Sales by Product report offers details about each product’s sales performance over a given time frame. It provides valuable insights into which of your products are and aren’t selling well. These insights will enable you to make informed decisions about inventory management and marketing and improve your business.
Commission
The Commission Report is the key to rewarding store staff and affiliates for sales they generate. It provides an overview of their sales performance along with calculated commissions share.
Last 30 days Sales Summary
A report that provides a comprehensive overview of sales performance over the past 30 days, including total revenue, order count, average order value, and product-specific sales trends for detailed analysis.
Sales by Customer
The Sales by Customer Report provides Shopify merchants with valuable insights into customer purchasing behavior. This report breaks down sales by individual customers, highlighting the most valuable and active customers.
Sales by POS
The report provides detailed sales figures and net product counts, accounting for refunds, at each POS location, offering a clear view of actual sales performance and inventory movement.
Detailed Sales
The full-detail sales export — every line with channel, payment, tax, cost, and margin — built for deep analysis and your data warehouse.
Sales by Collections
The Sales by Collections report provides a detailed view of your product sales, inventory costs, and profitability by collection, helping you see which collections drive revenue and how they resonate with your audience, allowing you to tailor your product strategies accordingly.
Finance Summary
The Finance Summary Report provides an overview of your store’s financial performance by aggregating key revenue, expense, and tax data. This report helps store owners understand their overall profitability, cash flow, and key cost drivers, making it essential for budgeting and financial planning
Completed Draft Order
This report provides insights into finalized draft orders, displaying detailed information on converted orders, including product details, pricing, and customer data for analysis.
Refund
Report Pundit’s Refund Report records the details of money returned by a Shopify merchant to unsatisfied customers when they return the product/service. These reports help the merchant keep track of the refunds issued, monitor customer satisfaction and have a proper record of financial transactions for filing taxes.

Build and automate your Shopify Reporting
Unlock the full potential of your Shopify store with Report Pundit. Gain access to over 2000 data fields, automate reports, and make data-backed decisions to grow your business.