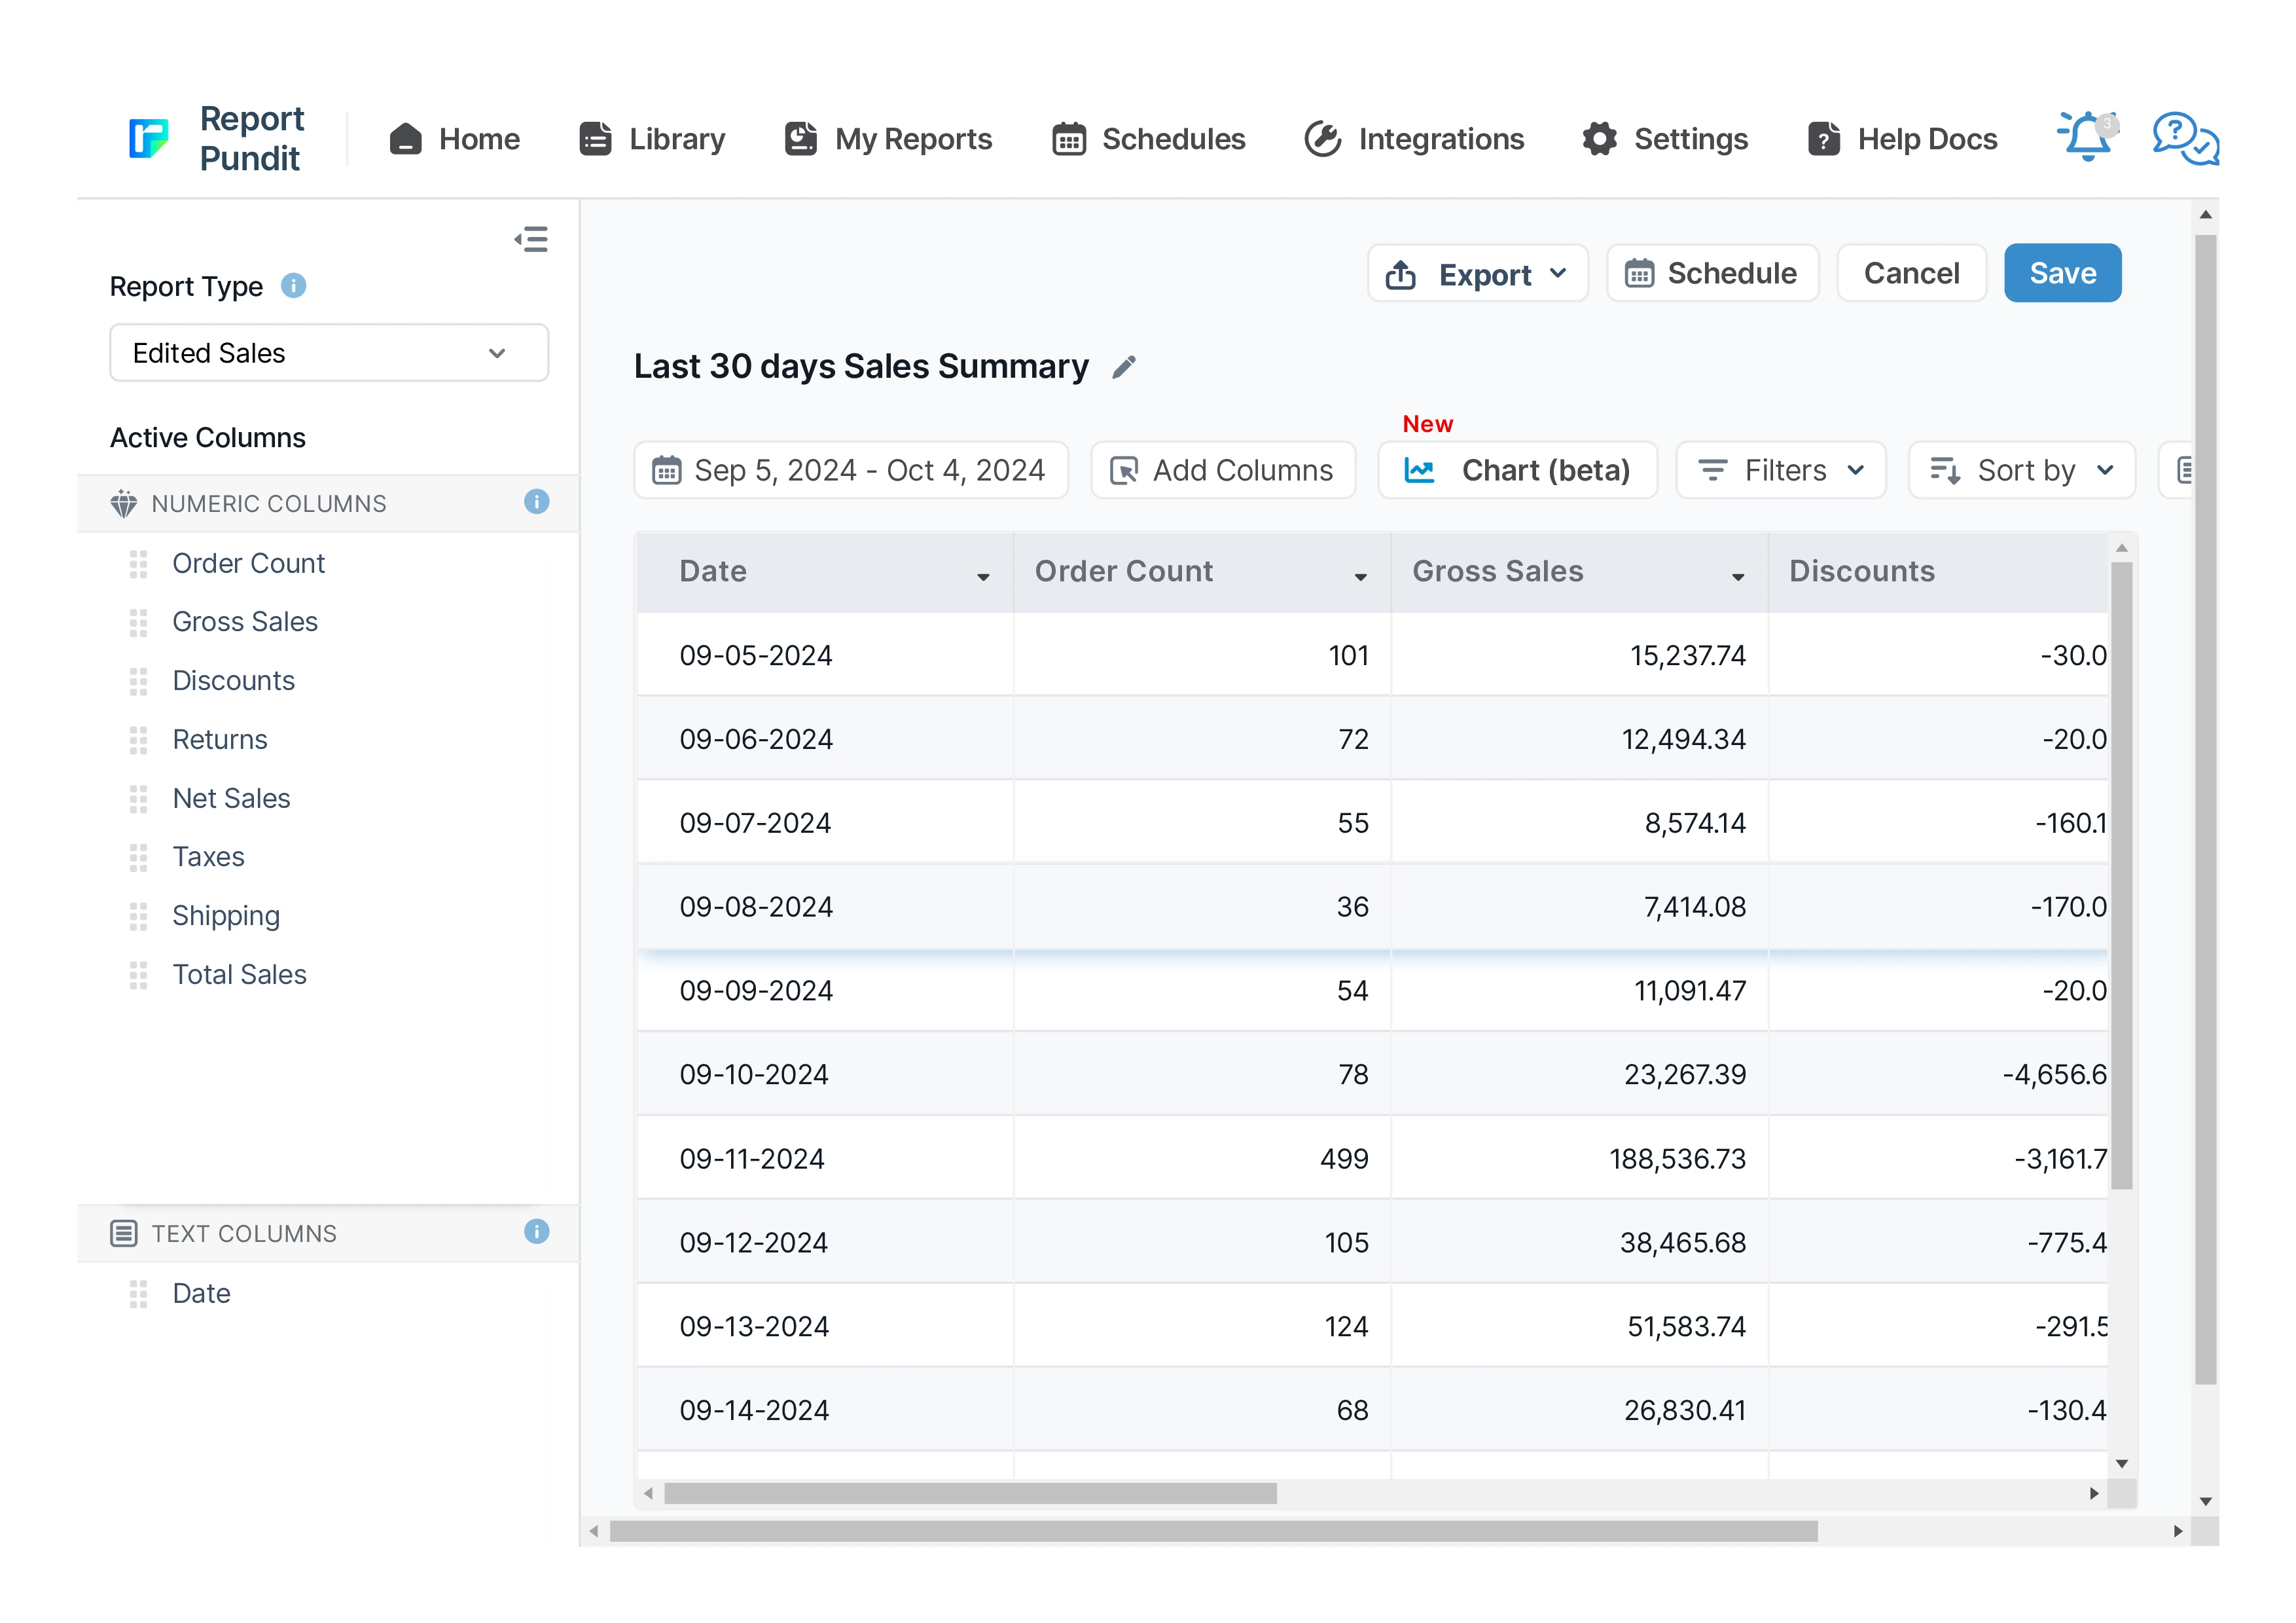
Last 30 days Sales Summary Report for Shopify
A report that provides a comprehensive overview of sales performance over the past 30 days, including total revenue, order count, average order value, and product-specific sales trends for detailed analysis.


5 from 1,800+ merchants
2,000+ data fields
Trusted by 40,000+ Shopify stores
Updated June 2026
.png)
.png)

.svg)
.svg)
.svg)
Why this report matters
Most merchants reconstruct “how did the last 30 days go?” by hand — exporting orders, dropping them into a sheet, and rebuilding the same pivot every month. It’s an hour of work that produces a number you needed yesterday.
Shopify’s native sales reports help, but the detailed versions are gated to the Shopify/Grow plan and up, can’t be scheduled, and reset to a fresh export each time. There’s no standing, shareable 30-day summary you can hand to a stakeholder.
A rolling summary fixes that: net sales, order count, AOV, channel split, and the top products in one view that re-runs itself. With AOV being one of the few levers that lifts revenue without new traffic, watching it month over month is where a lot of margin hides.
What’s included
Revenue build-up
Gross sales
Product revenue before any discounts, returns, shipping, or tax.
Formula: Gross sales = Σ (unit price × quantity)
Discounts
Total value of discount codes and automatic discounts applied in the period.
Example: A 15% launch code that moved $4,200 of product shows here as the discount amount, not the net.
Returns
Value of items returned/refunded in the period, shown as a reduction.
Heads up: A refund is dated when it’s processed, not when the order was placed, so a late refund can dent a month after the sale closed.
Net sales
The cleanest “what we actually sold” figure.
Formula: Net sales = Gross sales − Discounts − Returns
Total sales
Net sales plus shipping and tax — what hit the books.
Formula: Total sales = Net sales + Shipping + Tax
Order quality
Orders
Count of orders in the period (you can choose whether to include cancelled).
Average order value (AOV)
Revenue per order — the headline efficiency metric.
Formula: AOV = Total sales ÷ Orders
Example: $48,000 over 600 orders = $80 AOV. Up $6 vs the prior 30 days.
Units sold
Total quantity across all orders; pair with orders to get items-per-order.
Mix
Sales by channel
Net sales split across Online Store, POS, and connected channels, so you see where growth came from.
Top products
The highest-revenue products in the window, the line stakeholders always ask about.
Heads up: “Top” here means revenue, not units — a low-volume, high-price product can outrank a bestseller.
Who uses this report
Store owner
Finance / bookkeeper
Marketing lead
Merchandiser
How to read the report
- Net sales is the honest number. Gross flatters; net after discounts and returns is what you can spend. Lead every readout with it.
- Read AOV as a trend, not a snapshot. A single month means little; three months of rising AOV means your bundling, upsells, or pricing are working.
- Treat returns as a quality signal. A climbing returns line against flat sales usually points at a product or sizing problem, not buyer remorse.
- Check channel share, not just channel totals. If one channel’s share keeps shrinking while spend holds, that’s budget to reallocate.
How to build the report in Report Pundit
- Open Report Pundit in your Shopify admin and choose Create Report (or the pre-built “Last 30 Days Sales Summary” template).
- Set the data source to Sales / Orders.
- Add the revenue columns: Gross sales, Discounts, Returns, Net sales, Shipping, Tax, Total sales.
- Add Orders, Units, and a calculated AOV column (Total sales ÷ Orders).
- Apply a rolling date filter of “Last 30 days.”
- Add a grouping by Sales channel for the channel mix view.
- Duplicate the report and group the copy by Product to produce the top-products list, sorted by net sales descending.
- Run, review the totals against a known day, and Save.
- Schedule it to send on the last day of each month to email or a shared Google Sheet for stakeholders.
Sample report
Customization & filters
- Switch the window to last 7, 60, or 90 days, or a fixed calendar month.
- Add a comparison column against the prior period to show deltas inline.
- Group by channel, location, or product type instead of the summary view.
- Add a calculated gross-margin column if you’ve set product cost in Shopify.
- Filter out test orders or wholesale tags for a clean DTC number.
Automate & export
- Schedules — hourly, daily, weekly, monthly, or custom cron
- Delivery formats — Excel, CSV, PDF, or push to Google Sheets in real time
- Group by month or week — trends instead of a static snapshot
- Destinations — email (multiple recipients), Google Sheets, Google Drive, FTP/SFTP, Looker Studio, BigQuery
- Conditional alerts — get notified only if a channel's net sales drop more than X% week-over-week
Report Pundit vs Shopify's native Sales by Channel report
Frequently Asked Questions
Gross sales is product revenue before discounts and returns. Net sales subtracts both. Total sales then adds shipping and tax. Net sales is the figure most owners and finance teams report on.
Yes. Add a prior-period comparison column so the deltas appear inline, instead of running two separate exports and diffing them by hand.
Yes — it’s a rolling window, so each run (or scheduled send) covers the most recent 30 days without you changing the dates.
Benefits

Real Time Sales Snapshot
Monitor Key Metrics
Product-Specific Sales Trends
Related Reports
Sales by Channel
The Sales by Channel report displays sales data based on the source of each sale. It's a valuable report offering insights into multichannel Shopify selling.
Sales by Collections
The Sales by Collections report provides a detailed view of your product sales, inventory costs, and profitability by collection, helping you see which collections drive revenue and how they resonate with your audience, allowing you to tailor your product strategies accordingly.
Sales by Fulfillment Location
Data reported to analyze sales based on order fulfillment locations for any specified date range, including product quantity sold and corresponding sales value.
Sales Over Time
Leverage historical data with the Sales Over Time Report. This report covers costs, order details, sales channels, and payment methods, helping you track trends, manage sales tax returns, and assess the effectiveness of each sales channel.
Sales by Staff
A report designed for quick analysis of sales attributed to each staff member across all POS locations, with details from gross sales to net sales calculations.
Sales by Variant
Gain detailed insights into each product variant's performance with the Sales by Variant Report. Beyond basic sales data, it shows how each variant impacts your store's success. Use it to fine-tune inventory management and identify popular options, helping you make strategic decisions to boost your bottom line.
Last 24 Hours Orders
Use the Last 24 Hours Orders report to stay updated on all orders placed within the past day. It provides critical insights into sales trends, customer transactions, and order statuses, allowing you to monitor your store's recent activity and make informed business decisions.
Sales by Product
The Sales by Product report offers details about each product’s sales performance over a given time frame. It provides valuable insights into which of your products are and aren’t selling well. These insights will enable you to make informed decisions about inventory management and marketing and improve your business.
Completed Draft Order
This report provides insights into finalized draft orders, displaying detailed information on converted orders, including product details, pricing, and customer data for analysis.
Commission
The Commission Report is the key to rewarding store staff and affiliates for sales they generate. It provides an overview of their sales performance along with calculated commissions share.
Sales by POS
The report provides detailed sales figures and net product counts, accounting for refunds, at each POS location, offering a clear view of actual sales performance and inventory movement.
Sales by Billing Location
The Sales by Billing Location report in Shopify provides a detailed breakdown of sales based on the billing addresses of your customers. This report categorizes sales data of your customer base by country, region, or city.
Sales by Device ID
The report displays sales data segmented by device type, such as mobile, desktop, or tablet, allowing merchants to analyze performance based on customer device usage.
Sales by Checkout Currency
This report displays the breakdown of your sales by customer currency used at the checkout with the total sales value also being displayed in your local currency.
Detailed Sales
The full-detail sales export — every line with channel, payment, tax, cost, and margin — built for deep analysis and your data warehouse.
Refund
Report Pundit’s Refund Report records the details of money returned by a Shopify merchant to unsatisfied customers when they return the product/service. These reports help the merchant keep track of the refunds issued, monitor customer satisfaction and have a proper record of financial transactions for filing taxes.
Order vs Return (Monthly)
A report interpreting monthly returns by comparing the total sales value with the sales value of returned orders, including percentage calculations for both return orders and return value.
Weekly Sales Pattern
Your true day-of-week rhythm — which days and hours actually sell — so you staff, schedule ads, and send emails when buyers are buying.
Order Tags and Line Item Properties
A detailed report built to include order tags and line items added to each placed order, along with essential sales and product details for thorough analysis and processing.
Sales by Customer
The Sales by Customer Report provides Shopify merchants with valuable insights into customer purchasing behavior. This report breaks down sales by individual customers, highlighting the most valuable and active customers.
Finance Summary
The Finance Summary Report provides an overview of your store’s financial performance by aggregating key revenue, expense, and tax data. This report helps store owners understand their overall profitability, cash flow, and key cost drivers, making it essential for budgeting and financial planning
Sales by Vendor
The Sales by Vendor report analyzes how each vendor's products contribute to your store's success. By examining sales, purchase costs, and profitability, this report provides insights to make strategic decisions, maximize profits, and optimize inventory management based on vendor performance.

Build and automate your
Shopify Reporting
Unlock the full potential of your Shopify store with Report Pundit.
Gain access to over 2000 data fields, automate reports, and make
data-backed decisions to grow your business.