Sales by Billing Location Report for Shopify
The Sales by Billing Location report in Shopify provides a detailed breakdown of sales based on the billing addresses of your customers. This report categorizes sales data of your customer base by country, region, or city.


5 from 1,800+ merchants
2,000+ data fields
Trusted by 40,000+ Shopify stores
Updated June 2026
.png)
.png)

.svg)
.svg)
.svg)
Why this report matters
Where your customers pay from shapes three decisions at once: where to advertise, where you owe tax, and where to expand. Yet most stores never see sales mapped to geography until an accountant asks.
Shopify has a native Sales by billing location report, but it’s gated on lower plans, can’t be scheduled, and won’t blend with the rest of your reporting. So the geographic picture stays locked in a one-off export.
Grouping net sales by billing country, state, and city turns the order list into a map. That’s the view that justifies a regional ad push, flags a state approaching a tax-nexus threshold, and shows where a new shipping zone or pop-up would pay off.
What’s included
Geography
Billing country / state / city
The customer’s billing address, drilled from country down to city.
Example: United States › California › Los Angeles.
Heads up: Billing location is where the card is registered, not necessarily where the order ships — use Sales by Fulfillment Location for the shipping-side view.
Volume & revenue
Orders
Order count from each location.
Gross & net sales
Revenue before and after discounts and returns, per location.
Formula: Net sales = Gross − Discounts − Returns
% of total sales
Each region’s share of net sales — the concentration view.
Formula: Region share = Region net sales ÷ Total net sales × 100
Average order value
Basket size by region, which often varies more than expected.
Formula: AOV = Region net sales ÷ Region orders
Tax
Tax collected by location
Tax gathered per jurisdiction — the early-warning view for nexus.
Heads up: A state’s sales climbing toward an economic-nexus threshold is a signal to review your tax registration — confirm with your accountant, not this report alone.
Who uses this report
Marketing
Finance / tax
Owner
CX / localization
How to read the report
- Drill, don’t aggregate. Country totals hide the city that’s really carrying a region; start broad, then drill to where the money is.
- Separate billing from shipping. Billing is where they pay; it answers tax and card questions, not where the box goes.
- Read tax by jurisdiction for nexus. A rising state tax line is a compliance signal worth catching before, not after, a threshold.
- Compare AOV across regions. A smaller region with a high basket can be worth more attention than a large, low-AOV one.
How to build the report in Report Pundit
- Open Report Pundit in your Shopify admin and choose Create Report (or the pre-built “Sales by Billing Location” template).
- Set the data source to Sales / Orders.
- Group by Billing country, then add State/province and City as drill levels.
- Add columns: Orders, Gross sales, Discounts, Returns, Net sales, Tax.
- Add a calculated Region-share column and an AOV column.
- Set your date range and sort by Net sales descending.
- Run, confirm a known region’s totals look right, and Save.
- Schedule a monthly send to marketing and finance, or export to Google Sheets to drop into a map.
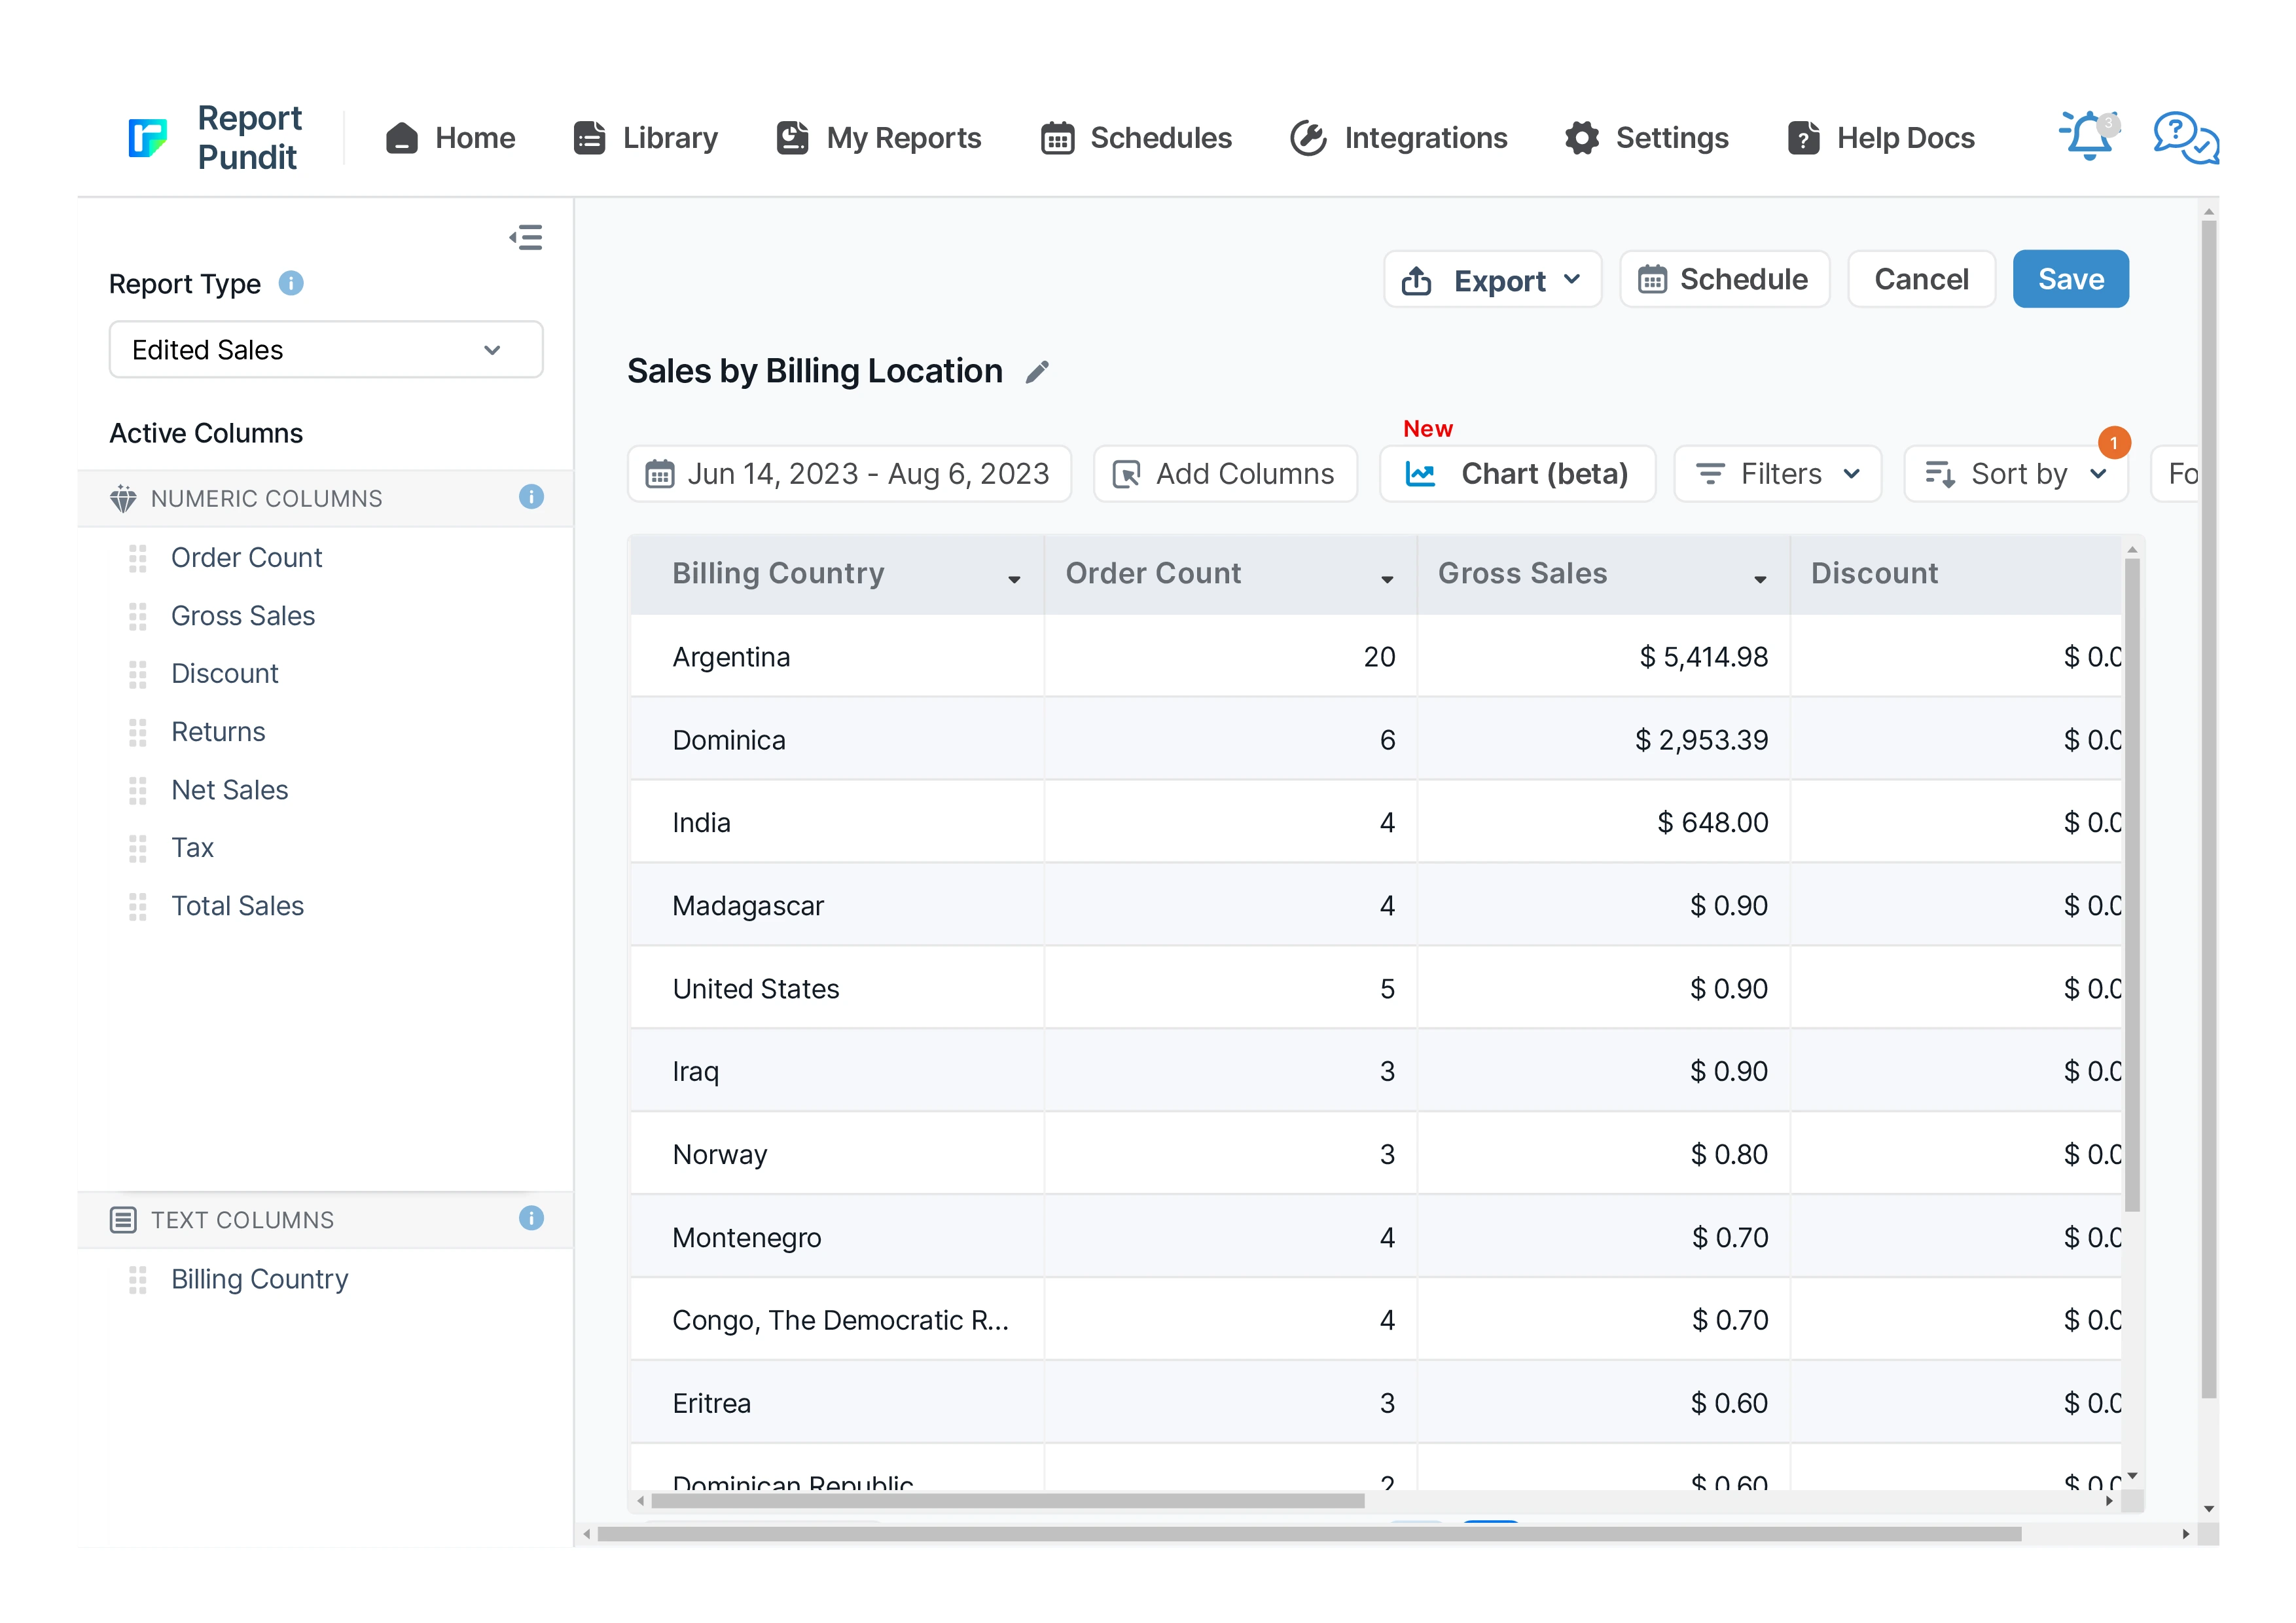
Sample report
Customization & filters
- Drill country › state › city, or group at any single level.
- Filter to one country or region for a focused view.
- Add tax-by-jurisdiction for compliance review.
- Compare two periods to surface fast-growing regions.
- Export to Google Sheets for a heat-map visualization.
Automate & export
- Schedules — hourly, daily, weekly, monthly, or custom cron
- Delivery formats — Excel, CSV, PDF, or push to Google Sheets in real time
- Group by month or week — trends instead of a static snapshot
- Destinations — email (multiple recipients), Google Sheets, Google Drive, FTP/SFTP, Looker Studio, BigQuery
- Conditional alerts — get notified only if a channel's net sales drop more than X% week-over-week
Report Pundit vs Shopify's native Sales by Channel report
Frequently Asked Questions
Billing address — where the customer’s payment is registered. For where orders ship from, use the Sales by Fulfillment Location report instead; the two answer different questions.
Yes. Drill from country to state/province to city, or group at whichever level you need. City detail is where regional ad and pop-up decisions usually get made.
It shows sales and tax by jurisdiction, which can flag a state nearing an economic-nexus threshold. Treat it as a signal and confirm registration requirements with your accountant.
Benefits

Region-Specific Campaigns
Sales Performance
Inventory Management
Related Reports
Sales by Variant
Gain detailed insights into each product variant's performance with the Sales by Variant Report. Beyond basic sales data, it shows how each variant impacts your store's success. Use it to fine-tune inventory management and identify popular options, helping you make strategic decisions to boost your bottom line.
Finance Summary
The Finance Summary Report provides an overview of your store’s financial performance by aggregating key revenue, expense, and tax data. This report helps store owners understand their overall profitability, cash flow, and key cost drivers, making it essential for budgeting and financial planning
Sales by Product
The Sales by Product report offers details about each product’s sales performance over a given time frame. It provides valuable insights into which of your products are and aren’t selling well. These insights will enable you to make informed decisions about inventory management and marketing and improve your business.
Sales by POS
The report provides detailed sales figures and net product counts, accounting for refunds, at each POS location, offering a clear view of actual sales performance and inventory movement.
Order Tags and Line Item Properties
A detailed report built to include order tags and line items added to each placed order, along with essential sales and product details for thorough analysis and processing.
Refund
Report Pundit’s Refund Report records the details of money returned by a Shopify merchant to unsatisfied customers when they return the product/service. These reports help the merchant keep track of the refunds issued, monitor customer satisfaction and have a proper record of financial transactions for filing taxes.
Last 24 Hours Orders
Use the Last 24 Hours Orders report to stay updated on all orders placed within the past day. It provides critical insights into sales trends, customer transactions, and order statuses, allowing you to monitor your store's recent activity and make informed business decisions.
Sales by Collections
The Sales by Collections report provides a detailed view of your product sales, inventory costs, and profitability by collection, helping you see which collections drive revenue and how they resonate with your audience, allowing you to tailor your product strategies accordingly.
Sales by Channel
The Sales by Channel report displays sales data based on the source of each sale. It's a valuable report offering insights into multichannel Shopify selling.
Sales Over Time
Leverage historical data with the Sales Over Time Report. This report covers costs, order details, sales channels, and payment methods, helping you track trends, manage sales tax returns, and assess the effectiveness of each sales channel.
Sales by Discount Code
Sales by Discount Code report in Report Pundit provides a detailed analysis of sales generated through specific discount codes over a defined period.
Detailed Sales
The full-detail sales export — every line with channel, payment, tax, cost, and margin — built for deep analysis and your data warehouse.
Sales by Staff
A report designed for quick analysis of sales attributed to each staff member across all POS locations, with details from gross sales to net sales calculations.
Sales by Vendor
The Sales by Vendor report analyzes how each vendor's products contribute to your store's success. By examining sales, purchase costs, and profitability, this report provides insights to make strategic decisions, maximize profits, and optimize inventory management based on vendor performance.
Sales by Checkout Currency
This report displays the breakdown of your sales by customer currency used at the checkout with the total sales value also being displayed in your local currency.
Sales by Customer
The Sales by Customer Report provides Shopify merchants with valuable insights into customer purchasing behavior. This report breaks down sales by individual customers, highlighting the most valuable and active customers.
Order vs Return (Monthly)
A report interpreting monthly returns by comparing the total sales value with the sales value of returned orders, including percentage calculations for both return orders and return value.
Commission
The Commission Report is the key to rewarding store staff and affiliates for sales they generate. It provides an overview of their sales performance along with calculated commissions share.
Last 30 days Sales Summary
A report that provides a comprehensive overview of sales performance over the past 30 days, including total revenue, order count, average order value, and product-specific sales trends for detailed analysis.
Sales by Device ID
The report displays sales data segmented by device type, such as mobile, desktop, or tablet, allowing merchants to analyze performance based on customer device usage.
Completed Draft Order
This report provides insights into finalized draft orders, displaying detailed information on converted orders, including product details, pricing, and customer data for analysis.

Build and automate your Shopify Reporting
Unlock the full potential of your Shopify store with Report Pundit. Gain access to over 2000 data fields, automate reports, and make data-backed decisions to grow your business.