Sales by Customer Report for Shopify
The Sales by Customer Report provides Shopify merchants with valuable insights into customer purchasing behavior. This report breaks down sales by individual customers, highlighting the most valuable and active customers.


5 from 1,800+ merchants
2,000+ data fields
Trusted by 40,000+ Shopify stores
Updated June 2026
.png)
.png)

.svg)
.svg)
.svg)
Why this report matters
In most stores a small share of customers drives the majority of revenue, yet they sit invisible inside the order list. Without a per-customer view you treat a first-time buyer and a 12-order regular the same way — and lose both.
Shopify’s native Sales by customer name report helps, but the richer customer reports and the ability to save them are gated to higher plans, and nothing schedules itself. Retention work stalls on a missing export.
Ranking customers by spend, orders, and AOV turns a flat list into a targeting tool: who to thank, who to win back, and who to build a lookalike audience from. Since retaining an existing customer costs far less than acquiring a new one, this is one of the cheapest revenue levers you have.
What’s included
Customer name & email
Who the customer is and the email used to reach them.
Heads up: Guest checkouts and customers who decline marketing consent may appear without full contact detail — respect consent before any outreach.
Location / tags
Customer location and any tags (VIP, wholesale, subscriber) for segmenting.
Value
Total spend
Lifetime or period net sales attributed to the customer.
Formula: Total spend = Σ net sales of the customer’s orders
Orders
Number of orders the customer has placed in the window.
Average order value
Average basket for the customer.
Formula: AOV = Total spend ÷ Orders
Example: $960 over 8 orders = $120 AOV — a high-value regular.
Units
Total items purchased, useful for spotting bulk or wholesale buyers.
Recency
First & last order date
When the relationship started and when it last moved — the basis for win-back.
Example: Last order 5 months ago on a customer who used to buy monthly — a churn signal.
Returning vs new
Whether the customer has ordered more than once in the window.
Heads up: A high count of one-and-done customers points to a retention problem, not an acquisition win.
Who uses this report
Retention marketer
CX / VIP manager
Growth
Owner
How to read the report
- Rank by spend, then read recency. A high-spend customer who hasn’t ordered in months is your highest-value win-back, not a loss.
- Watch the one-and-done share. Lots of single-order customers means acquisition works but retention doesn’t — a different fix entirely.
- Use AOV to tier, not just spend. Two customers at the same total spend behave differently if one buys big and rarely, the other small and often.
- Mind consent before outreach. The report can surface contacts, but marketing consent governs who you can actually email.
How to build the report in Report Pundit
- Open Report Pundit in your Shopify admin and choose Create Report (or the pre-built “Sales by Customer” template).
- Set the data source to Sales / Orders grouped by Customer.
- Add columns: Customer name, Email, Location, Tags, Orders, Units, Total spend.
- Add a calculated AOV column (total spend ÷ orders).
- Add First order date and Last order date for recency.
- Set your date range (or run lifetime), and sort by Total spend descending.
- Optional: add a filter for last order older than N days to build a win-back list.
- Run, confirm a known customer’s totals, and Save.
- Schedule a monthly send to marketing, or export a segment to Google Sheets for your email tool.
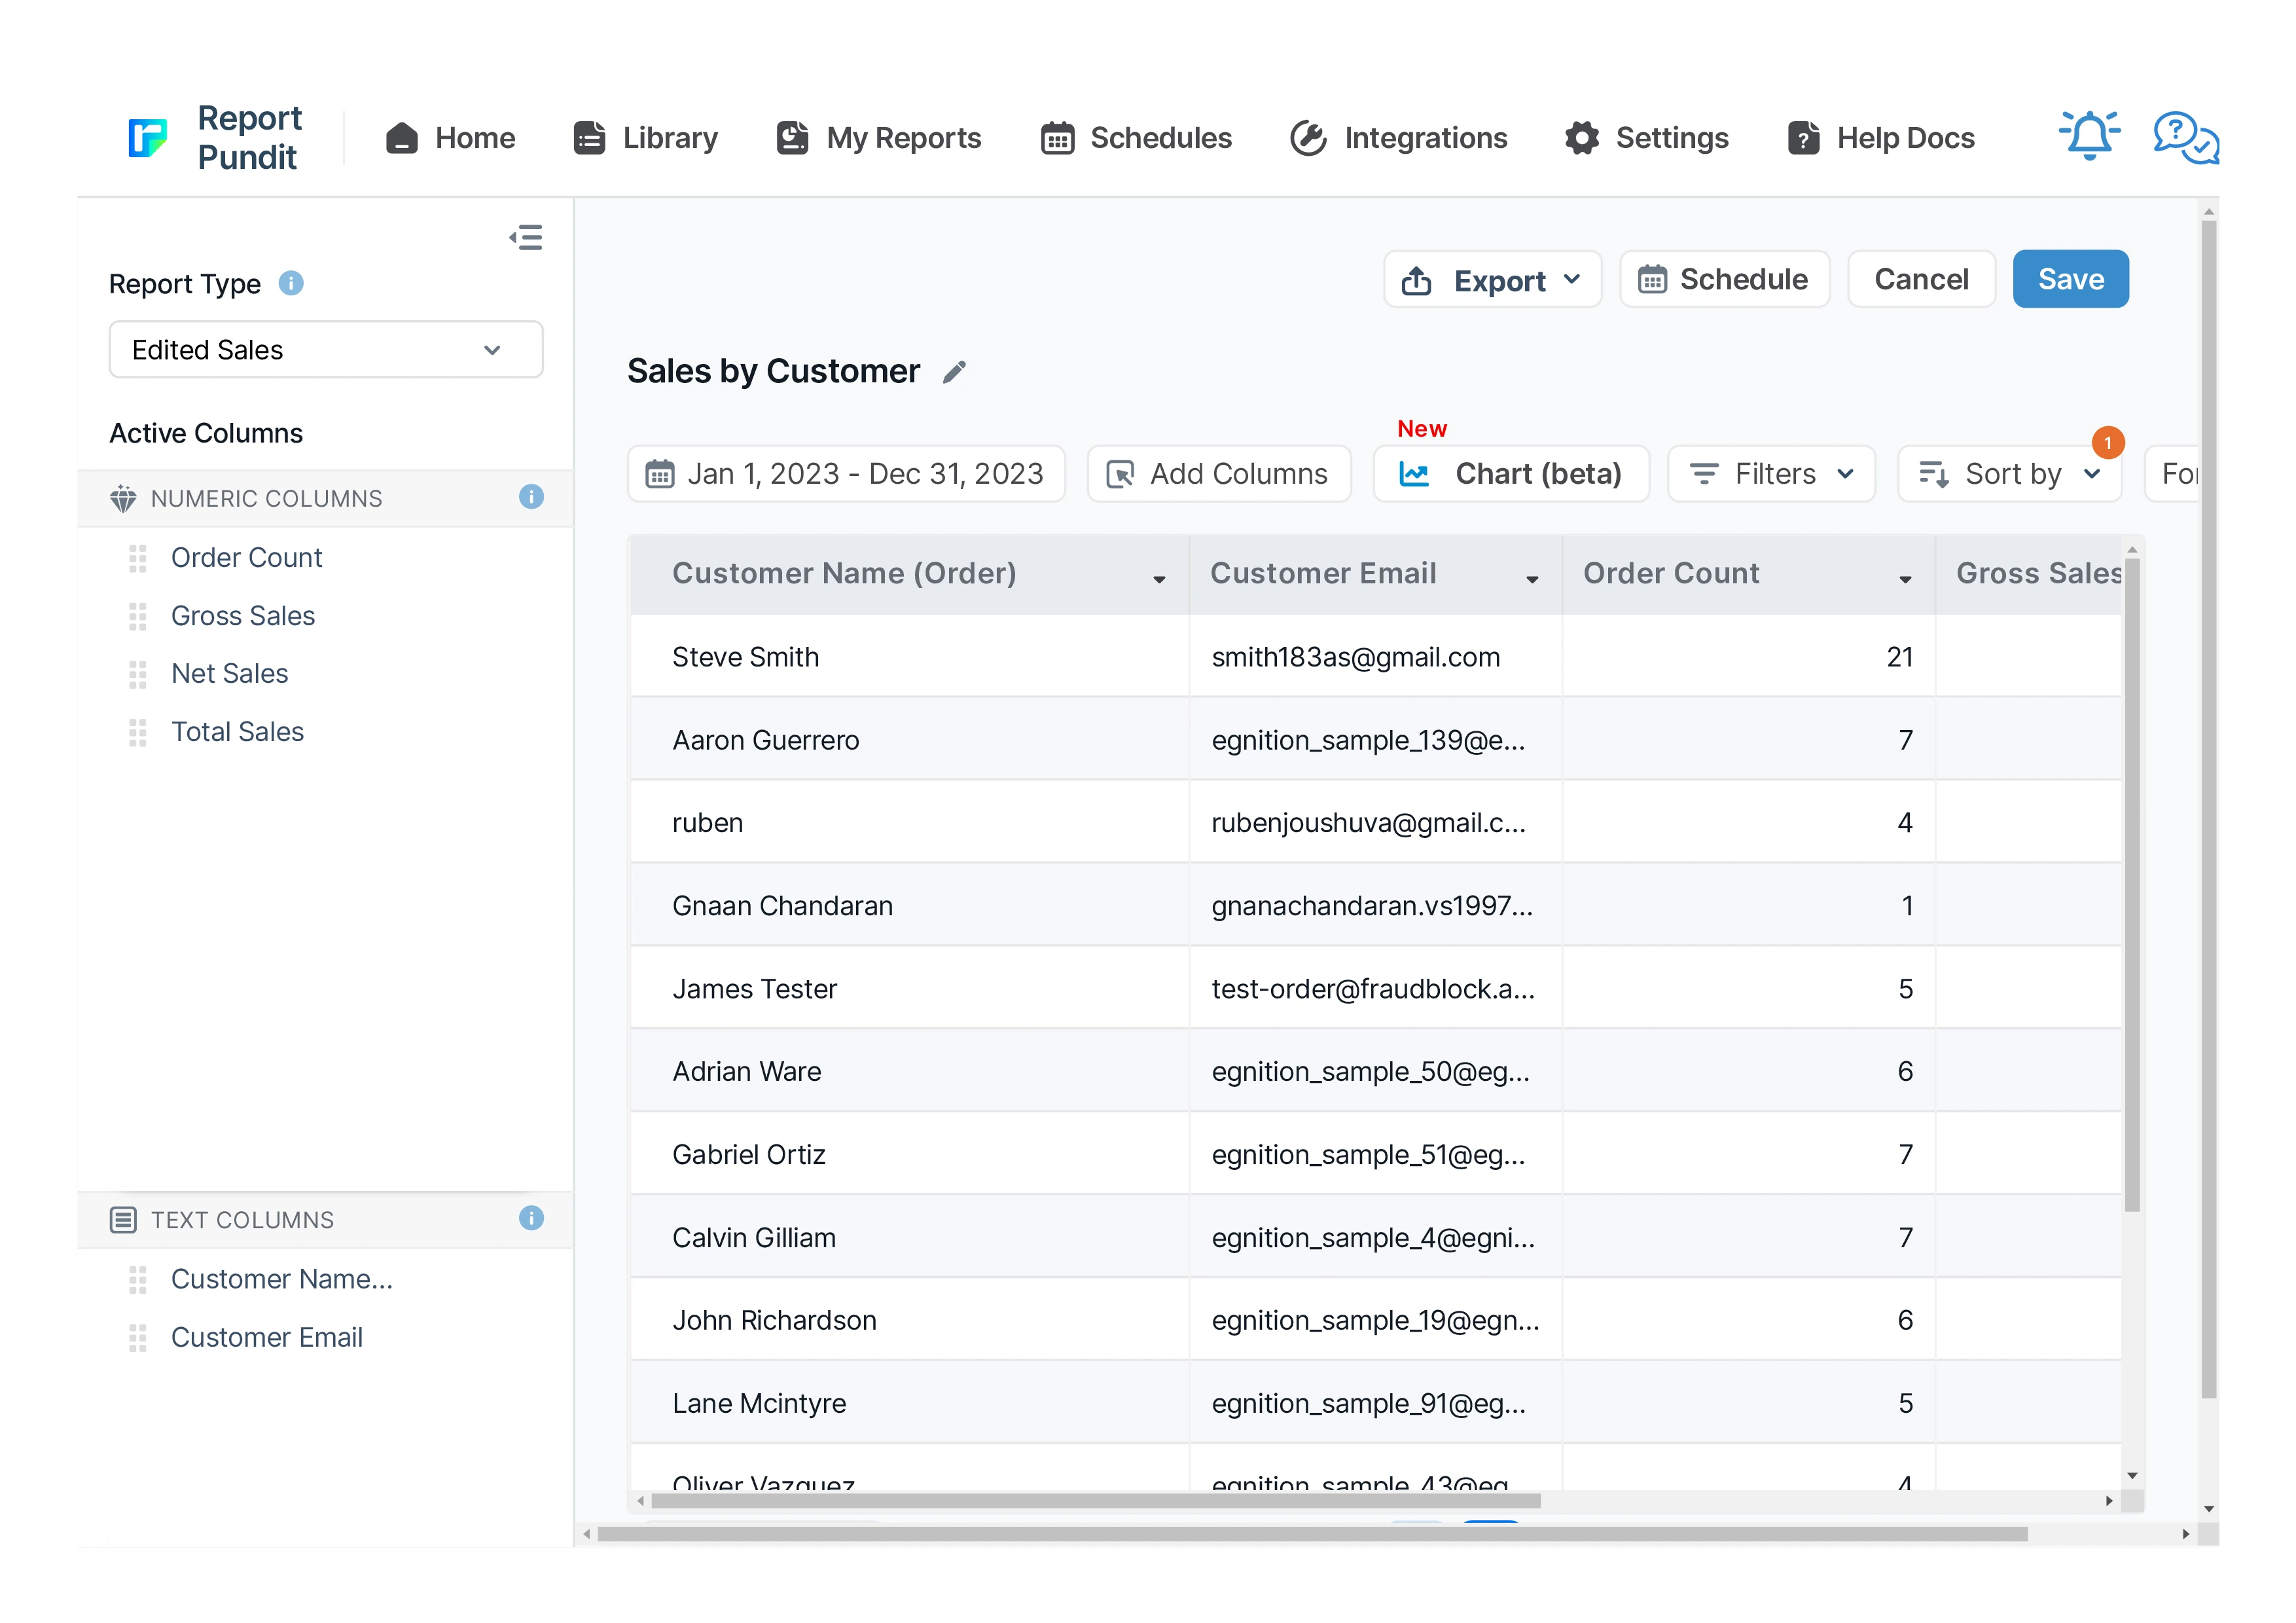
Sample report
Customization & filters
- Filter by tag (VIP, wholesale, subscriber) or location.
- Build a win-back segment by last-order date.
- Switch between period and lifetime spend.
- Add product or category affinity columns for personalization.
- Export a top-customer segment straight to a marketing tool via Google Sheets.
Automate & export
- Schedules — hourly, daily, weekly, monthly, or custom cron
- Delivery formats — Excel, CSV, PDF, or push to Google Sheets in real time
- Group by month or week — trends instead of a static snapshot
- Destinations — email (multiple recipients), Google Sheets, Google Drive, FTP/SFTP, Looker Studio, BigQuery
- Conditional alerts — get notified only if a channel's net sales drop more than X% week-over-week
Report Pundit vs Shopify's native Sales by Channel report
Frequently Asked Questions
Yes. Run the report over a lifetime window and sort by total spend to surface your most valuable customers, or use a period window for recent value.
Filter for customers whose last order is older than a chosen number of days but whose past spend is high — that’s your highest-value re-engagement segment.
Guest and no-consent customers may appear with limited contact detail. Always honour marketing consent before reaching out.
Benefits

Effective Marketing Campaigns
Personalized Engagement
Stocking Decisions
Related Reports
Sales by Fulfillment Location
Data reported to analyze sales based on order fulfillment locations for any specified date range, including product quantity sold and corresponding sales value.
Last 24 Hours Orders
Use the Last 24 Hours Orders report to stay updated on all orders placed within the past day. It provides critical insights into sales trends, customer transactions, and order statuses, allowing you to monitor your store's recent activity and make informed business decisions.
Sales by Variant
Gain detailed insights into each product variant's performance with the Sales by Variant Report. Beyond basic sales data, it shows how each variant impacts your store's success. Use it to fine-tune inventory management and identify popular options, helping you make strategic decisions to boost your bottom line.
Order Tags and Line Item Properties
A detailed report built to include order tags and line items added to each placed order, along with essential sales and product details for thorough analysis and processing.
Order vs Return (Monthly)
A report interpreting monthly returns by comparing the total sales value with the sales value of returned orders, including percentage calculations for both return orders and return value.
Weekly Sales Pattern
Your true day-of-week rhythm — which days and hours actually sell — so you staff, schedule ads, and send emails when buyers are buying.
Sales by Collections
The Sales by Collections report provides a detailed view of your product sales, inventory costs, and profitability by collection, helping you see which collections drive revenue and how they resonate with your audience, allowing you to tailor your product strategies accordingly.
Sales by Staff
A report designed for quick analysis of sales attributed to each staff member across all POS locations, with details from gross sales to net sales calculations.
Sales by Product
The Sales by Product report offers details about each product’s sales performance over a given time frame. It provides valuable insights into which of your products are and aren’t selling well. These insights will enable you to make informed decisions about inventory management and marketing and improve your business.
Sales Over Time
Leverage historical data with the Sales Over Time Report. This report covers costs, order details, sales channels, and payment methods, helping you track trends, manage sales tax returns, and assess the effectiveness of each sales channel.
Finance Summary
The Finance Summary Report provides an overview of your store’s financial performance by aggregating key revenue, expense, and tax data. This report helps store owners understand their overall profitability, cash flow, and key cost drivers, making it essential for budgeting and financial planning
Sales by Billing Location
The Sales by Billing Location report in Shopify provides a detailed breakdown of sales based on the billing addresses of your customers. This report categorizes sales data of your customer base by country, region, or city.
Sales by Device ID
The report displays sales data segmented by device type, such as mobile, desktop, or tablet, allowing merchants to analyze performance based on customer device usage.
Sales by POS
The report provides detailed sales figures and net product counts, accounting for refunds, at each POS location, offering a clear view of actual sales performance and inventory movement.
Sales by Discount Code
Sales by Discount Code report in Report Pundit provides a detailed analysis of sales generated through specific discount codes over a defined period.
Sales by Channel
The Sales by Channel report displays sales data based on the source of each sale. It's a valuable report offering insights into multichannel Shopify selling.
Commission
The Commission Report is the key to rewarding store staff and affiliates for sales they generate. It provides an overview of their sales performance along with calculated commissions share.
Completed Draft Order
This report provides insights into finalized draft orders, displaying detailed information on converted orders, including product details, pricing, and customer data for analysis.
Sales by Checkout Currency
This report displays the breakdown of your sales by customer currency used at the checkout with the total sales value also being displayed in your local currency.
Last 30 days Sales Summary
A report that provides a comprehensive overview of sales performance over the past 30 days, including total revenue, order count, average order value, and product-specific sales trends for detailed analysis.
Sales by Vendor
The Sales by Vendor report analyzes how each vendor's products contribute to your store's success. By examining sales, purchase costs, and profitability, this report provides insights to make strategic decisions, maximize profits, and optimize inventory management based on vendor performance.
Refund
Report Pundit’s Refund Report records the details of money returned by a Shopify merchant to unsatisfied customers when they return the product/service. These reports help the merchant keep track of the refunds issued, monitor customer satisfaction and have a proper record of financial transactions for filing taxes.

Build and automate your
Shopify Reporting
Unlock the full potential of your Shopify store with Report Pundit.
Gain access to over 2000 data fields, automate reports, and make
data-backed decisions to grow your business.