Sales by Device ID Report for Shopify
The report displays sales data segmented by device type, such as mobile, desktop, or tablet, allowing merchants to analyze performance based on customer device usage.


5 from 1,800+ merchants
2,000+ data fields
Trusted by 40,000+ Shopify stores
Updated June 2026
.png)
.png)

.svg)
.svg)
.svg)
Why this report matters
A busy store runs several POS devices, and they don’t perform identically. One register near the entrance does double the volume; another by the fitting rooms barely rings. Without device-level data you’re guessing which is which.
Shopify’s retail reports lean on location and staff; clean per-device reconciliation isn’t a native, schedulable cut on most setups. So managers reconcile each till by hand at close and never compare devices over time.
Grouping sales by device ID gives each register its own line — net sales, basket size, refunds. That’s what you reconcile a drawer against at close, and it’s how you spot an underused checkout point or a device with an odd refund pattern worth investigating.
What’s included
Device
Device ID / register name
The identifier of the physical POS device or register that processed the sale.
Heads up: Device naming/IDs depend on how your POS hardware is registered in Shopify; unnamed devices show as an ID rather than a friendly label. [verify]
Location
The store the device belongs to, for multi-store roll-ups.
Performance
Orders & units
Transactions and items processed on the device.
Gross & net sales
Revenue before and after discounts and returns, per device.
Formula: Net sales = Gross − Discounts − Returns
Average order value
Basket size at the device — a clean register-to-register comparison.
Formula: AOV = Net sales ÷ Orders
Example: Front register $58 AOV vs side register $39 — placement and staffing both matter.
Reconciliation
Refunds & exchanges
Returns processed on the device, separated from sales.
Heads up: An exchange can net near zero in dollars while moving units; reconcile unit movement, not just the net amount.
Cash vs card (where available)
Tender split per device, for drawer reconciliation.
Heads up: Tender detail depends on your payment setup being reported through Report Pundit. [verify]
Who uses this report
Retail manager
Store designer / ops
Loss prevention
Multi-store owner
How to read the report
- Reconcile per device, not per store. A store-level total can balance while one drawer is short; the device line is where discrepancies surface.
- Compare device AOV. Basket differences between registers usually trace to placement or who’s stationed there.
- Flag refund outliers. One device with a high refund share is worth a closer look, for both training and loss prevention.
- Watch utilization. A device doing a fraction of the others’ volume may be redundant — or badly placed.
How to build the report in Report Pundit
- Open Report Pundit in your Shopify admin and choose Create Report (or the pre-built “Sales by Device ID” template).
- Set the data source to Sales / Orders and filter Sales channel to Point of Sale.
- Group the report by POS device ID / register.
- Add columns: Location, Orders, Units, Gross sales, Net sales.
- Add a calculated AOV column and Refunds/exchanges.
- Add a tender (cash vs card) split where your payment data supports it.
- Set the date range (a single day for close-out, longer for comparison) and run.
- Confirm devices are coming through with IDs, then Save.
- Schedule a daily close-out send to store managers, or export to Google Sheets.
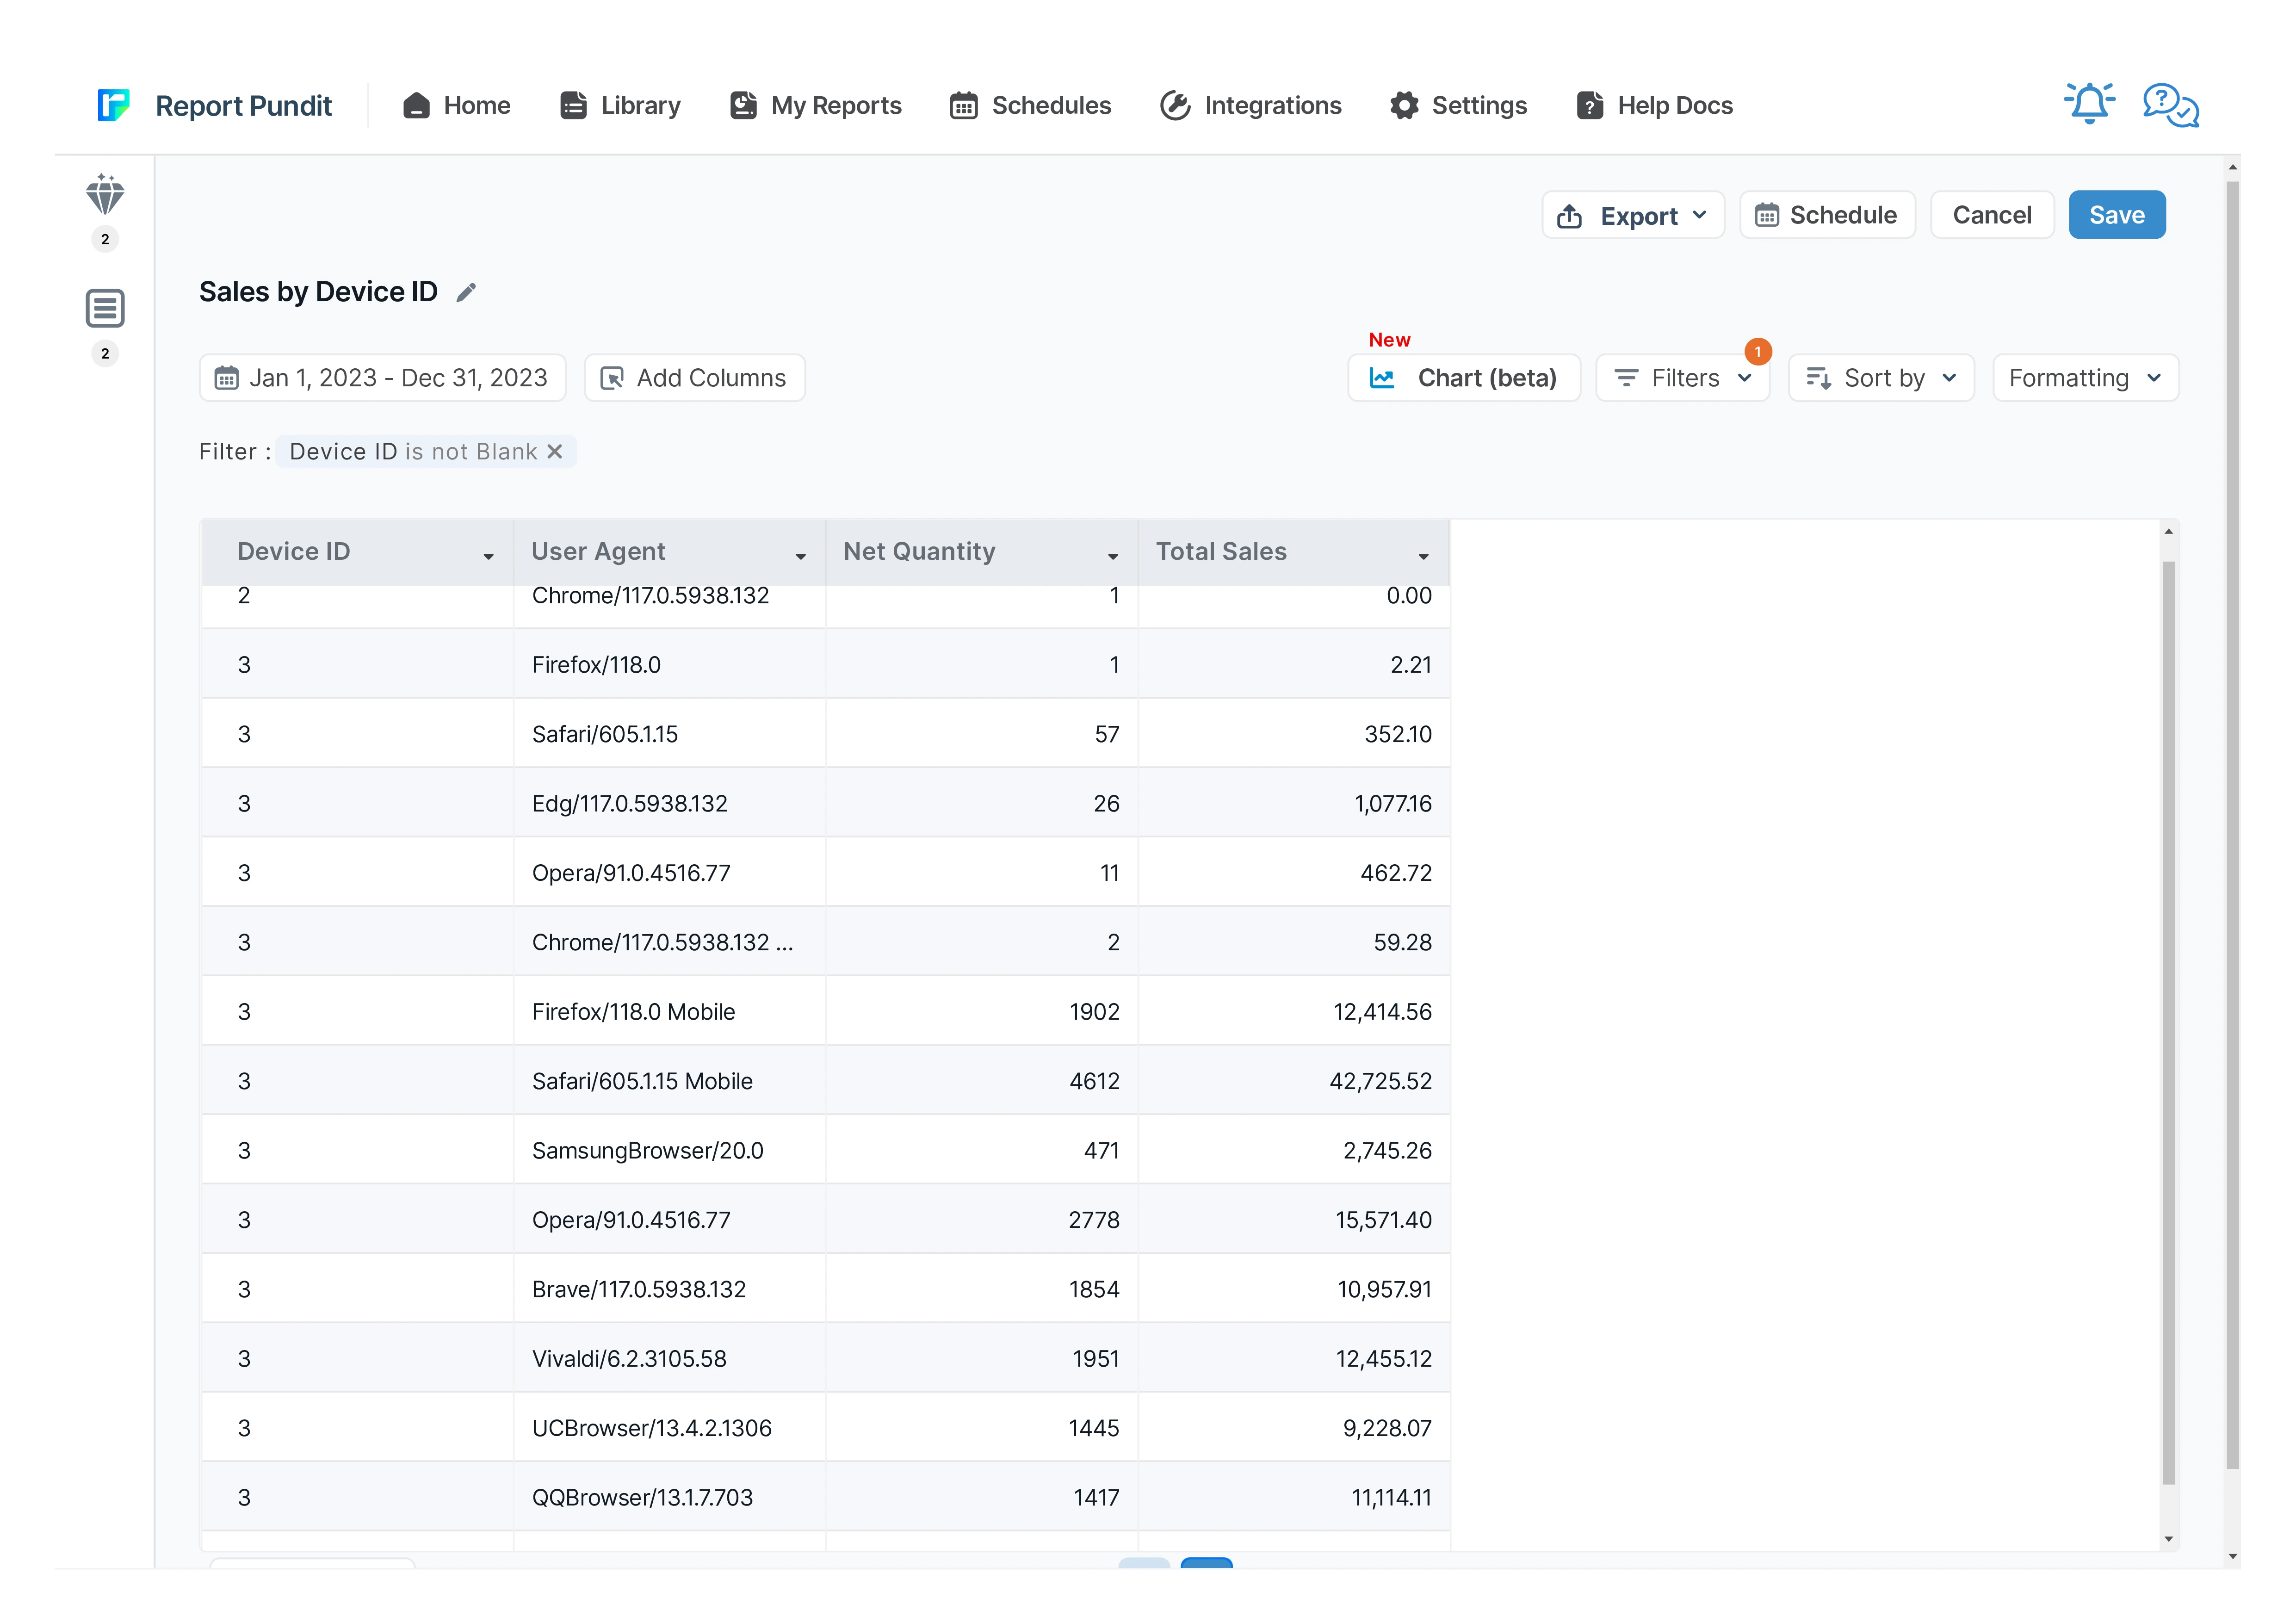
Sample report
Customization & filters
- Filter to one location or one device.
- Group by device then staff to see who worked each register.
- Switch the window between daily close-out and monthly comparison.
- Add a tender split for drawer reconciliation.
- Normalize sales per open hour for a fair device comparison.
Automate & export
- Schedules — hourly, daily, weekly, monthly, or custom cron
- Delivery formats — Excel, CSV, PDF, or push to Google Sheets in real time
- Group by month or week — trends instead of a static snapshot
- Destinations — email (multiple recipients), Google Sheets, Google Drive, FTP/SFTP, Looker Studio, BigQuery
- Conditional alerts — get notified only if a channel's net sales drop more than X% week-over-week
Report Pundit vs Shopify's native Sales by Channel report
Frequently Asked Questions
Yes. Device-level data comes from Shopify POS activity, so the report covers in-person sales. Without POS in use there are no devices to break down.
Sales by POS groups by location and staff; this drills to the individual register/device. Use it for till-by-till reconciliation and to compare hardware utilization within a store.
It shows whatever identifier your POS hardware is registered with. If devices aren’t named, they appear as IDs — worth naming them in Shopify for readable reports.
Benefits

Device Identification
Device Performance
Sales Trends by Device
Related Reports
Weekly Sales Pattern
Your true day-of-week rhythm — which days and hours actually sell — so you staff, schedule ads, and send emails when buyers are buying.
Commission
The Commission Report is the key to rewarding store staff and affiliates for sales they generate. It provides an overview of their sales performance along with calculated commissions share.
Sales Over Time
Leverage historical data with the Sales Over Time Report. This report covers costs, order details, sales channels, and payment methods, helping you track trends, manage sales tax returns, and assess the effectiveness of each sales channel.
Sales by Variant
Gain detailed insights into each product variant's performance with the Sales by Variant Report. Beyond basic sales data, it shows how each variant impacts your store's success. Use it to fine-tune inventory management and identify popular options, helping you make strategic decisions to boost your bottom line.
Sales by Checkout Currency
This report displays the breakdown of your sales by customer currency used at the checkout with the total sales value also being displayed in your local currency.
Order Tags and Line Item Properties
A detailed report built to include order tags and line items added to each placed order, along with essential sales and product details for thorough analysis and processing.
Sales by Vendor
The Sales by Vendor report analyzes how each vendor's products contribute to your store's success. By examining sales, purchase costs, and profitability, this report provides insights to make strategic decisions, maximize profits, and optimize inventory management based on vendor performance.
Sales by Billing Location
The Sales by Billing Location report in Shopify provides a detailed breakdown of sales based on the billing addresses of your customers. This report categorizes sales data of your customer base by country, region, or city.
Sales by POS
The report provides detailed sales figures and net product counts, accounting for refunds, at each POS location, offering a clear view of actual sales performance and inventory movement.
Last 30 days Sales Summary
A report that provides a comprehensive overview of sales performance over the past 30 days, including total revenue, order count, average order value, and product-specific sales trends for detailed analysis.
Sales by Fulfillment Location
Data reported to analyze sales based on order fulfillment locations for any specified date range, including product quantity sold and corresponding sales value.
Last 24 Hours Orders
Use the Last 24 Hours Orders report to stay updated on all orders placed within the past day. It provides critical insights into sales trends, customer transactions, and order statuses, allowing you to monitor your store's recent activity and make informed business decisions.
Sales by Collections
The Sales by Collections report provides a detailed view of your product sales, inventory costs, and profitability by collection, helping you see which collections drive revenue and how they resonate with your audience, allowing you to tailor your product strategies accordingly.
Detailed Sales
The full-detail sales export — every line with channel, payment, tax, cost, and margin — built for deep analysis and your data warehouse.
Finance Summary
The Finance Summary Report provides an overview of your store’s financial performance by aggregating key revenue, expense, and tax data. This report helps store owners understand their overall profitability, cash flow, and key cost drivers, making it essential for budgeting and financial planning
Sales by Staff
A report designed for quick analysis of sales attributed to each staff member across all POS locations, with details from gross sales to net sales calculations.
Sales by Customer
The Sales by Customer Report provides Shopify merchants with valuable insights into customer purchasing behavior. This report breaks down sales by individual customers, highlighting the most valuable and active customers.
Sales by Channel
The Sales by Channel report displays sales data based on the source of each sale. It's a valuable report offering insights into multichannel Shopify selling.
Sales by Product
The Sales by Product report offers details about each product’s sales performance over a given time frame. It provides valuable insights into which of your products are and aren’t selling well. These insights will enable you to make informed decisions about inventory management and marketing and improve your business.
Sales by Discount Code
Sales by Discount Code report in Report Pundit provides a detailed analysis of sales generated through specific discount codes over a defined period.
Refund
Report Pundit’s Refund Report records the details of money returned by a Shopify merchant to unsatisfied customers when they return the product/service. These reports help the merchant keep track of the refunds issued, monitor customer satisfaction and have a proper record of financial transactions for filing taxes.

Build and automate your Shopify Reporting
Unlock the full potential of your Shopify store with Report Pundit. Gain access to over 2000 data fields, automate reports, and make data-backed decisions to grow your business.