Out of Stock Product Report for Shopify
A report listing products that are out of stock, including essential details such as product inventory and the location where the stock was depleted.


5 from 1,800+ merchants
2,000+ data fields
Trusted by 40,000+ Shopify stores
Updated June 2026
.png)
.png)

.svg)
.svg)
.svg)
Why the Out of Stock Product Report matters
Stock-outs are silent killers. A product that's been out of stock for three weeks doesn't show up in your sales reports - because it's not selling. The losses appear nowhere on your dashboard, even though customers are landing on the page, hitting "Out of Stock," and leaving.
Industry data is sobering: roughly 8% of items in stores are out-of-stock at any given time, rising to 10% on promoted items, and the average shopper encounters one stock-out per visit. Stock-outs lead to lost sales, lower conversion, customer switching to competitors, and reduced loyalty over time.
The Out of Stock Product Report turns the invisible into actionable. It surfaces every out-of-stock variant - including the ones still showing as "Active" on your storefront - so you can fix the issue before another day of lost revenue passes. Pair it with Potential Revenue Lost Due to Abandoned Cart Product Report for the financial impact.
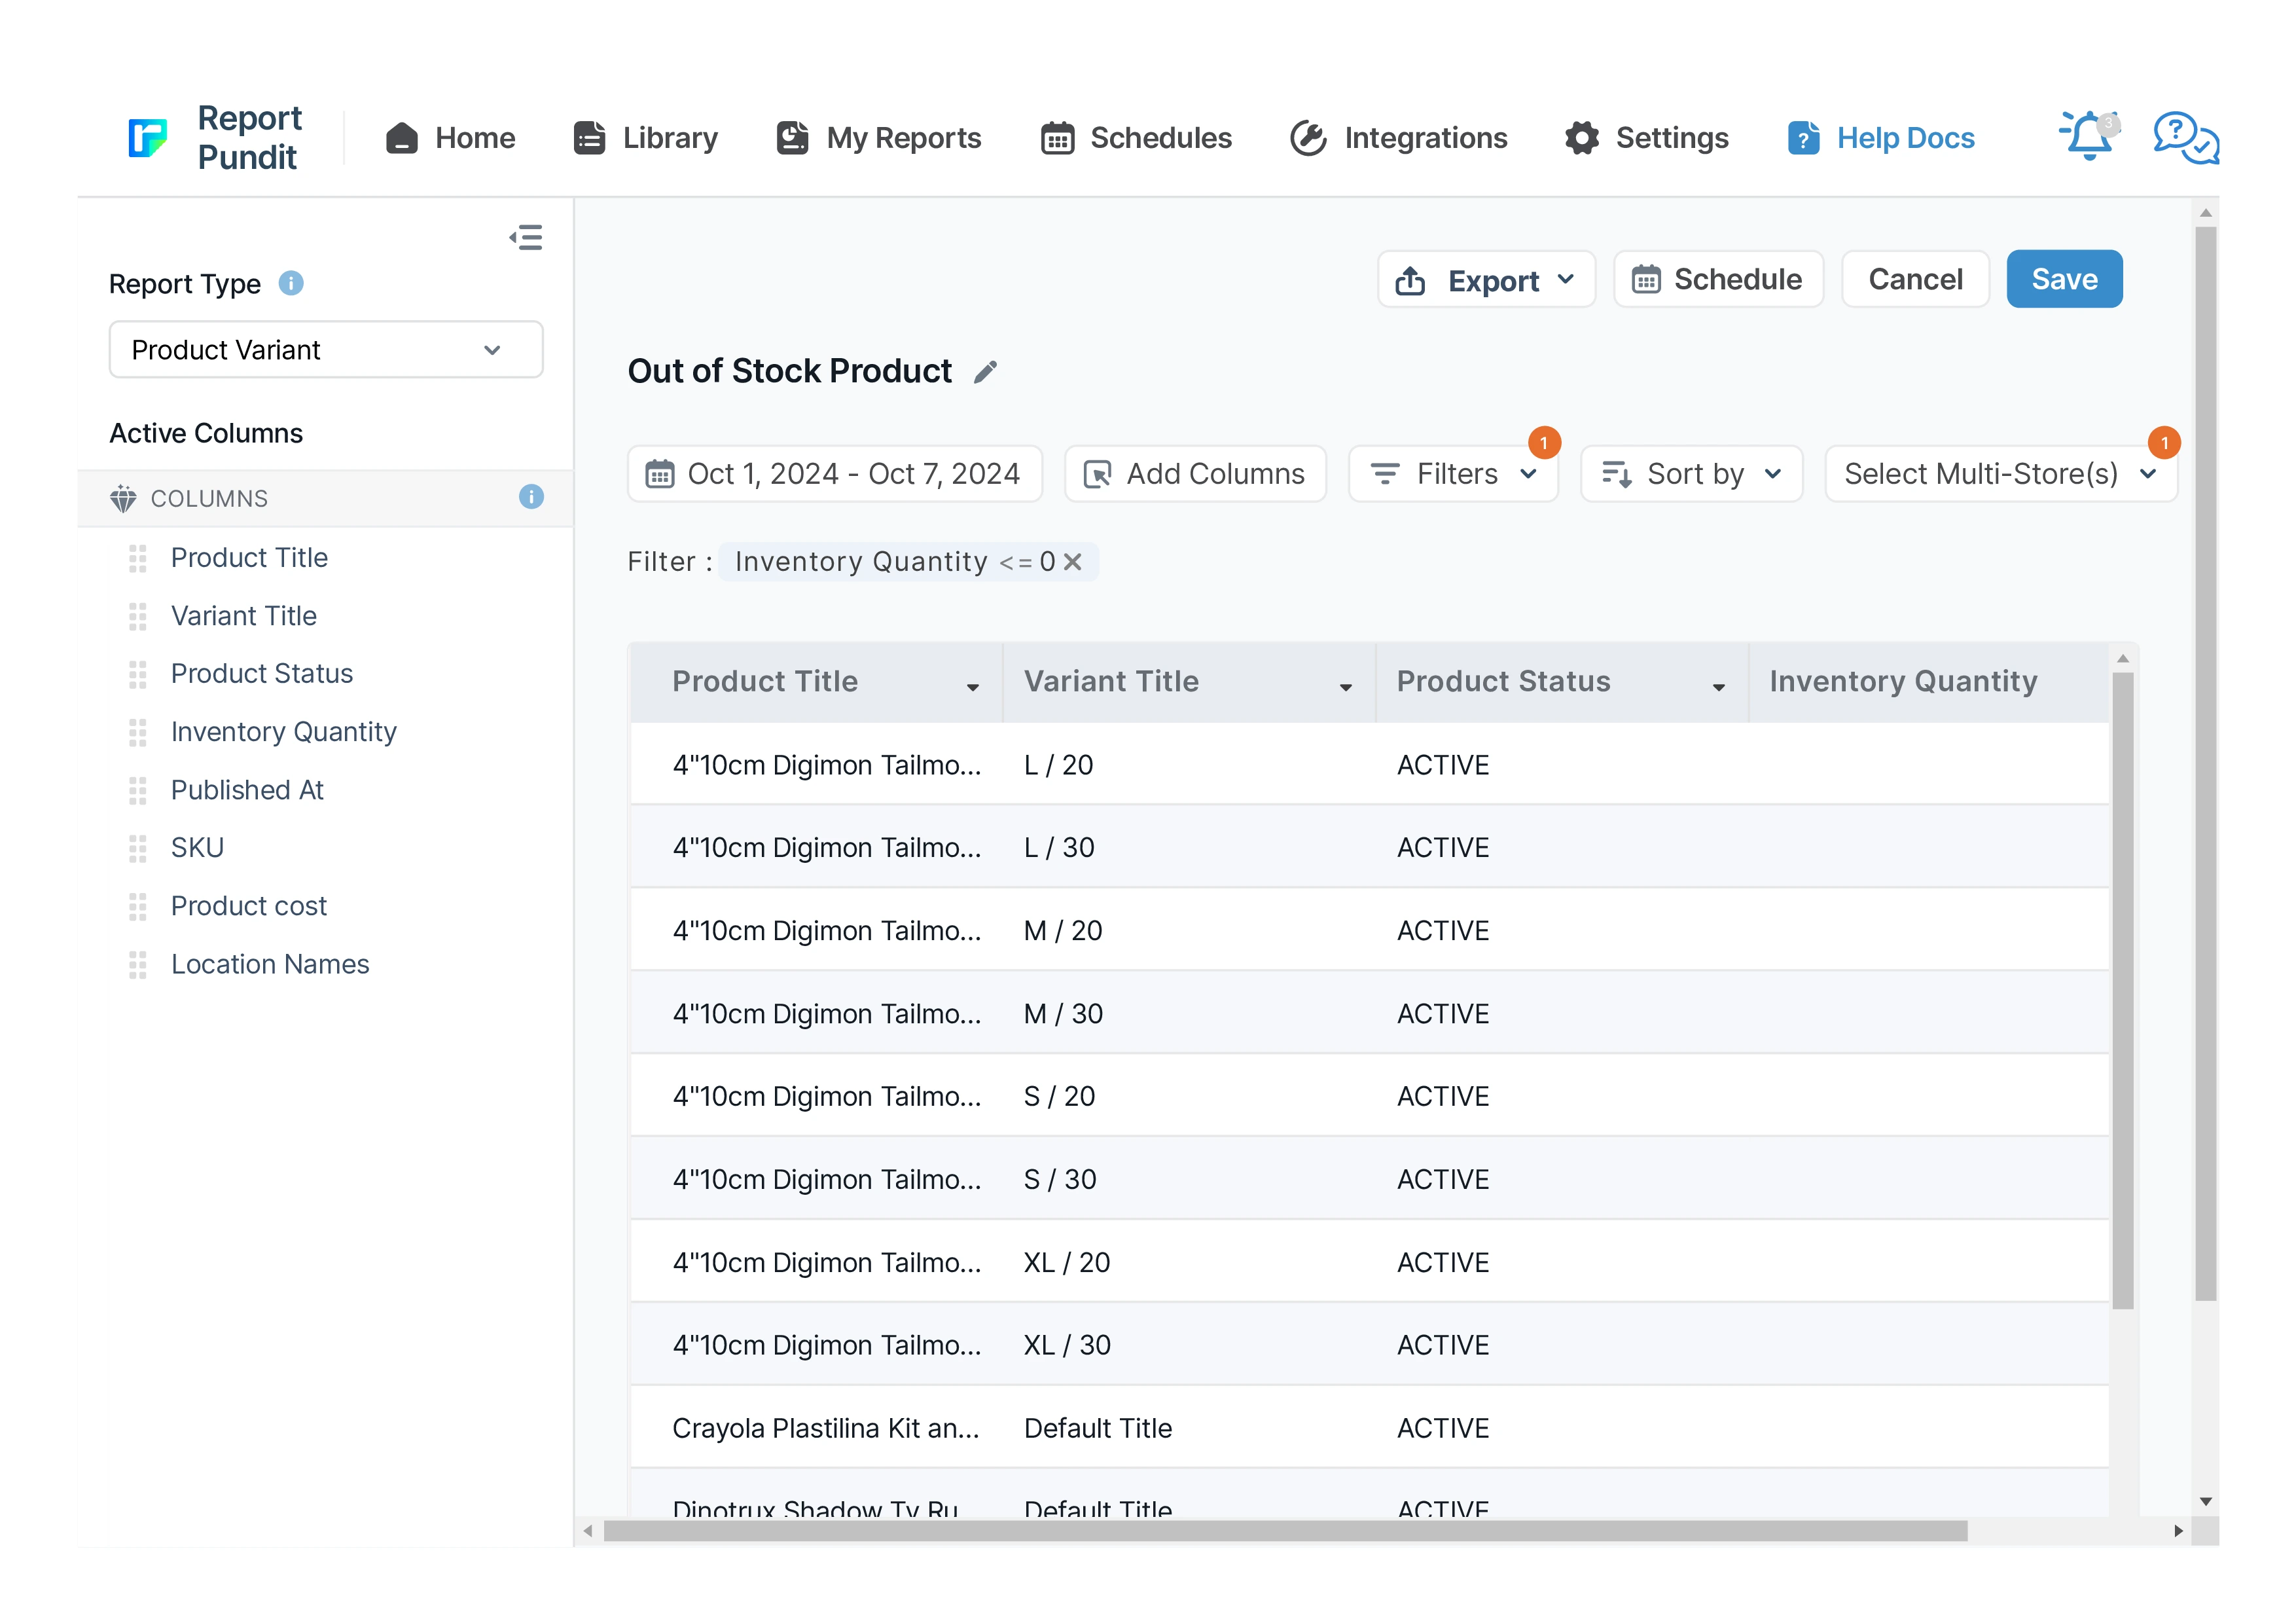
What's included in the report
Inventory Quantity - Will be 0 (or negative for over-committed stock).
Location - Where the stock-out is occurring. Critical for multi-location merchants.
Product Status - Active, Draft, or Archived. Out-of-stock + Active is the urgent case.
Published Date - When the product first went live. Long-lived listings out of stock are a different fix than new launches.
Product Cost - For reorder budgeting.
Vendor - Group by supplier to build vendor-specific reorder lists.
Inventory Cost - Cost-side reference for inventory still committed.
Last Sold Date · Sales Velocity (last 30 days) · Days Since Stock-Out · Inventory Days Lost Sales · Revenue Lost Estimate
Who uses this report - 4 scenarios
1. Replenishment teams building today's reorder list
2. Multi-location retailers planning stock transfers
3. Ecommerce managers protecting conversion rate
4. Vendor managers tracking supplier reliability
How to read the Out of Stock Product Report
• Active + Out-of-Stock is the urgent bucket. These items are visible to shoppers and can't be sold. Fix these first.
• Negative inventory. Indicates over-committed stock. Check fulfillment status - orders may be at risk.
• Long-published + out-of-stock. A product live for 12 months and out for 30 days is a different problem than a new launch with a delayed shipment. Different decisions.
• Vendor patterns. If 4 of your top-10 stock-outs share one vendor, that's a procurement conversation.
How to build the report in Report Pundit
- Install Report Pundit from the Shopify App Store. 14-day free trial. No card required.
- Open Report Pundit from your Shopify admin and click Pre-built Reports.
- Select Out of Stock Product Report from the Inventory category.
- Apply filters (location, vendor, collection, product tag, product type, status - whatever fits).
- Customize columns - add COGS, inventory days remaining, sales velocity, sell-through, or any of 2,000+ fields.
- Run the report. Results load in seconds for most stores.
Export or schedule - Google Sheets, Excel, CSV, PDF, or scheduled email delivery to your team.
Sample report
Customization & filters
• Filter by Status - typically Active to focus on urgent stock-outs
• Filter by Location - see stock-outs per warehouse
• Filter by Vendor - build supplier-specific reorder lists
• Add Sales Velocity (last 30 days) - prioritize fast-movers first
• Add Days Since Stock-Out - turn the snapshot into urgency
• Conditional alert: email when a top-10 SKU goes out of stock
Automate & export
- Schedules — hourly, daily, weekly, monthly, or custom cron
- Delivery formats — Excel, CSV, PDF, or push to Google Sheets in real time
- Group by month or week — trends instead of a static snapshot
- Destinations — email (multiple recipients), Google Sheets, Google Drive, FTP/SFTP, Looker Studio, BigQuery
- Conditional alerts — get notified only if a channel's net sales drop more than X% week-over-week
Report Pundit vs Shopify's native Sales by Channel report
Frequently Asked Questions
A report listing every product and variant currently at zero or negative inventory. Includes SKU, location, vendor, and product status so you can prioritize reorders, transfers, or page-hiding.
Daily for most stores; hourly for high-velocity DTC or marketplace operations. Schedule it to email automatically so your ops team starts every morning with the action list.
Yes. A product can be out at one location while in stock elsewhere. The Location column makes that visible so you can plan a transfer rather than wait for a reorder.
Benefits

Out-of-Stock Products
Track Stock Depletion

Inventory Control
Related Reports
Inventory Shipments
Every inbound shipment tracked end to end — shipped, received, accepted, and rejected quantities with acceptance rate — so you can catch discrepancies, plan around arrivals, and benchmark supplier reliability.
Inventory by Collections
This report provides a detailed view of inventory levels, organized by product collections, allowing businesses to track stock availability and manage inventory efficiently.
Inventory level Indicator
The report provides Shopify merchants with a real-time analysis of stock levels, highlighting products that are overstocked, optimally stocked, or understocked. This report is essential for monitoring stock health and ensuring that inventory levels align with demand.
Inventory Cost
The Inventory Cost Report provides a comprehensive analysis of the costs associated with your inventory, giving you a clear view of the financial investment tied up in stock. This report calculates the cost of inventory on hand and can include both current and historical cost data
Inventory Reorder Point
This report helps identify the exact point at which inventory should be restocked to prevent any interruptions in product availability, ensuring a smooth supply chain from both your inventory and your vendor's end. It informs the merchant about the sales velocity, lead time, and safety stock.
Inventory by Location
A report organized by inventory locations, detailing products and variants on hand, with a breakdown of the value for each product.
Inventory on Hand
A real-time snapshot of every product, variant, and SKU in stock - across every warehouse, retail location, and 3PL - with vendor, cost, and inventory value in a single view.
Inventory Status
A comprehensive overview of product inventory, detailing the quantity available for products that are live, in draft, or have been archived.
Low Stock Product
The Low Stock Product Report highlights products that are approaching or have reached a low stock threshold, helping Shopify merchants proactively manage restocking needs. This report is crucial for preventing stockouts on popular items and ensuring seamless sales without interruption
Inventory Sale Value
A report outlining the sale value of your inventory, including details on product quantities, variants, collections, and total value based on current sale prices for analysis.
Inventory Replenishment
A ready-to-action list of exactly which products need reordering now — driven by real sell-through velocity, adjusted for stock already on its way, and broken down by location.
Inventory Transfers
Every stock movement between your locations in one view — origin, destination, status, and received-vs-rejected quantities — so you can balance stock, reconcile transfers, and measure internal lead times.
Inventory Sell-Through
The percentage of stock that actually sold for every product and variant so you can separate the fast-movers worth reordering from the dead stock eating your shelf space and cash.
Inventory by Product Type
This is grouped inventory data organized by custom product types, alongside product and variant details, providing a comprehensive view to analyze overall inventory status.

Build and automate your
Shopify Reporting
Unlock the full potential of your Shopify store with Report Pundit.
Gain access to over 2000 data fields, automate reports, and make
data-backed decisions to grow your business.