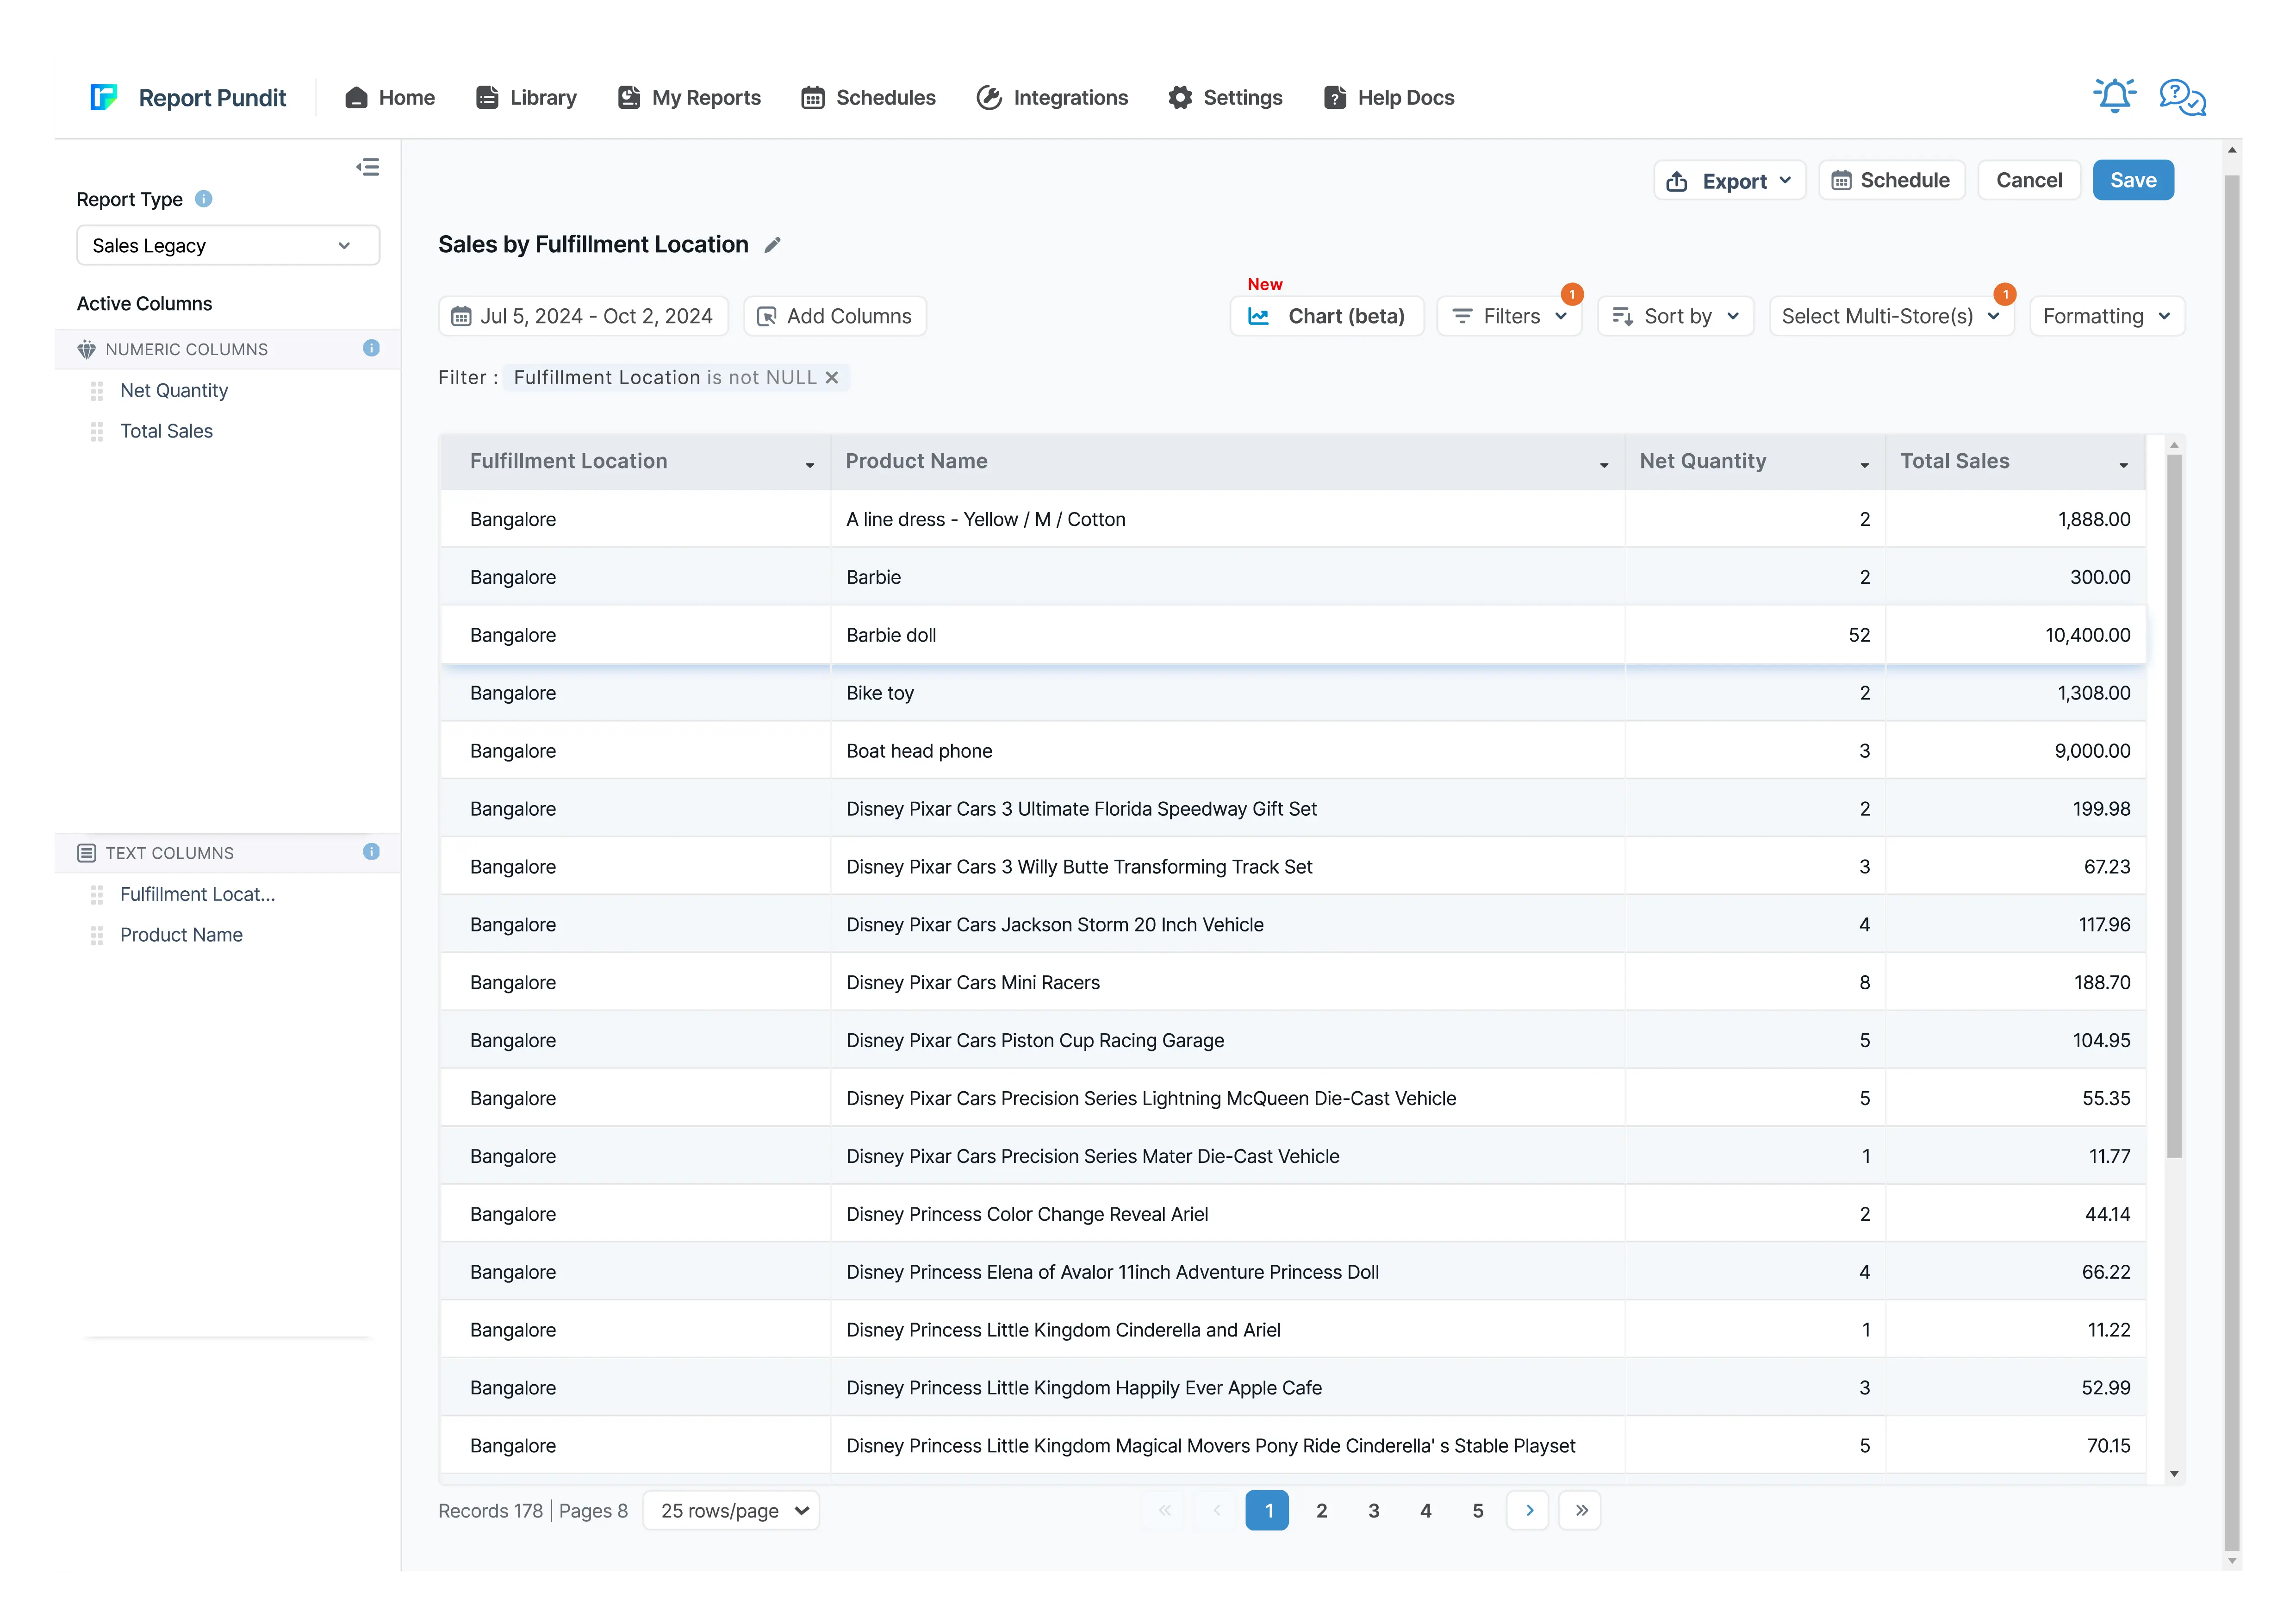
Sales by Fulfillment Location Report for Shopify
Data reported to analyze sales based on order fulfillment locations for any specified date range, including product quantity sold and corresponding sales value.


5 from 1,800+ merchants
2,000+ data fields
Trusted by 40,000+ Shopify stores
Updated June 2026
.png)
.png)

.svg)
.svg)
.svg)
Why this report matters
When you fulfill from more than one place — two warehouses, several stores, a 3PL — the location that ships an order isn’t the same as where the customer is or where they pay. The fulfillment side is its own operational picture, and it drives inventory and staffing.
Shopify’s native sales reports center on billing and channel, not a clean per-fulfillment-location sales cut you can schedule. So the team carrying the shipping load can’t easily see how much of it they’re carrying.
Grouping sales by fulfillment location shows where demand actually lands and ships. That’s the input for balancing stock across sites, staffing the busy warehouse, and deciding whether a new fulfillment point near a demand cluster would cut both cost and delivery time.
What’s included
Location
Fulfillment location
The location an order (or line) was fulfilled from — warehouse, store, or 3PL.
Heads up: An order can split across locations; decide whether to count it once or per fulfilling location before comparing totals.
Location type
Whether the location is a warehouse, retail store, or third-party site.
Volume & revenue
Orders & units
Orders and items fulfilled from each location.
Net sales
Revenue attributed to each fulfillment location.
Formula: Net sales = Gross − Discounts − Returns
% of fulfilled sales
Each location’s share of the fulfillment load.
Formula: Location share = Location net sales ÷ Total net sales × 100
Operational
Units per order
Average pick size at the location, a workload proxy.
Formula: Units per order = Units ÷ Orders
Split-shipment indicator
Whether orders fulfilled here were split across multiple locations.
Heads up: A high split rate raises shipping cost and delivery time — a candidate for stock-balancing.
Who uses this report
Inventory planner
Ops / warehouse manager
Owner
Finance / ops
How to read the report
- Separate fulfillment from billing. This is where orders ship from, not where customers are — the operational twin of the billing-location view.
- Decide how splits count. Orders split across sites can double-count; pick a rule (once vs per location) and hold it.
- Read units per order as workload. Two locations with equal sales but different pick sizes have very different labor needs.
- Hunt split shipments. A high split rate is a stock-placement problem that quietly raises cost and slows delivery.
How to build the report in Report Pundit
- Open Report Pundit in your Shopify admin and choose Create Report (or the pre-built “Sales by Fulfillment Location” template).
- Set the data source to Sales / Orders with fulfillment detail.
- Group by Fulfillment location.
- Add columns: Location type, Orders, Units, Net sales.
- Add calculated Location-share and Units-per-order columns.
- Add a split-shipment indicator where you track multi-location fulfillment.
- Decide how split orders are counted, set the date range, and run.
- Confirm totals reconcile to overall net sales, then Save.
- Schedule a weekly send to ops and planning, or export to Google Sheets.
Sample report
Customization & filters
- Count split orders once or per fulfilling location.
- Filter to a single location or location type.
- Add a prior-period comparison to track load shifts.
- Pair with inventory reports to balance stock.
- Add a shipping-cost column where a carrier feed is connected.
Automate & export
- Schedules — hourly, daily, weekly, monthly, or custom cron
- Delivery formats — Excel, CSV, PDF, or push to Google Sheets in real time
- Group by month or week — trends instead of a static snapshot
- Destinations — email (multiple recipients), Google Sheets, Google Drive, FTP/SFTP, Looker Studio, BigQuery
- Conditional alerts — get notified only if a channel's net sales drop more than X% week-over-week
Report Pundit vs Shopify's native Sales by Channel report
Frequently Asked Questions
Billing location is where the customer pays; fulfillment location is where the order ships from. This report is the operational view — inventory, staffing, and shipping cost all follow the fulfilling location.
An order can be fulfilled from more than one site. You decide whether to count it once or once per fulfilling location — just keep the rule consistent so comparisons hold.
Yes. Compare where fulfilled sales concentrate against where customers are (billing location) to site a new fulfillment point that cuts shipping cost and delivery time.
Benefits

Optimize Inventory Allocation
Identify Profitable Fulfillment Centers
Track products by Fulfilment Location
Related Reports
Sales by Staff
A report designed for quick analysis of sales attributed to each staff member across all POS locations, with details from gross sales to net sales calculations.
Last 24 Hours Orders
Use the Last 24 Hours Orders report to stay updated on all orders placed within the past day. It provides critical insights into sales trends, customer transactions, and order statuses, allowing you to monitor your store's recent activity and make informed business decisions.
Sales by Vendor
The Sales by Vendor report analyzes how each vendor's products contribute to your store's success. By examining sales, purchase costs, and profitability, this report provides insights to make strategic decisions, maximize profits, and optimize inventory management based on vendor performance.
Order Tags and Line Item Properties
A detailed report built to include order tags and line items added to each placed order, along with essential sales and product details for thorough analysis and processing.
Sales by Channel
The Sales by Channel report displays sales data based on the source of each sale. It's a valuable report offering insights into multichannel Shopify selling.
Sales by Collections
The Sales by Collections report provides a detailed view of your product sales, inventory costs, and profitability by collection, helping you see which collections drive revenue and how they resonate with your audience, allowing you to tailor your product strategies accordingly.
Last 30 days Sales Summary
A report that provides a comprehensive overview of sales performance over the past 30 days, including total revenue, order count, average order value, and product-specific sales trends for detailed analysis.
Completed Draft Order
This report provides insights into finalized draft orders, displaying detailed information on converted orders, including product details, pricing, and customer data for analysis.
Detailed Sales
The full-detail sales export — every line with channel, payment, tax, cost, and margin — built for deep analysis and your data warehouse.
Sales by Customer
The Sales by Customer Report provides Shopify merchants with valuable insights into customer purchasing behavior. This report breaks down sales by individual customers, highlighting the most valuable and active customers.
Sales by Billing Location
The Sales by Billing Location report in Shopify provides a detailed breakdown of sales based on the billing addresses of your customers. This report categorizes sales data of your customer base by country, region, or city.
Sales by Product
The Sales by Product report offers details about each product’s sales performance over a given time frame. It provides valuable insights into which of your products are and aren’t selling well. These insights will enable you to make informed decisions about inventory management and marketing and improve your business.
Order vs Return (Monthly)
A report interpreting monthly returns by comparing the total sales value with the sales value of returned orders, including percentage calculations for both return orders and return value.
Sales by Discount Code
Sales by Discount Code report in Report Pundit provides a detailed analysis of sales generated through specific discount codes over a defined period.
Sales by Variant
Gain detailed insights into each product variant's performance with the Sales by Variant Report. Beyond basic sales data, it shows how each variant impacts your store's success. Use it to fine-tune inventory management and identify popular options, helping you make strategic decisions to boost your bottom line.
Commission
The Commission Report is the key to rewarding store staff and affiliates for sales they generate. It provides an overview of their sales performance along with calculated commissions share.
Sales Over Time
Leverage historical data with the Sales Over Time Report. This report covers costs, order details, sales channels, and payment methods, helping you track trends, manage sales tax returns, and assess the effectiveness of each sales channel.
Finance Summary
The Finance Summary Report provides an overview of your store’s financial performance by aggregating key revenue, expense, and tax data. This report helps store owners understand their overall profitability, cash flow, and key cost drivers, making it essential for budgeting and financial planning
Weekly Sales Pattern
Your true day-of-week rhythm — which days and hours actually sell — so you staff, schedule ads, and send emails when buyers are buying.
Sales by Checkout Currency
This report displays the breakdown of your sales by customer currency used at the checkout with the total sales value also being displayed in your local currency.
Sales by POS
The report provides detailed sales figures and net product counts, accounting for refunds, at each POS location, offering a clear view of actual sales performance and inventory movement.
Sales by Device ID
The report displays sales data segmented by device type, such as mobile, desktop, or tablet, allowing merchants to analyze performance based on customer device usage.
Refund
Report Pundit’s Refund Report records the details of money returned by a Shopify merchant to unsatisfied customers when they return the product/service. These reports help the merchant keep track of the refunds issued, monitor customer satisfaction and have a proper record of financial transactions for filing taxes.

Build and automate your Shopify Reporting
Unlock the full potential of your Shopify store with Report Pundit. Gain access to over 2000 data fields, automate reports, and make data-backed decisions to grow your business.