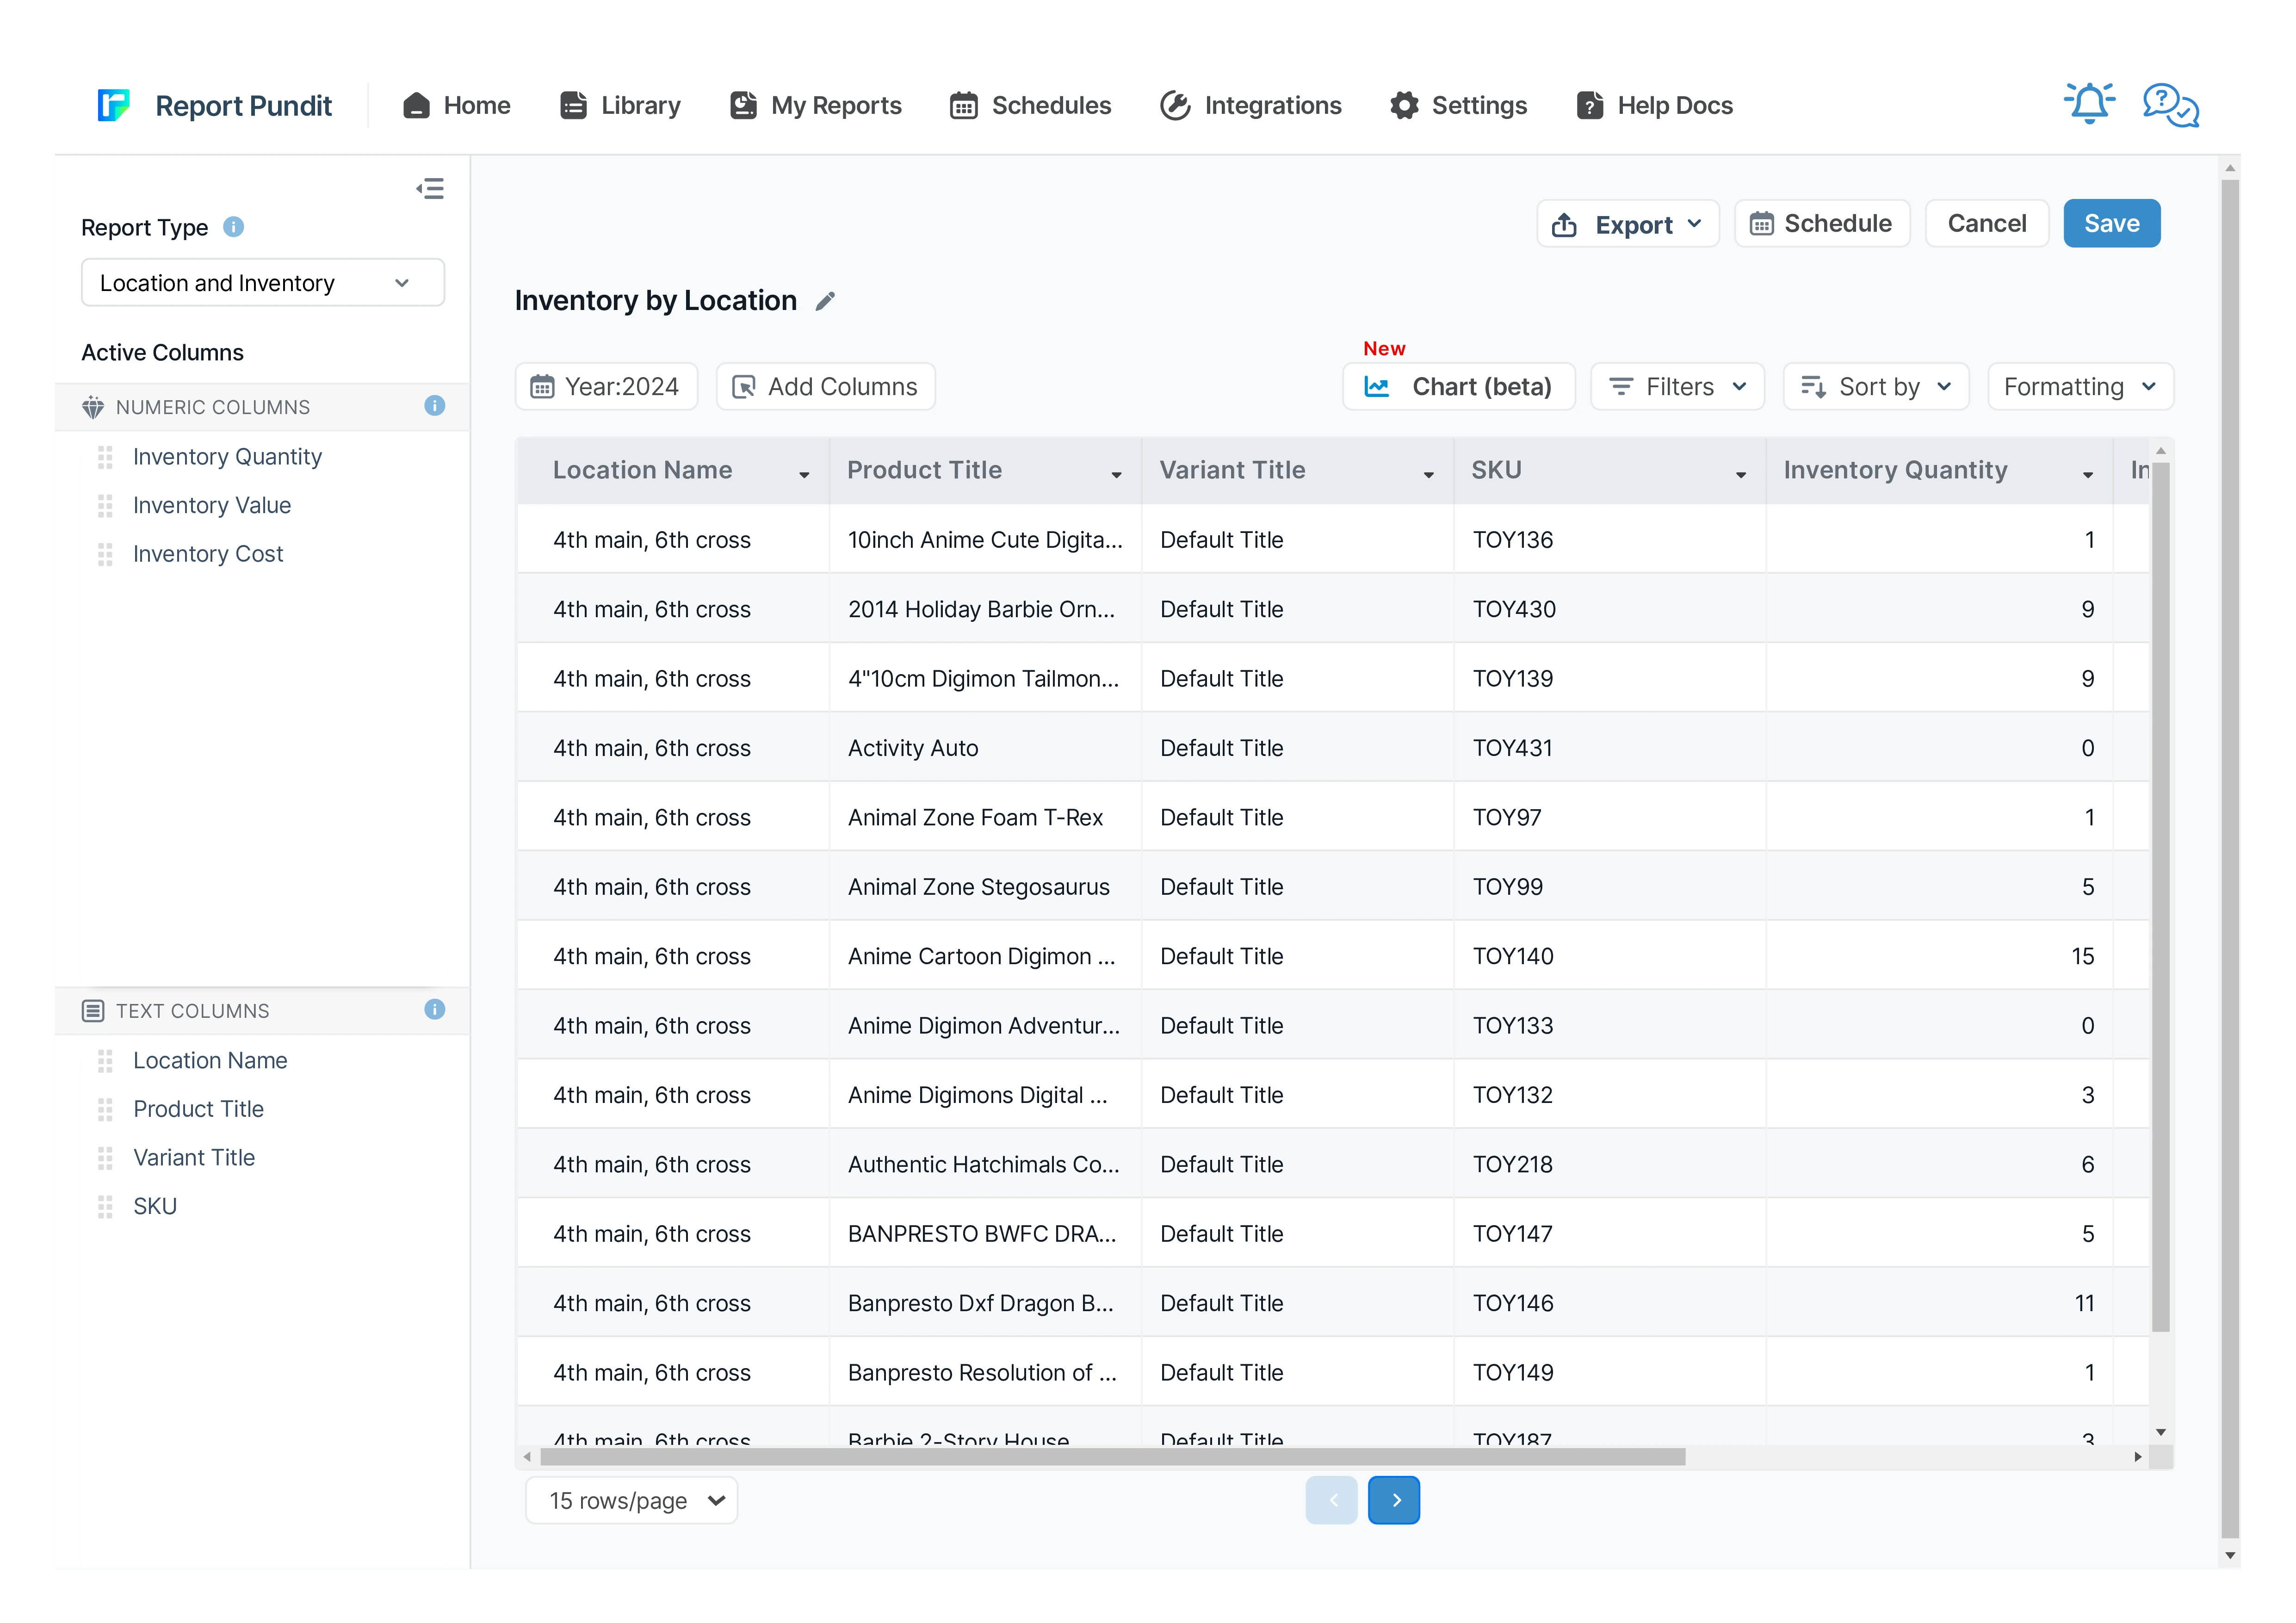
Inventory by Location Report for Shopify
A report organized by inventory locations, detailing products and variants on hand, with a breakdown of the value for each product.


5 from 1,800+ merchants
2,000+ data fields
Trusted by 40,000+ Shopify stores
Updated June 2026
.png)
.png)

.svg)
.svg)
.svg)
Why the Inventory by Location Report matters
If you sell through more than one physical location, your inventory is fragmented by definition. The same SKU might be plentiful at one warehouse, low at another, and out of stock at a third. Shopify's native reports either roll the locations together (losing the detail) or force you to filter one location at a time (losing the comparison).
The Inventory by Location Report pivots the view: each location becomes a column or grouping, every product becomes a row, and the data tells you instantly where stock imbalances exist. That visibility drives three high-impact decisions - fulfillment routing, stock transfers between locations, and per-location reorder triggers.
For a Shopify Plus merchant running flagship stores in three cities plus a warehouse plus a 3PL, this report is the operating system of the inventory function.
What's included in the report
Location dimension - Location - The name of each warehouse, retail location, or 3PL holding inventory.
Product identification - Product Title · Variant Title · SKU
Per-location values - Inventory Quantity - Live units at that location for that variant.
Inventory Value - Inventory Quantity × Product Price - retail-side value of stock at that location.
Vendor · Product Cost · Inventory Cost · Product Status · Collections · Sales by Location (paired with Sales by Fulfillment Location report) · Inventory Days Remaining
Who uses this report - 4 scenarios
1. Multi-location retailers planning stock transfers
2. 3PL-based DTC brands routing fulfillment
3. Wholesale/B2B teams confirming allocation
4. Operations leads spotting location-level out-of-stocks
How to read the Inventory by Location Report
• The same SKU across locations. Wide variance (50 at one, 0 at another) signals transfer opportunity.
• Total stock vs. location concentration. A SKU with 200 total units that all sit at one location creates fulfillment latency for customers elsewhere.
• Low + active location. If a high-traffic retail location runs Low or Out on a top seller, the lost sales clock is ticking.
• Idle inventory at remote locations. A 3PL location with high stock but no orders shipping from it - re-allocate or relocate.
How to build the report in Report Pundit
- Install Report Pundit from the Shopify App Store. 14-day free trial. No card required.
- Open Report Pundit from your Shopify admin and click Pre-built Reports.
- Select Inventory by Location Report from the Inventory category.
- Apply filters (location, vendor, collection, product tag, product type, status - whatever fits).
- Customize columns - add COGS, inventory days remaining, sales velocity, sell-through, or any of 2,000+ fields.
- Run the report. Results load in seconds for most stores.
Export or schedule - Google Sheets, Excel, CSV, PDF, or scheduled email delivery to your team.
Sample report
Customization & filters
• Filter by specific location(s) - focus on one or compare a subset
• Pivot to wide format - locations as columns, SKUs as rows - for transfer planning
• Add Sales Velocity by location - combine with Sales by Fulfillment Location data
• Group by Product Type or Vendor for category-level location views
• Add Reorder Point per location for location-aware replenishment
Automate & export
- Schedules — hourly, daily, weekly, monthly, or custom cron
- Delivery formats — Excel, CSV, PDF, or push to Google Sheets in real time
- Group by month or week — trends instead of a static snapshot
- Destinations — email (multiple recipients), Google Sheets, Google Drive, FTP/SFTP, Looker Studio, BigQuery
- Conditional alerts — get notified only if a channel's net sales drop more than X% week-over-week
Report Pundit vs Shopify's native Sales by Channel report
Frequently Asked Questions
A report that breaks your inventory down by every Shopify location - warehouses, retail stores, 3PLs - showing each product and variant's stock and value at each location side by side.
Yes. Filter to a specific location to focus, or remove the filter to see all locations side by side.
Yes - it's one of the most common use cases. Compare each retail location's stock for the same SKU and trigger transfers or per-store reorders.
Benefits

Inventory Levels

Product Variant Values
Inventory Balancing
Related Reports
Inventory Sale Value
A report outlining the sale value of your inventory, including details on product quantities, variants, collections, and total value based on current sale prices for analysis.
Inventory by Product Type
This is grouped inventory data organized by custom product types, alongside product and variant details, providing a comprehensive view to analyze overall inventory status.
Inventory level Indicator
The report provides Shopify merchants with a real-time analysis of stock levels, highlighting products that are overstocked, optimally stocked, or understocked. This report is essential for monitoring stock health and ensuring that inventory levels align with demand.
ABC Analysis
Every product graded A, B, or C by its share of revenue — so you can pour stock investment into the items that earn it, and stop over-buying the ones that don’t.
Inventory On Specific Day
A point-in-time snapshot of exactly what you had in stock on any past date — by product, variant, SKU, and location — for month-end accounting, audits, and cross-date comparison.
Inventory on Hand
A real-time snapshot of every product, variant, and SKU in stock - across every warehouse, retail location, and 3PL - with vendor, cost, and inventory value in a single view.
Inventory Status
A comprehensive overview of product inventory, detailing the quantity available for products that are live, in draft, or have been archived.
Inventory by Collections
This report provides a detailed view of inventory levels, organized by product collections, allowing businesses to track stock availability and manage inventory efficiently.
Inventory Replenishment
A ready-to-action list of exactly which products need reordering now — driven by real sell-through velocity, adjusted for stock already on its way, and broken down by location.
Inventory Cost
The Inventory Cost Report provides a comprehensive analysis of the costs associated with your inventory, giving you a clear view of the financial investment tied up in stock. This report calculates the cost of inventory on hand and can include both current and historical cost data
Low Stock Product
The Low Stock Product Report highlights products that are approaching or have reached a low stock threshold, helping Shopify merchants proactively manage restocking needs. This report is crucial for preventing stockouts on popular items and ensuring seamless sales without interruption
Inventory Reorder Point
This report helps identify the exact point at which inventory should be restocked to prevent any interruptions in product availability, ensuring a smooth supply chain from both your inventory and your vendor's end. It informs the merchant about the sales velocity, lead time, and safety stock.
Inventory Shipments
Every inbound shipment tracked end to end — shipped, received, accepted, and rejected quantities with acceptance rate — so you can catch discrepancies, plan around arrivals, and benchmark supplier reliability.
Out of Stock Product
A report listing products that are out of stock, including essential details such as product inventory and the location where the stock was depleted.

Build and automate your Shopify Reporting
Unlock the full potential of your Shopify store with Report Pundit. Gain access to over 2000 data fields, automate reports, and make data-backed decisions to grow your business.