Inventory Cost Report for Shopify
The Inventory Cost Report provides a comprehensive analysis of the costs associated with your inventory, giving you a clear view of the financial investment tied up in stock. This report calculates the cost of inventory on hand and can include both current and historical cost data


5 from 1,800+ merchants
2,000+ data fields
Trusted by 40,000+ Shopify stores
Updated June 2026
.png)
.png)

.svg)
.svg)
.svg)
Why the Inventory Cost Report matters
For most ecommerce businesses, inventory is the single largest balance-sheet asset. Yet many merchants don't have a clean answer to "how much capital do we have tied up in stock right now?" Shopify's native reports focus on units sold, not value held.
The Inventory Cost Report fills that gap with three financial truths: total capital locked in inventory at this moment, the per-product breakdown of where that capital sits, and (when paired with the Sale Value report) the unrealized gross profit waiting in your warehouse.
This is the report finance teams pull for monthly close, founders check before signing a big PO, and operators use to spot the high-cost slow-movers no one wants to talk about.
What's included in the report
Identification - Product Title · Variant Title · SKU
Product Price - Selling price for margin reference.
Inventory Cost - Product Cost × Inventory Quantity.
Inventory Value - Product Price × Inventory Quantity.
Vendor · Product Type · Inventory Quantity · Margin per unit · Total potential gross profit · Days of inventory remaining
Who uses this report - 4 scenarios
1. Finance teams running monthly close
2. Founders evaluating cash position
3. Buyers planning the next purchase order
4. Bankers and lenders prepping a financing conversation
How to read the Inventory Cost Report
• Inventory Cost vs. monthly revenue. A healthy DTC store typically holds 1-3× monthly revenue at cost. Higher signals capital trapped; lower signals understock risk.
• Cost concentration by vendor. If one supplier holds 40%+ of your inventory cost, you have concentration risk. Diversify or renegotiate terms.
• High-cost slow-movers. Sort by Inventory Cost descending, then check sales velocity. Anything in the top 20% with bottom-quartile velocity is a clearance candidate.
• Missing cost data. Any row with blank Inventory Cost means unit cost wasn't set in Shopify. Fix the source data - those products are invisible in your valuation.
How to build the report in Report Pundit
- Install Report Pundit from the Shopify App Store. 14-day free trial. No card required.
- Open Report Pundit from your Shopify admin and click Pre-built Reports.
- Select Inventory Cost Report from the Inventory category.
- Apply filters (location, vendor, collection, product tag, product type, status - whatever fits).
- Customize columns - add COGS, inventory days remaining, sales velocity, sell-through, or any of 2,000+ fields.
- Run the report. Results load in seconds for most stores.
Export or schedule - Google Sheets, Excel, CSV, PDF, or scheduled email delivery to your team.
Sample report
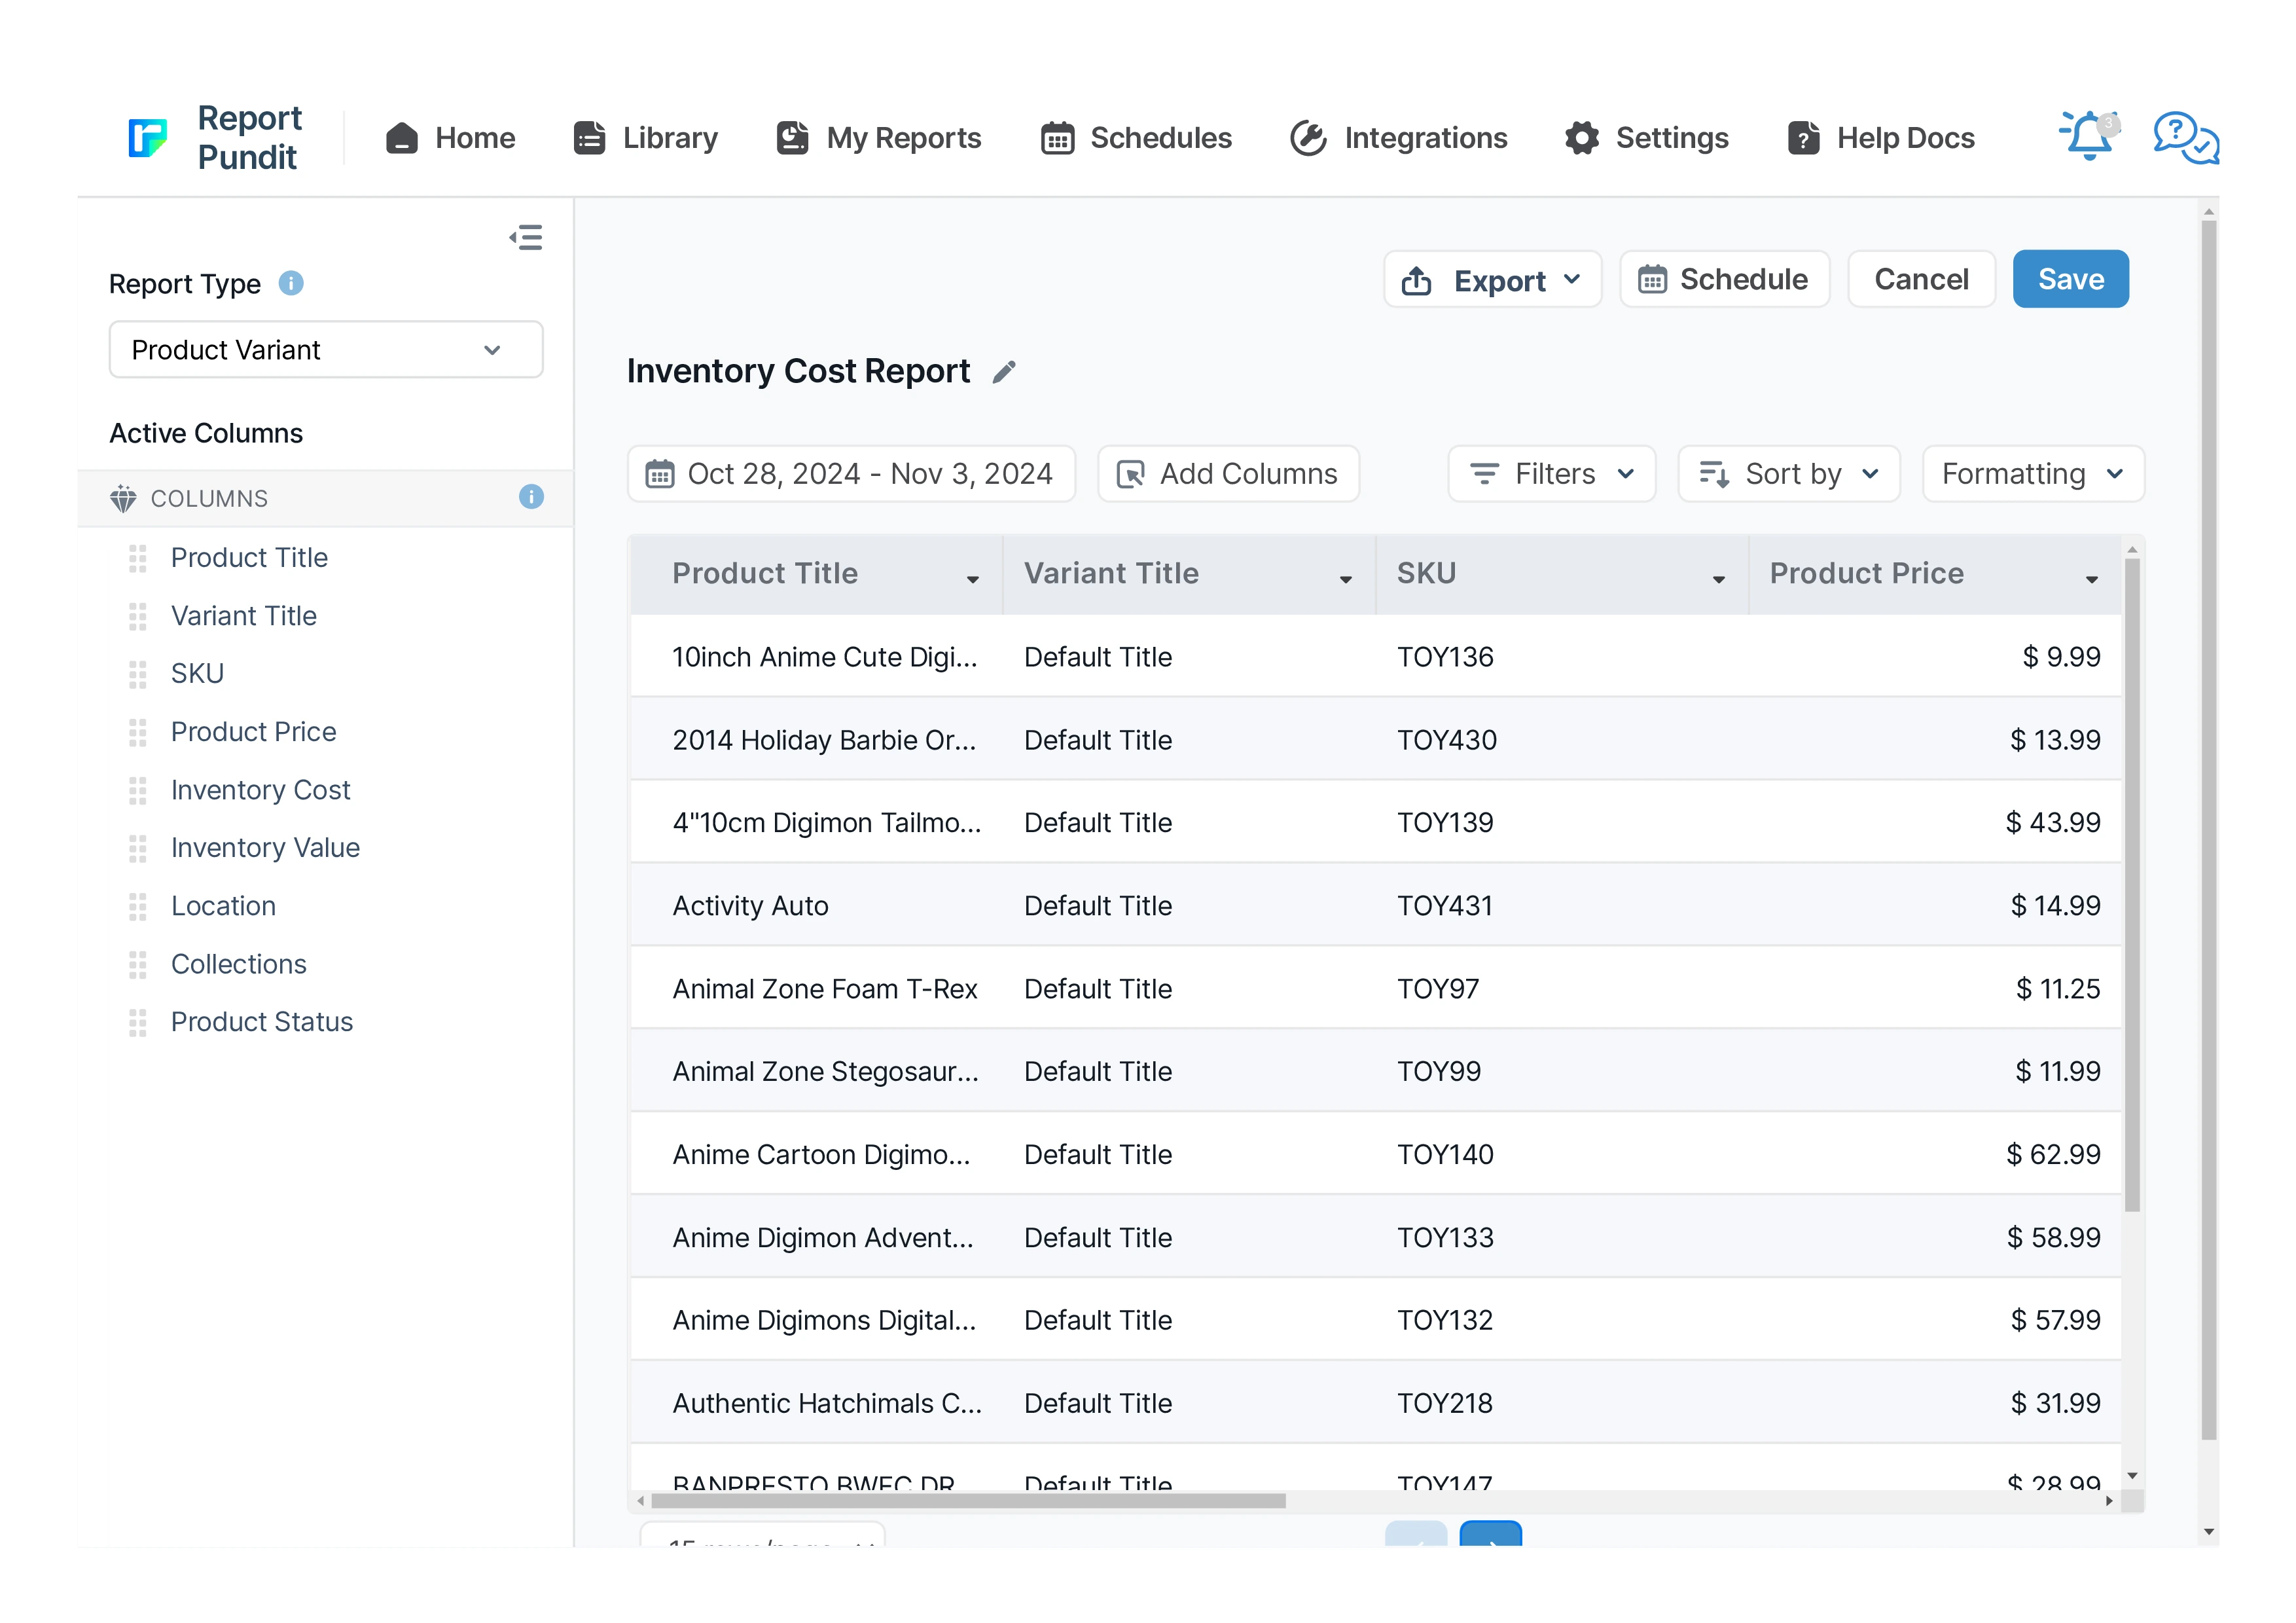
Customization & filters
• Filter by vendor - supplier-by-supplier cost view
• Filter by product type or collection - category cost breakdown
• Filter by location - see capital sitting at each warehouse
• Add Total Potential Gross Profit - Inventory Value − Inventory Cost
• Add Inventory Days Remaining - couple cost with how fast it's selling
• Group by Vendor for purchasing decisions
Automate & export
- Schedules — hourly, daily, weekly, monthly, or custom cron
- Delivery formats — Excel, CSV, PDF, or push to Google Sheets in real time
- Group by month or week — trends instead of a static snapshot
- Destinations — email (multiple recipients), Google Sheets, Google Drive, FTP/SFTP, Looker Studio, BigQuery
- Conditional alerts — get notified only if a channel's net sales drop more than X% week-over-week
Report Pundit vs Shopify's native Sales by Channel report
Frequently Asked Questions
A report showing the total cost value of your current inventory, calculated as Product Cost × Inventory Quantity for every variant. Used for balance-sheet valuation, cash management, and margin planning.
nventory Cost uses your unit cost. Inventory Sale Value uses the selling price. The gap between them is your potential gross profit.
Yes. The report multiplies Product Cost by Inventory Quantity. If unit cost isn't set on a product, that product's cost column will be blank.
Benefits

Evaluate Profit Margins
Cash Flow Planning
Product Cost Change
Related Reports
Inventory Sell-Through
The percentage of stock that actually sold for every product and variant so you can separate the fast-movers worth reordering from the dead stock eating your shelf space and cash.
Inventory Sale Value
A report outlining the sale value of your inventory, including details on product quantities, variants, collections, and total value based on current sale prices for analysis.
Inventory Replenishment
A ready-to-action list of exactly which products need reordering now — driven by real sell-through velocity, adjusted for stock already on its way, and broken down by location.
Inventory On Specific Day
A point-in-time snapshot of exactly what you had in stock on any past date — by product, variant, SKU, and location — for month-end accounting, audits, and cross-date comparison.
Inventory level Indicator
The report provides Shopify merchants with a real-time analysis of stock levels, highlighting products that are overstocked, optimally stocked, or understocked. This report is essential for monitoring stock health and ensuring that inventory levels align with demand.
Inventory by Location
A report organized by inventory locations, detailing products and variants on hand, with a breakdown of the value for each product.
Inventory Reorder Point
This report helps identify the exact point at which inventory should be restocked to prevent any interruptions in product availability, ensuring a smooth supply chain from both your inventory and your vendor's end. It informs the merchant about the sales velocity, lead time, and safety stock.
Inventory by Collections
This report provides a detailed view of inventory levels, organized by product collections, allowing businesses to track stock availability and manage inventory efficiently.
ABC Analysis
Every product graded A, B, or C by its share of revenue — so you can pour stock investment into the items that earn it, and stop over-buying the ones that don’t.
Out of Stock Product
A report listing products that are out of stock, including essential details such as product inventory and the location where the stock was depleted.
Low Stock Product
The Low Stock Product Report highlights products that are approaching or have reached a low stock threshold, helping Shopify merchants proactively manage restocking needs. This report is crucial for preventing stockouts on popular items and ensuring seamless sales without interruption
Inventory Shipments
Every inbound shipment tracked end to end — shipped, received, accepted, and rejected quantities with acceptance rate — so you can catch discrepancies, plan around arrivals, and benchmark supplier reliability.
Inventory Status
A comprehensive overview of product inventory, detailing the quantity available for products that are live, in draft, or have been archived.
Inventory on Hand
A real-time snapshot of every product, variant, and SKU in stock - across every warehouse, retail location, and 3PL - with vendor, cost, and inventory value in a single view.

Build and automate your
Shopify Reporting
Unlock the full potential of your Shopify store with Report Pundit.
Gain access to over 2000 data fields, automate reports, and make
data-backed decisions to grow your business.