
.png)
.png)

.svg)
.svg)
.svg)
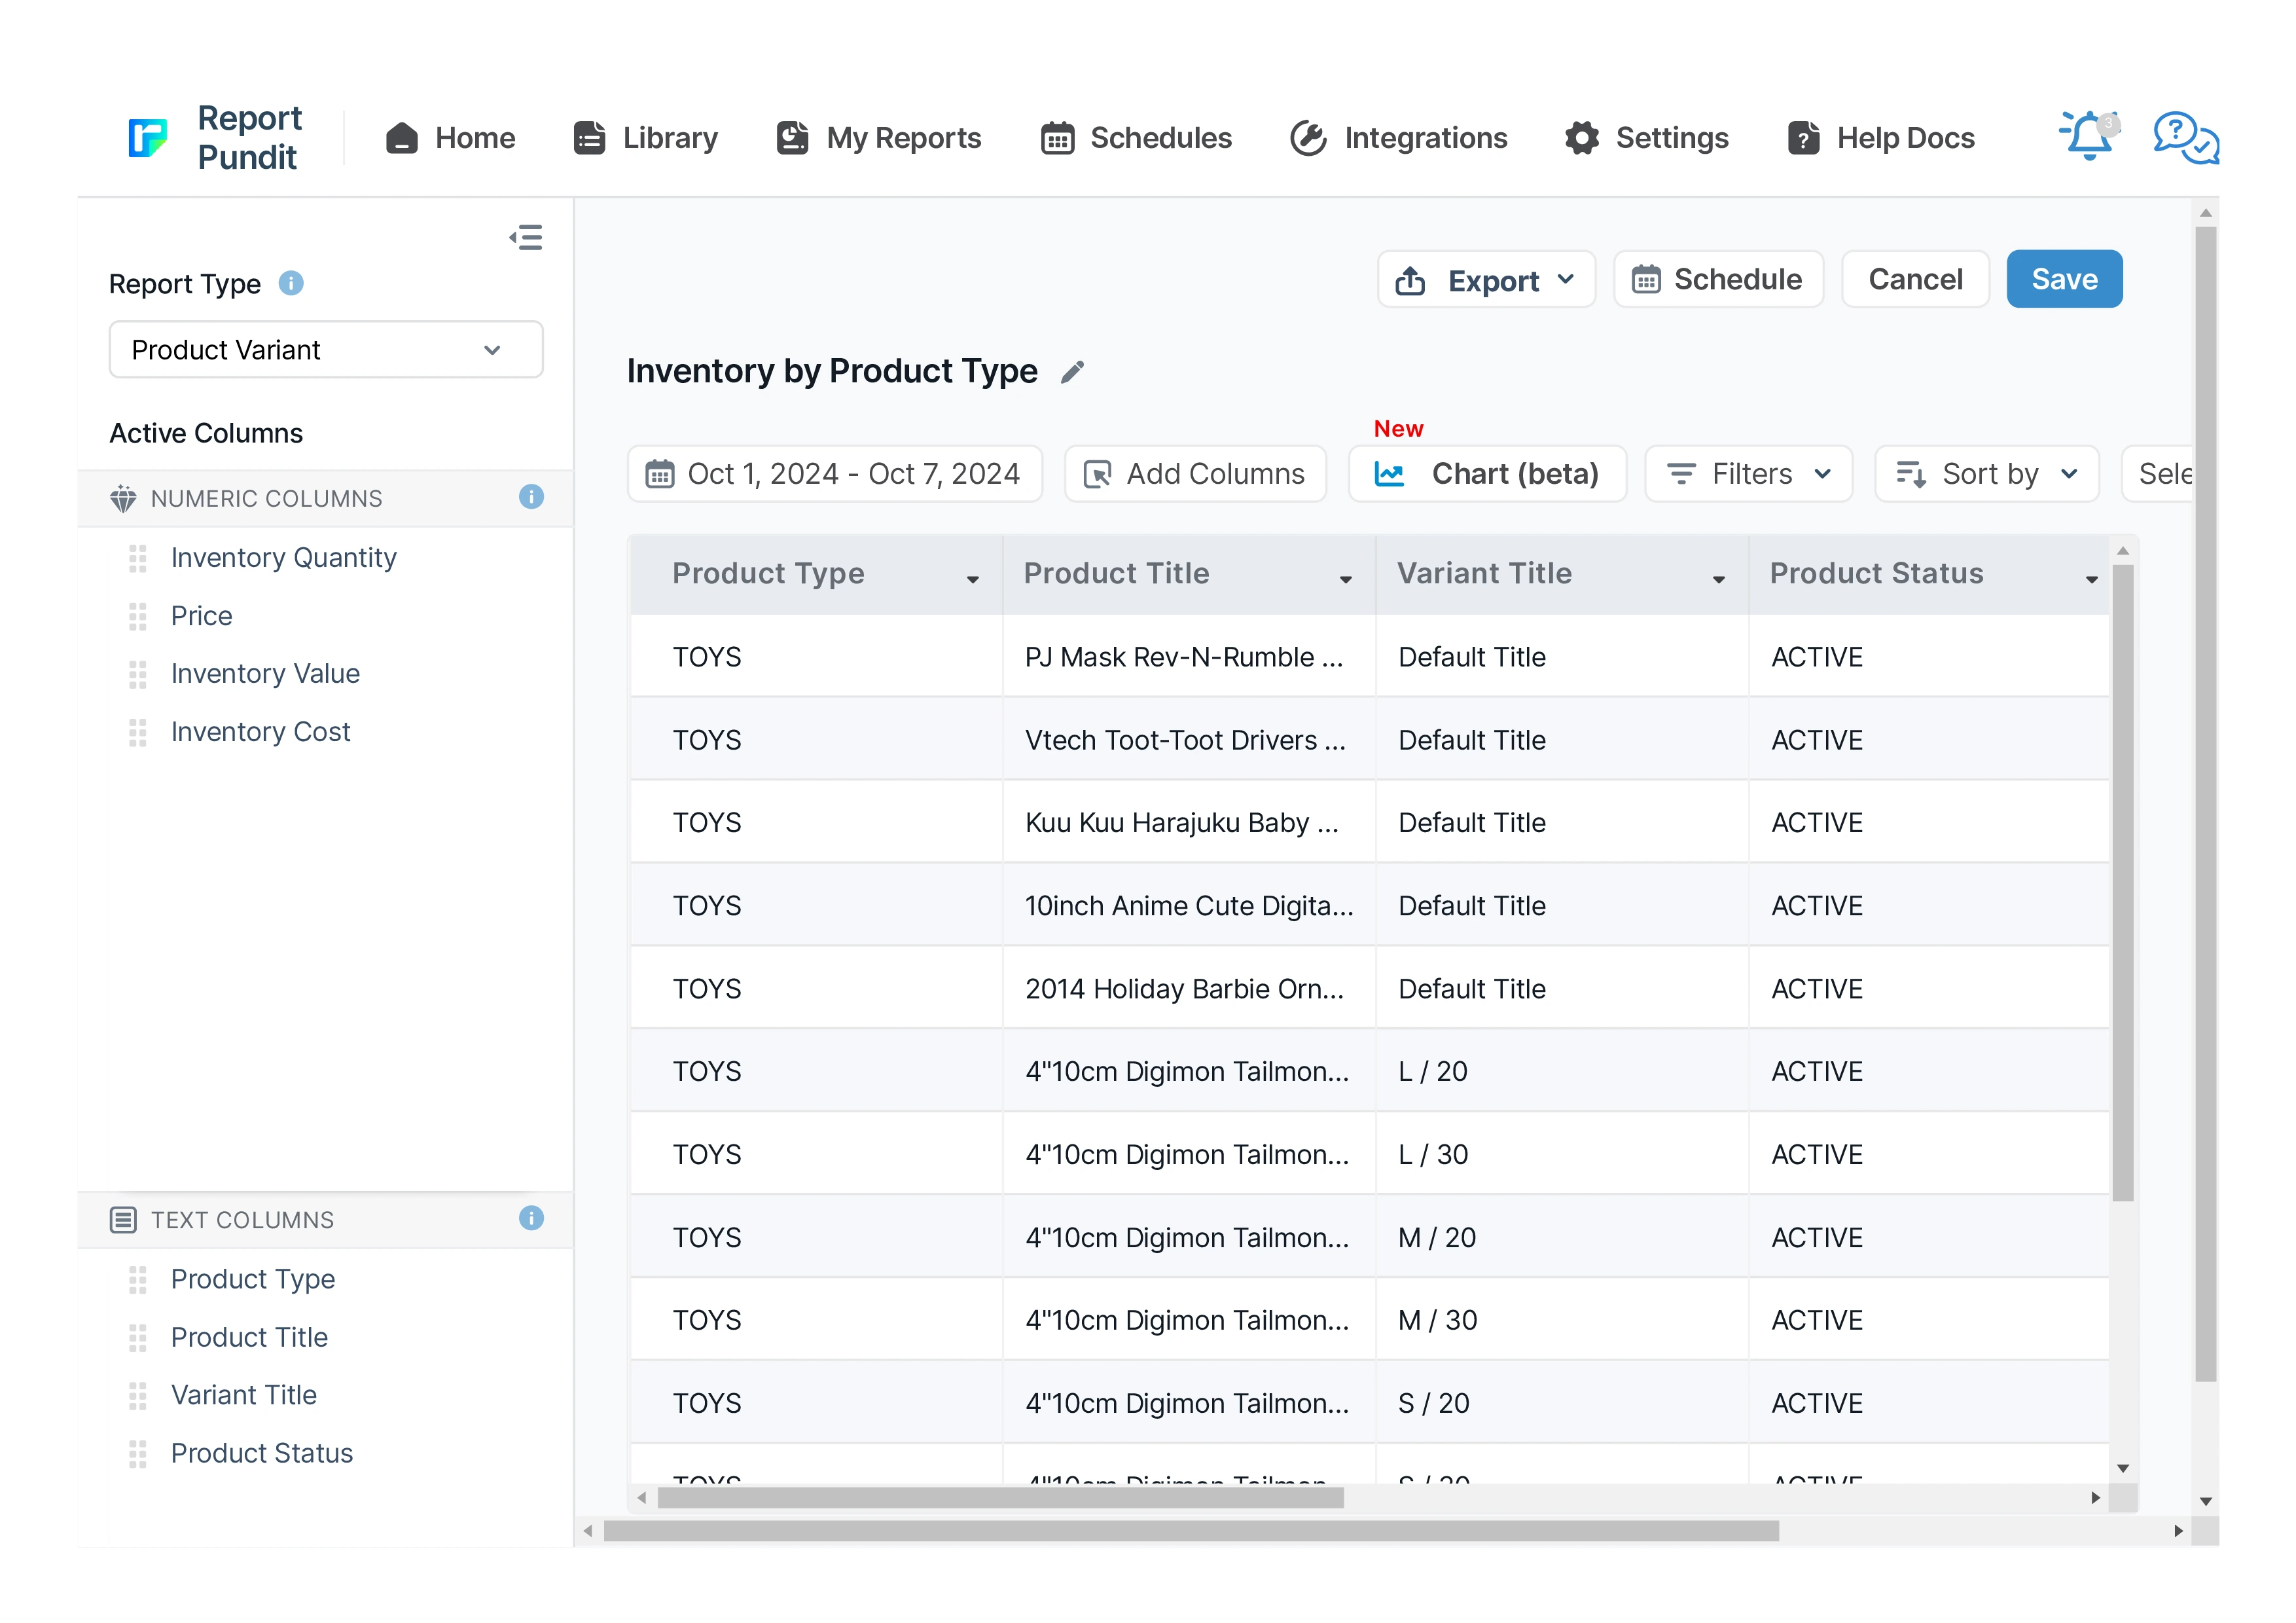

Product Type
Type of product you are selling; for example, pants, shirts, or shoes.
Product Title
Name of unsold product.
Variant Title
Name of product variant (Variant is a version of the product differing by attributes like color, size, aging, etc.).
Product Status
Determines if a product is available for your visitors to view in your store.
Inventory Quantity
The number of items in stock for the product category.
Price
The listing price of the product.
Inventory Value
Total value of the product inventory based on sale price i.e. Inventory * Product Price.
Inventory Cost
Total product cost for available units in inventory. Calculated as Product Cost * Inventory.

Benefits

View Product Availability
Product Grouping

Inventory Status Overview
Related Reports
Inventory Status
A comprehensive overview of product inventory, detailing the quantity available for products that are live, in draft, or have been archived.
Out Of Stock Report (daily)
An Out of Stock Report in Report Pundit typically provides insights into the availability of products in your inventory.
Inventory on Hand
The Inventory on Hand Report provides a snapshot of the current stock levels for all products, giving you a clear view of your available inventory at any given time.
Inventory Reorder Point
This report helps identify the exact point at which inventory should be restocked to prevent any interruptions in product availability, ensuring a smooth supply chain from both your inventory and your vendor's end. It informs the merchant about the sales velocity, lead time, and safety stock.
Inventory by Collections
This report provides a detailed view of inventory levels, organized by product collections, allowing businesses to track stock availability and manage inventory efficiently.
Low Stock Product
The Low Stock Product Report highlights products that are approaching or have reached a low stock threshold, helping Shopify merchants proactively manage restocking needs. This report is crucial for preventing stockouts on popular items and ensuring seamless sales without interruption
Inventory Cost
The Inventory Cost Report provides a comprehensive analysis of the costs associated with your inventory, giving you a clear view of the financial investment tied up in stock. This report calculates the cost of inventory on hand and can include both current and historical cost data
Inventory by Location
A report organized by inventory locations, detailing products and variants on hand, with a breakdown of the value for each product.
Inventory level Indicator
The report provides Shopify merchants with a real-time analysis of stock levels, highlighting products that are overstocked, optimally stocked, or understocked. This report is essential for monitoring stock health and ensuring that inventory levels align with demand.

Build and automate your Shopify Reporting
Unlock the full potential of your Shopify store with Report Pundit. Gain access to over 2000 data fields, automate reports, and make data-backed decisions to grow your business.