Shopify Inventory Reports: A Complete Guide to Tracking and Managing Stock

.svg)
.svg)
.svg)
You are not noticing, but what if your inventory is wrong, your products might not sell, and your suppliers might not give you the correct inventory report? And this simply means you are losing your sales with money.
Keeping your inventory in check is crucial for any business to run smoothly. Shopify gives you some built-in reports to track your stock and see what’s selling and what’s not.
But what if the information isn’t up to date? What if you don’t know what’s going on right now?
What is a Shopify Inventory Report?
An inventory report is a kind of report that shows products that are available in your warehouse right now. It includes the number of products in stock, their value, where they are (inventory location), and what is coming in or going out. It also shows what needs to be restocked.
This helps your business keep the right amount of products, so you don’t restock too much to run out of stock.
So, let's explore the different types of inventory reports offered by Shopify.
Types of Shopify Inventory Reports to Help You Monitor Stock Performance
Shopify gives many useful built-in reports that help you monitor inventory and product performance.
Month-End Snapshot Report:
The Month-End Snapshot report gives a summary of inventory and product data at the end of each month for a high-level view of stock trends. It gives the ending inventory and beginning inventory data for the selected month.
Product by Sell-Through Rate Report:
The Product Sell-Through Rate report shows the percentage of each product variant's inventory sold during a selected time period. It calculates the sell-through rate as total items sold divided by the sum of items sold plus items still in inventory. The report excludes negative inventory quantities and only includes variants sold at least once during the period.
This report helps you understand how quickly your inventory is selling to manage stock effectively.
ABC Analysis Report:
ABC analysis is a way to group your products by how much money they make.
A items
Bring in about 80% of your sales
Need the most care for stock and promotion
B items
Give about 15% of sales
Can move up to A or down to C
Keep an eye on them
C items
Make only 5% of sales
Often sells slowly
You may think about putting them on sale or removing them
This is called the 80/20 rule, and most of your results come from a small number of products. You can use this method to focus on the right items, grow profit, and save costs.
Inventory Sold Daily by Report:
The Inventory Sold Daily report displays the average number of units sold per day for each product variant during a selected time period. It calculates this by dividing the total quantity sold by the number of days in the period. The report excludes negative inventory quantities and only includes variants sold at least once during the period. This metric helps you understand daily sales velocity to optimize inventory management.
Product by Days of Inventory Remaining:
The Days of Inventory Remaining report estimates how long your tracked inventory will last based on average daily sales for each product variant. It calculates this by dividing how many items are left in stock by the average number sold per day during the chosen time. Variants with no sales data show N/A, and negative inventory values are set to 0 days. This report helps you predict when to reorder stock to avoid running out.
Inventory Adjustment Changes:
The Inventory Adjustment Changes report shows all inventory adjustments made during a selected time period, including manual changes, app adjustments, transfers, and order fulfillments. It helps track how inventory levels change and identify discrepancies or patterns.
This report provides detailed insights into inventory state changes for better inventory management.
For example, when a new order for 3 units of a SKU is placed, the report records a decrease of 3 units in the Available inventory and an increase of 3 units in the Committed inventory. Tracking these metric changes helps you understand how inventory moves between different states (Available, Committed, Unavailable) and manage stock levels more accurately.
Inventory Adjustment by count:
The Inventory Adjustment by Count report tracks the number of times inventory adjustments are made within a selected period. It helps you understand the frequency of inventory changes, such as stock corrections or transfers.
This report can be filtered by product, location, or adjustment reason to identify patterns. Monitoring adjustment counts aids in improving inventory accuracy and operational efficiency.
Month-end Inventory Value:
The Month-end inventory value report shows the total value of your available inventory based on the cost per item for each product variant. It excludes committed inventory for pending orders and incoming units from transfers. The report includes product variants adjusted or ordered in the last three years. It helps you understand the monetary value of your stock at the end of each month.
Also, the report is necessary for financial reconciliation between Shopify and your accounting, which makes it valuable for your accounting team.
Products by Percentage Sold:
The Products by percentage sold report shows the percentage of each product variant's inventory sold during a selected period, based on the total starting inventory quantity. It only includes variants sold at least once before or during the period. Values can exceed 100% or be below 0% due to overselling or negative starting quantities. This report helps you understand sales performance relative to inventory levels.
Example: If you have 5 products with 10 units each and you sell 3 units each from 2 products, the report shows the percentage of inventory sold for those products.
How to Create Shopify Inventory Reports
There are two ways to create Shopify Inventory Reports:
- Using pre-made reports
- Creating from scratch
Let's see the first one by using pre-made reports
- Go to Analytics > Reports in your Shopify admin
- Click the Category filter
- Select Inventory, customize your selected report
- Congrats, you are ready to save your Inventory report for later access!
Or, by creating from scratch
- Go to Analytics > Reports in your Shopify admin.
- Select the type of Inventory report you want.
- Click New Exploration.
- Customize the report by adding or removing fields, then save it.
Shopify Inventory reporting lacks a few important insights that many of you rely on:
- Current Inventory Report: Shopify does not currently offer a specific report that displays current inventory levels. Merchants can only find this information by manually navigating to the Products section and checking stock counts there.
- Total Inventory Value Report: Shopify doesn't calculate or report the current inventory value. It works with the ending inventory value at the end of a month, which may not reflect real-time insights needed for financial planning or cost analysis.
- Custom Inventory Dashboards: Create easy-to-see pages that display your stock levels, restocking dates, and value changes.
[Note: To find the total inventory value on Shopify, you have to depend on the ending inventory values from the month-end reports. Real-time inventory valuation is not natively supported, but it is available in the Products section. So, if you need to, you have to add it manually.]
Since Shopify doesn’t include these three reports by default, you’ll need a reporting app to get them.
What You Get from Report Pundit’s Inventory Reporting
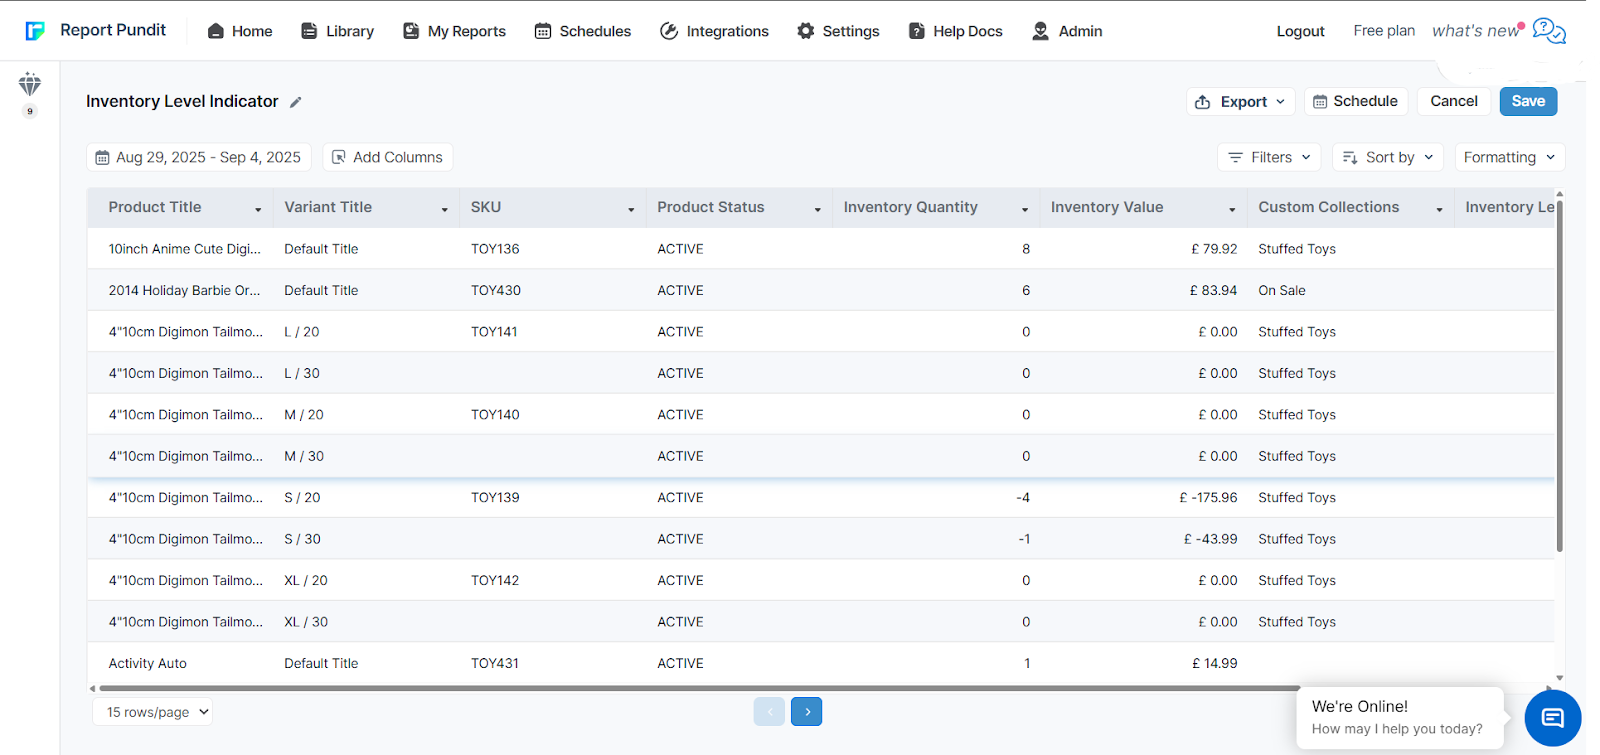
1. Shopify Inventory Level Indicators
If you’re well-prepared for the holidays and peak seasons, your Shopify store can generate a lot of sales in a short time.
With Report Pundit, you just have to pick each product and enter the quantity you think is reasonable to avoid running out of stock. We’ll send you a notification when the inventory of a particular product goes below the quantity you’ve set.
And this is not just for low stock levels. You can also set a maximum quantity and stay updated about products that are just sitting on the shelf.
These two indicators, Low Stock Level and High Stock Level, will let you know which products you need to restock quickly and which ones you can go without ordering for a while. For more information on Inventory Level Indicators, check out our guide: Shopify Inventory Level Indicator Report.
2. Shopify Out of Stock Report
Even when sales slow down in different seasons, your products should still be selling. If some items don’t sell at all, it may be time to remove them. The Out of Stock Report shows which products haven’t sold in the last three months. It helps you clear out old stock, save space, and focus on items customers actually want.
3. Shopify Inventory Cost Report
Knowing what inventory you have isn’t enough- you also need to understand how much it’s worth. The Shopify Inventory Cost Report calculates the current financial value of your stock and helps you analyze profitability.
4. Shopify Inventory on Hand Report
This report lets you see exactly what’s available in your store at any given moment. It simplifies current stock monitoring, helping you stay organised with inventory across all products, thanks to scheduled reports that remove the need for manual checks. With this report, you have all the information you need to keep your store’s inventory accurate and up to date with minimal effort.
5. Shopify Low Stock Product Report
Running out of stock on popular items can lead to missed sales and unhappy customers. This report highlights products nearing depletion so you can reorder before it’s too late. Stay ahead with timely restocks and avoid stockouts during high-demand periods.
6. Shopify Inventory Sale Value Report
This report shows the value of inventory that has been sold, helping you track product performance.
7. Shopify Inventory by Location
This report displays the inventories based on each location or warehouse, useful for managing stock across multiple sites.
8. Shopify Inventory by Product Type
This report organizes your inventory by product type, which makes it easier to view and manage similar items.
For example, if you're selling electronic items, you can quickly see stock levels for all electronic products that are grouped, which helps you stay organized and track your inventory.
9. Shopify Inventory Re-Order Point
This report helps you know when to reorder a product based on how often it sells. It gives the average inventory level and a specific date for reordering instead of just a number.
10. Shopify Inventory Status
This report shows whether inventory is “In Stock” or “Out of Stock”. It also shows product status such as active, draft, or archived.
Note: If your inventory is 0 or less, the product will show as “Out of Stock.” Or else, it will show as “In Stock.
11. Shopify Inventory by Collections
This report provides inventory data based on product collections, such as material or other groupings. It helps you easily track your stock levels and groups your inventory by product collections and their variants, so you can quickly see how much of each type of product is available.
How to Create Custom Inventory Reports in Report Pundit
Step 1: Install Report Pundit
Open the Shopify App Store and add the Report Pundit app.
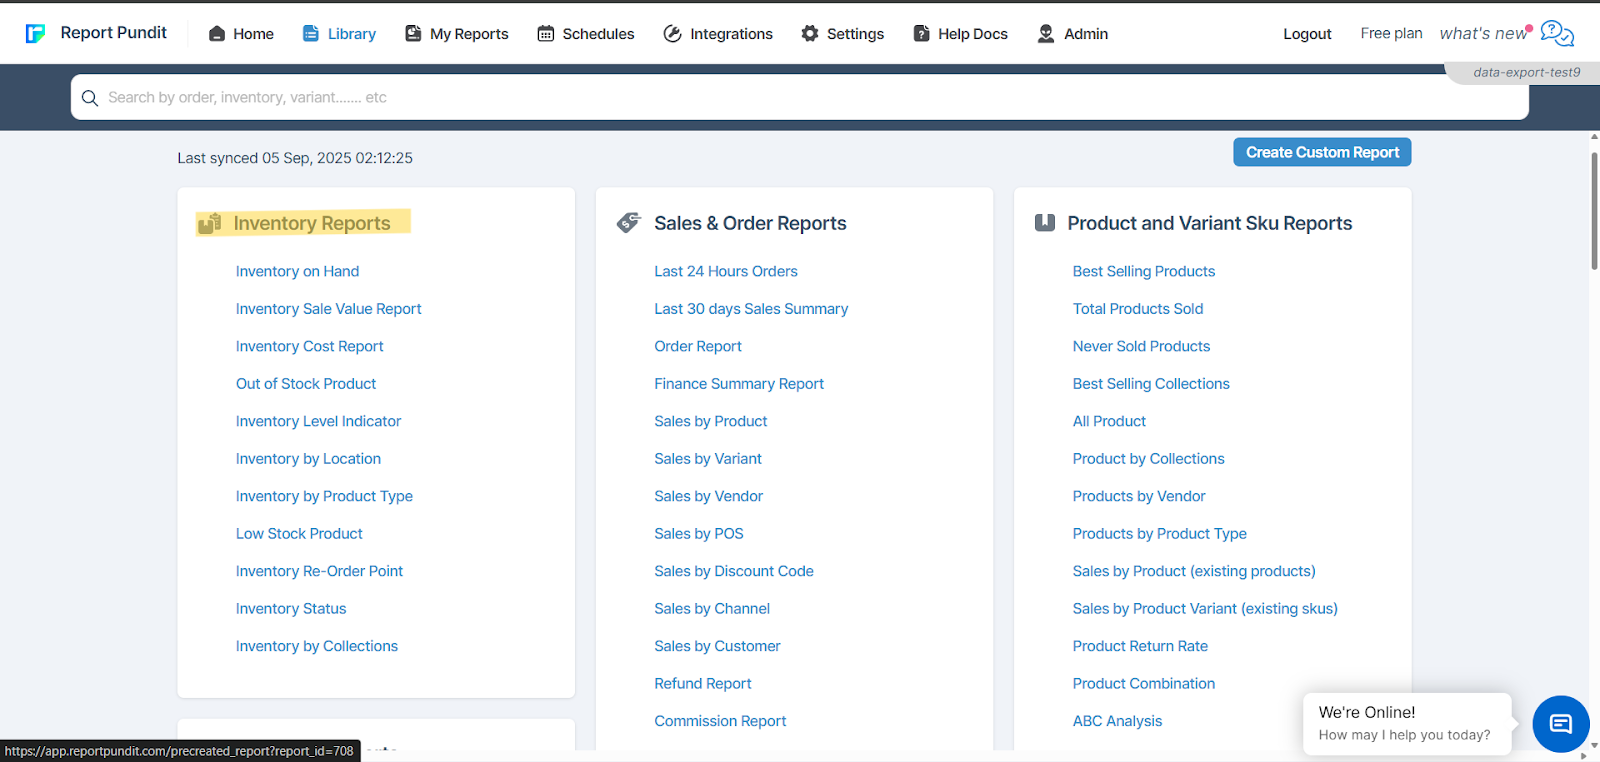
Step 2: Go to the Report Library
In Report Pundit, go to the Report Library section.
Step 3: Pick an Inventory Report
Under Inventory Reports, you can choose a ready-made report that matches what you need.
Step 4. Customize the Report
Add or remove fields, apply filters, or adjust columns to match your requirements.
If you need help, use the live chat support team for assistance.
Step 5. Save the Report
Save your customized report for future use.
You can also export it to Excel, Google Sheets, Slack, or schedule it to run automatically.
Automate Shopify Inventory Reports and Never Run Out of Stock
With Report Pundit, you can automate your Shopify inventory reports. It allows you to share and send reports easily to integrated tools. Use simple charts and visuals to quickly understand what is selling, what is not, and what needs to be restocked, and make sure you never run out of stock.
You can set reports to run daily, weekly, or monthly and get alerts through Email, FTP, Drive, Sheet, Power BI, and BigQuery. You can export, schedule, and automate reports directly in Slack so your whole team can see the data right away and save time. Everything runs in the background, so you can focus on growing your store without worrying about inventory.
Conclusion
Shopify’s inventory reports are fine for the basic needs, but they only refresh once a day. That means you never really see what’s happening with your stock right now, and planning or reordering can be confusing.
Report Pundit gives you current inventory tracking along with reorder points, low stock alerts, dead stock reports, and clear stock level indicators. You can also set up reports to run on a schedule and get alerts straight to your email or Slack so you’re always chill.
If you want current data and reports that actually work the way you manage your store, Report Pundit is an amazing way to start for your inventory.


.webp)
.webp)


Build and automate your Shopify Reporting
Unlock the full potential of your Shopify store with Report Pundit. Gain access to over 2000 data fields, automate reports, and make data-backed decisions to grow your business.