
.svg)
.svg)
.svg)
Shopify Inventory Level Indicator Report
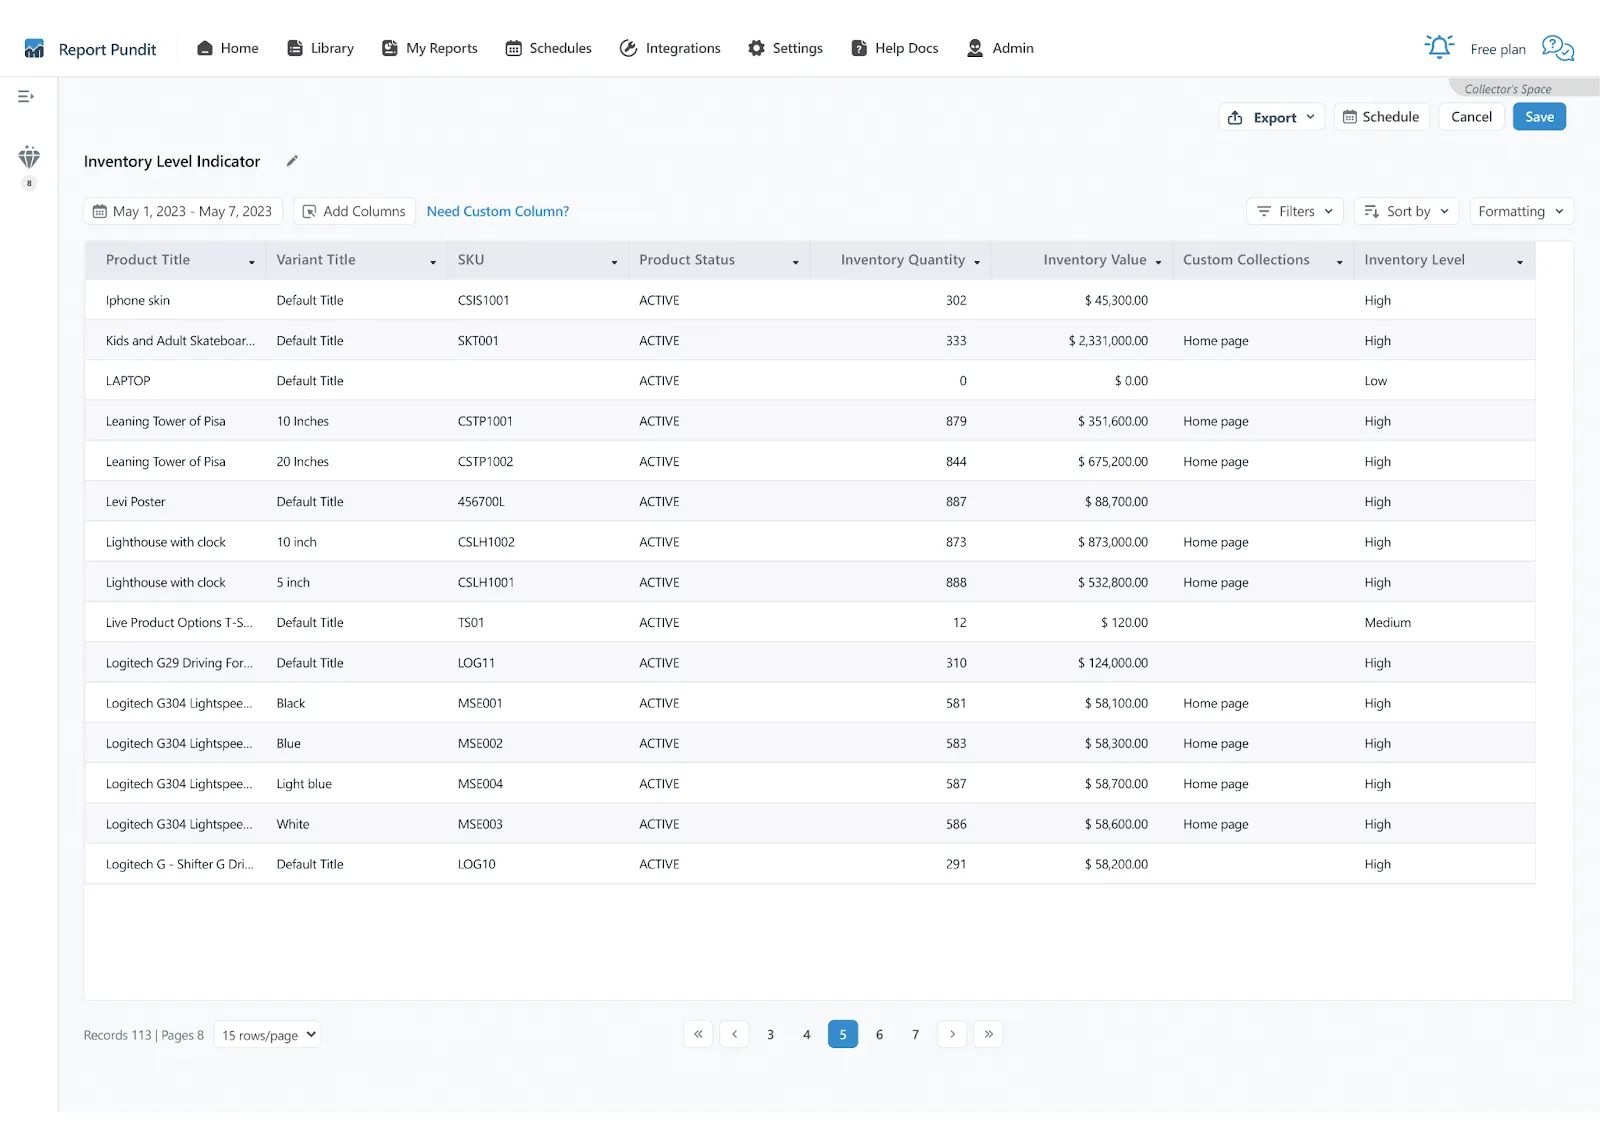
The Inventory Level Indicator report holds the data you need to make inventory replenishment decisions.
This Shopify report enables you to determine whether stocks are sufficient for your needs or not based on the product category. The indicated level varies depending on what’s being sold.
For example:
- A fast-moving product will have its quantity level shown as Low, even if it has the same stock quantity as a slower-moving product.
- A slow-moving product may be shown as High with the same quantity because it sells less frequently.
There are three indicator levels:
- Low
- Medium
- High
You can customize this report the way you want since every product category and products within a category can move at different rates. The customization options are detailed in the following sections.
Understanding the Inventory Level Indicator Report
The default query used to generate the inventory level indicator column is as follows:

WHEN [Inventory Quantity] > 20 THEN 'High'
WHEN [Inventory Quantity] < 10 THEN 'Low'
ELSE 'Medium'
As mentioned, you need not stick to the default query. You can modify the values as per your store’s requirement or we can customize them from our end as per your specifications.
Common Fields Used in Inventory Level Indicator Reports
Here’s the list of the most commonly presented data fields in this report:
- Product Title - Name of the product.
- Variant Title - Product variant name.
- SKU - Unique identifier for the product in the store.
- Product Status - Determines if a product is available for visitors to view in your online store.
- Inventory Quantity - The number of items in stock for the product category.
- Inventory Value - Total value of the inventory. It’s calculated by multiplying the inventory quantity by the product's price.
- Custom Collection - Collection name under which the product is categorized
- Inventory Level - Inventory level indicator
- Inventory Cost- Costs involve the expenses associated with purchasing, storing, and managing inventory.
You can add custom data field columns to personalize your report.
Why Your Store Needs This Shopify Inventory Report
Now that we know the default data fields used in this report and how it helps your eCommerce business, let us discuss the insights this report provides and how to use them in daily business operations.
The Report Designer of Inventory Level Indicator Report
We categorize our product data into low, medium, and high levels. In the above section, we went through the multiple filter options available for all our reports that let you filter products based on the stock you have assigned for each level.
What you’re likely to miss while making that decision as confirmed by our customers via feedback is that different products sell at different rates. Relying solely on product quantity data could lead to:
- False assumptions about whether a product is actually low in stock.
- Overestimating how long inventory will last.
- Unexpected stockouts despite seemingly “healthy” quantities.
With this Shopify Inventory report, you won’t have to struggle with these problems. Instead, you can:
- Avoid low stock, overstocking, and out-of-stock situations.
- Prevent loss of sales and potential brand reputation harm from inventory mismanagement.
- Regularly check your inventory stock levels even if quantities seem high.
If you notice that a certain product has remained unsold or maintained high-level stock for an extended time:
- Consider liquidating excess stock.
- Keep the product’s status active in your store.
- Use sales data in your reports to decide when and how much to reorder.
Since the quantity of a product is neither too high nor too low, medium-level stock can be regarded as a safe zone.
However, the most important data is the low-level stock in your inventory, as it can affect your business in several ways:
- Loss of sales
- Customer frustration
- Risk of damaging your brand reputation
How to Leverage This Report to Prevent Low-Stock Situations
Here’s how to leverage this report:
- Filter the report to show products with low levels of stock.
- Schedule the report to arrive in your mailbox at your convenience hourly, daily, or weekly.
That’s it! Problem solved. Now, you get updates on products with low stock levels via email, giving you focused store inventory insights when you need to improve inventory management.
The scheduler in Report Pundit ensures that:
- Blank reports are never delivered.
- Emails are sent only when products hit low-stock levels.
- Stock levels are displayed after deducting pending quantity orders.
Note: Based on live data, the displayed levels only indicate current inventory conditions.
Case Study: Real-Life Impact of Custom Reports
Consider one merchant’s experience:
“Managing inventory used to feel like a guessing game. We’d run out of popular products unexpectedly, frustrating customers and losing sales. With custom reports, we can now track inventory trends, set low-stock alerts, and quickly generate detailed reports tailored to our needs. What once took hours of manual work is now done in minutes. It’s given us peace of mind and confidence that we’ll always have the right products in stock.”
This is the power of custom reporting, transforming scattered inventory data into clear, actionable insights that drive confident decisions.
Want to explore more advanced inventory reporting? Check out:

Frequently Asked Questions (FAQs)
1. Is it possible to find out which region or state has the highest and lowest sales billing?
Yes! Custom reports allow you to analyze sales performance by region or state, helping you identify where your business is thriving and where improvements might be needed.
2. Is it possible to see the top products purchased from each location based on sales?
Absolutely. With custom reporting tools, you can discover which products are most popular in each region, helping you tailor marketing and inventory strategies accordingly.
3. Can I get a sales report by region or state?
Yes. Report Pundit enables you to generate detailed sales reports by state or region, offering insights that go far beyond Shopify’s default reporting capabilities.
Reviewed on

1.8 K Reviews


Build and automate your
Shopify Reporting
Unlock the full potential of your Shopify store with Report Pundit.
Gain access to over 2000 data fields, automate reports, and make
data-backed decisions to grow your business.