Shopify (POS) Point of Sale Reports


.svg)
.svg)
.svg)
eCommerce has transformed customer buying habits forever, with 2023 witnessing a staggering US$5.8 Trillion in sales worldwide. Does it mean the end of the road for brick and mortar stores?
Hardly, because physical stores compliment online sales. Retailers saw a jump of 37% in website traffic within 3 months after opening their physical store, meaning Point-of-Sale (POS) retail is a large contributor to eCommerce.
But that’s only true if managed right. Fortunately, you can track physical store metrics/key performance indicators (KPIs), just like with online stores. Then take that data and analyze it for valuable insights into your POS setup like how well a particular store is doing, is the inventory management working out for POS operations, what local customers want, etc.
Why Shopify POS Reports Matter for Your Business
For merchants running brick and mortar stores alongside online sales, Shopify Point of Sale (POS) captures a wealth of information: transactions, staff activity, product performance, and customer behavior at the counter. The challenge is turning that raw data into clear insights you can use to improve margins, staffing, and inventory decisions.
Shopify provides default Retail Sales reports that cover the basics. But when you need deeper visibility, like combining product and staff data, filtering by location, or scheduling automated end of day summaries, standard reports can feel limiting. That’s where Report Pundit helps, transforming POS data into custom Shopify POS reports you can build in minutes and schedule automatically.
This guide explains what POS analysis is, why it matters, which reports to use, and how to go beyond default reporting with flexible, field rich POS reports.
What Is POS Analysis?
POS analysis is the process of collecting, organizing, and interpreting data from your in-store transactions. Done well, it answers questions like:
- Which products are selling fastest by location or time of day
- Which staff members drive the most revenue and average order value
- How discounts and returns impact profitability at the register
- Whether inventory levels support demand patterns on the shop floor
The volume of POS data grows quickly as you add locations, products, and foot traffic. Turning that data into decisions keeps operations efficient and profits healthy.
Why Perform POS Analysis?
Losing track of key POS metrics leads to costly blind spots—overstocking slow movers, under-staffing peak hours, or missing shrink trends. Good analysis provides:
- Performance clarity by location. Products behave differently neighborhood to neighborhood.
- Cost awareness. In-store overheads like utilities and licenses affect margins.
- Customer alignment. Local preferences change, and your assortment should reflect that.
- Operational insight. Refund and pickup behavior across POS and online orders needs tight coordination.
Common actions that follow strong POS analysis include retraining staff, adjusting local assortments, refining pricing and promotions, and shifting labor to match peak periods.
Why Report Pundit Is Key to Your POS Analysis
Different POS formats—pop-ups, kiosks, and traditional counters—produce different data needs. Report Pundit converts your Shopify POS data into clear tables and graphs, so you can see what’s happening and why. You can track:
- POS transactions and sales across single or multiple locations
- Staff performance down to the transaction level
- Product and variant trends with the attributes you care about
- Profitability by location when you include cost fields
Because the reports are customizable, you choose the exact fields and filters. And with scheduling, they arrive automatically when your team needs them.
Core POS Reports in Report Pundit
Use these report types as your starting point, then customize as needed.
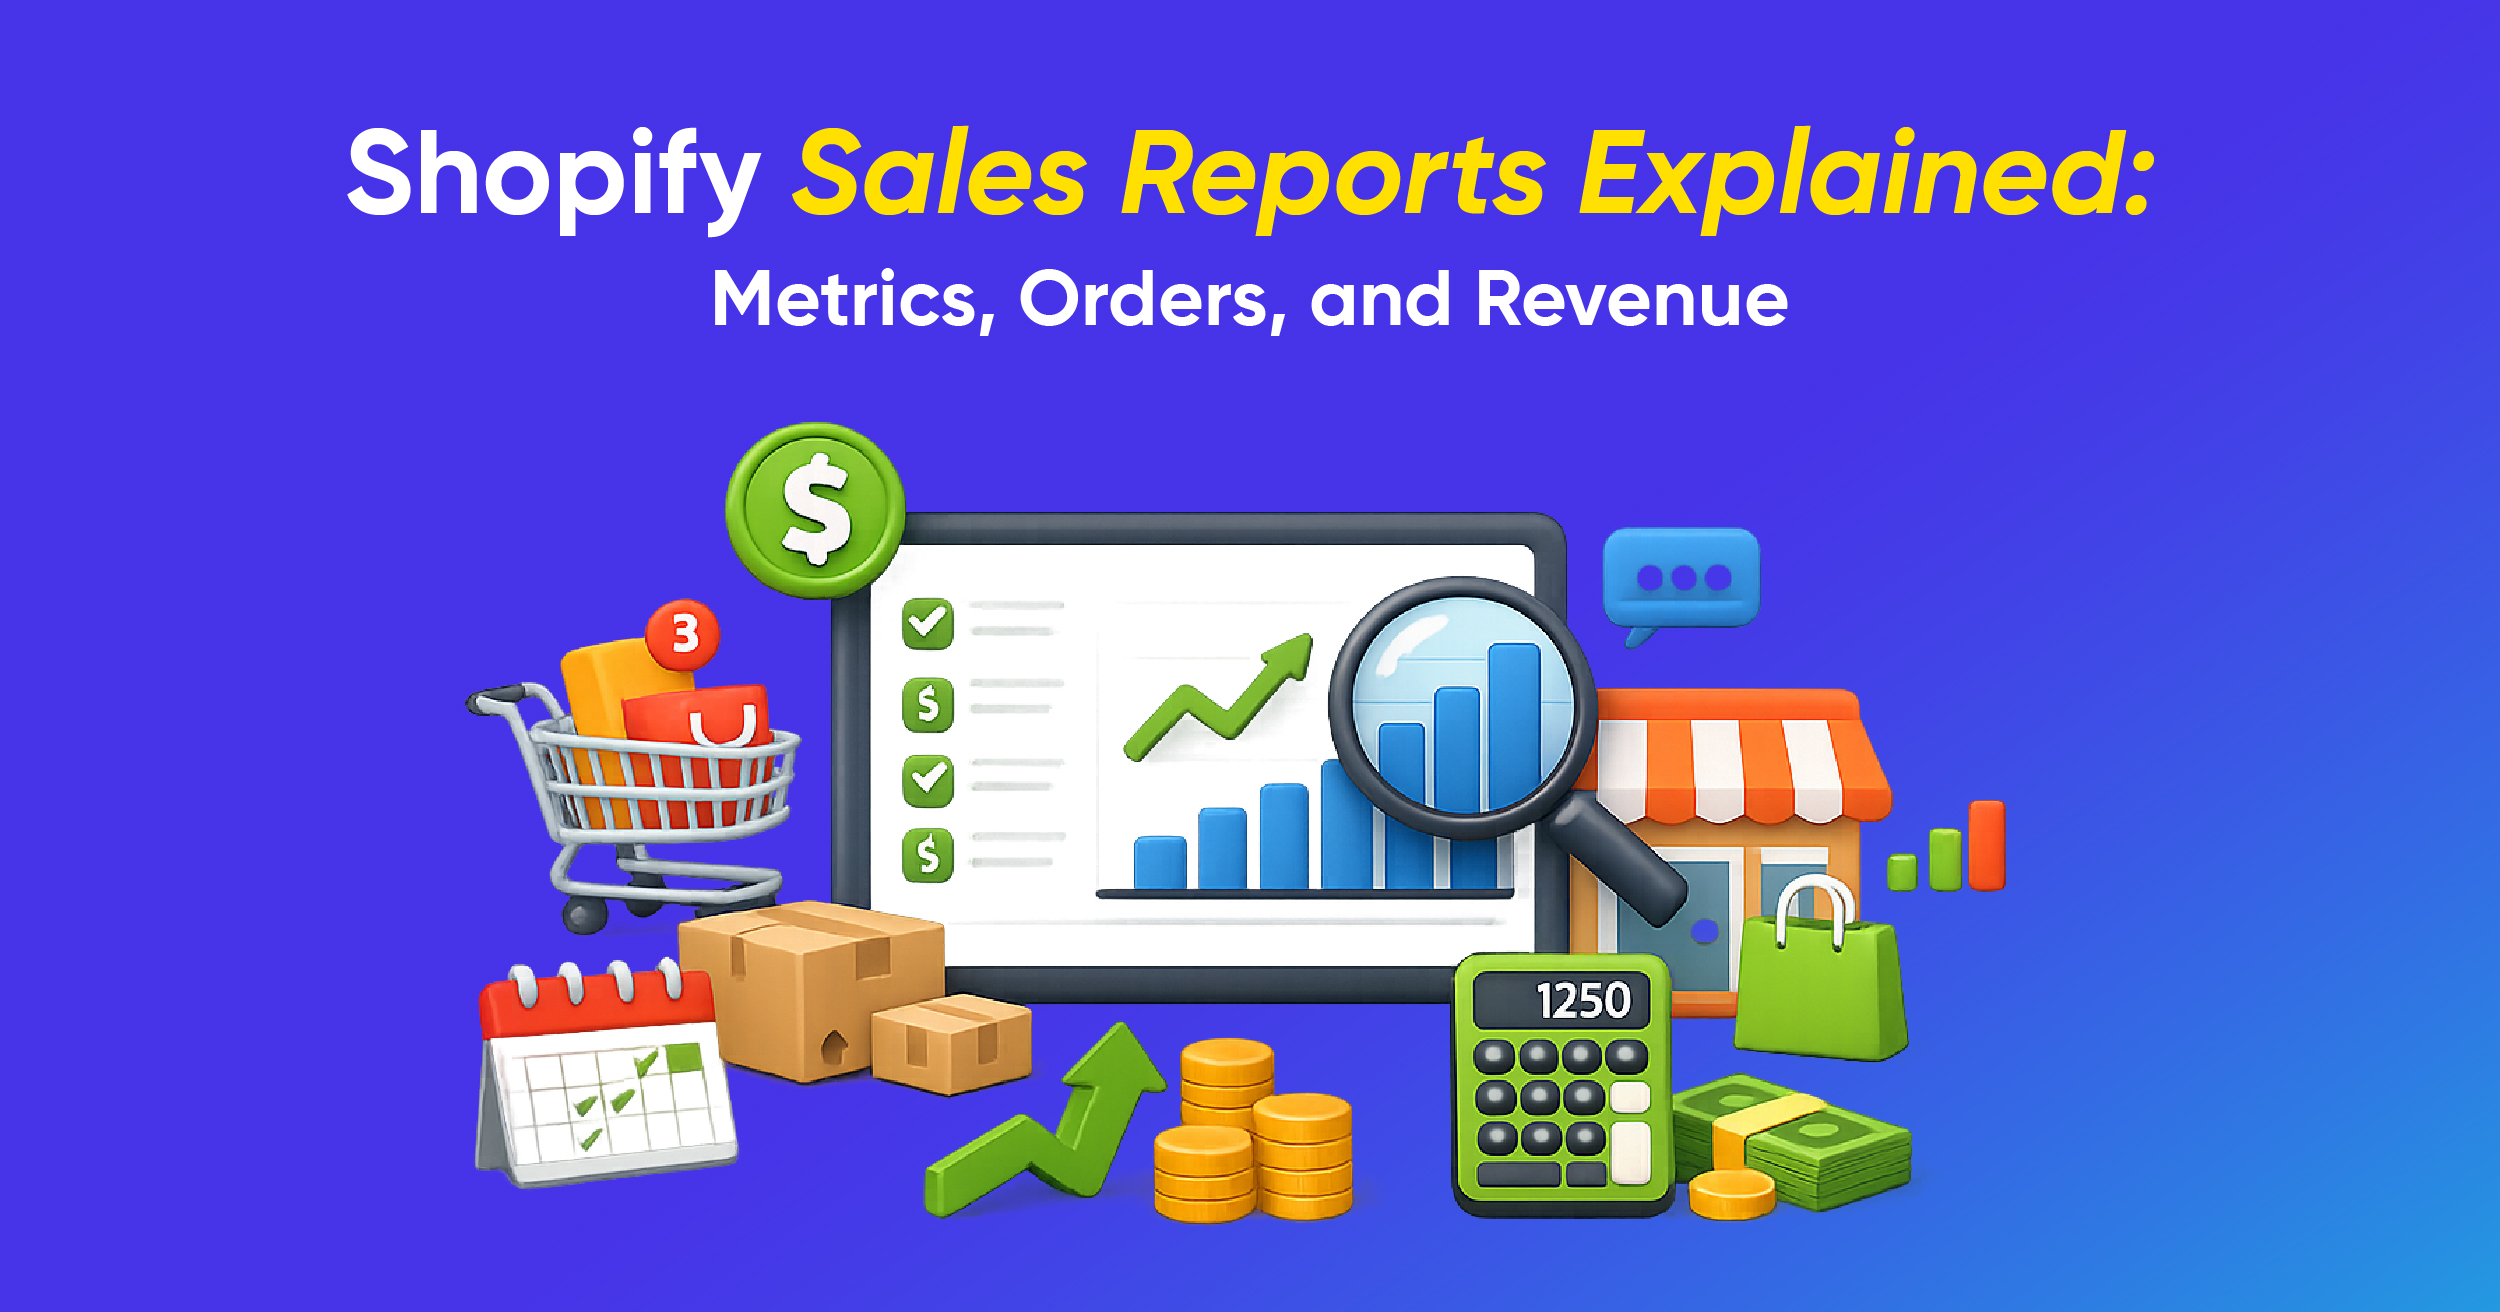
1) POS Sales by Location
Compare store performance, spot top products per location, and identify locations that need merchandising or staffing changes.
2) Sales by Staff
Measure performance by employee: revenue, units, and average order value. Build incentive programs and identify training opportunities based on real results.
3) Staff Who Assisted with Sales
Capture multi-associate sales so contributors receive credit. This promotes collaboration and fair recognition on the floor.
4) Profit by POS Location
Not all sales contribute equally. Including cost and discount fields lets you monitor gross profit and margin by store so you focus on profitable growth.
Tip: Add time filters to any of these reports to compare weekdays vs. weekends, mornings vs. evenings, and seasonal periods.
Discover Growth Opportunities and Overcome Obstacles
Analyzing product performance by location can reveal valuable sales trends, helping you maximize each product’s potential in different markets. The Sales by Location report offers a clear view of how each store is performing, pinpointing top sellers and identifying underperforming products.
If a product is lagging at a particular location, this report can highlight possible causes—such as low foot traffic, changing customer preferences, or seasonal shifts—so you can make timely adjustments. For example, you may decide to adjust pricing, run targeted promotions, or replace slow movers with higher-demand products for that store.
Recognize and Reward Staff Performance
Your staff play a pivotal role in driving in-store sales. The Sales by Staff report measures each employee’s direct impact on POS transactions. By reviewing these insights, you can:
- Reward top performers with incentives or recognition
- Spot opportunities for staff training and skill development
- Maintain a healthy work culture by ensuring fair acknowledgment of contributions
For cases where multiple staff members contribute to a single sale, the Staff Who Assisted with Sales report ensures those who helped are credited. Shopify’s staff feature in app settings lets you match IDs and names accurately, making your performance tracking reliable and actionable.
Compare Sales Across Channels
With Report Pundit, you can compare POS sales to online sales side-by-side. This insight reveals:
- Which sales channel is most profitable
- How customer preferences differ between in-store and online shopping
- Which promotions perform better in a physical vs. digital environment
Using this data, you can refine marketing strategies, allocate inventory more effectively, and create channel-specific offers to boost overall revenue.
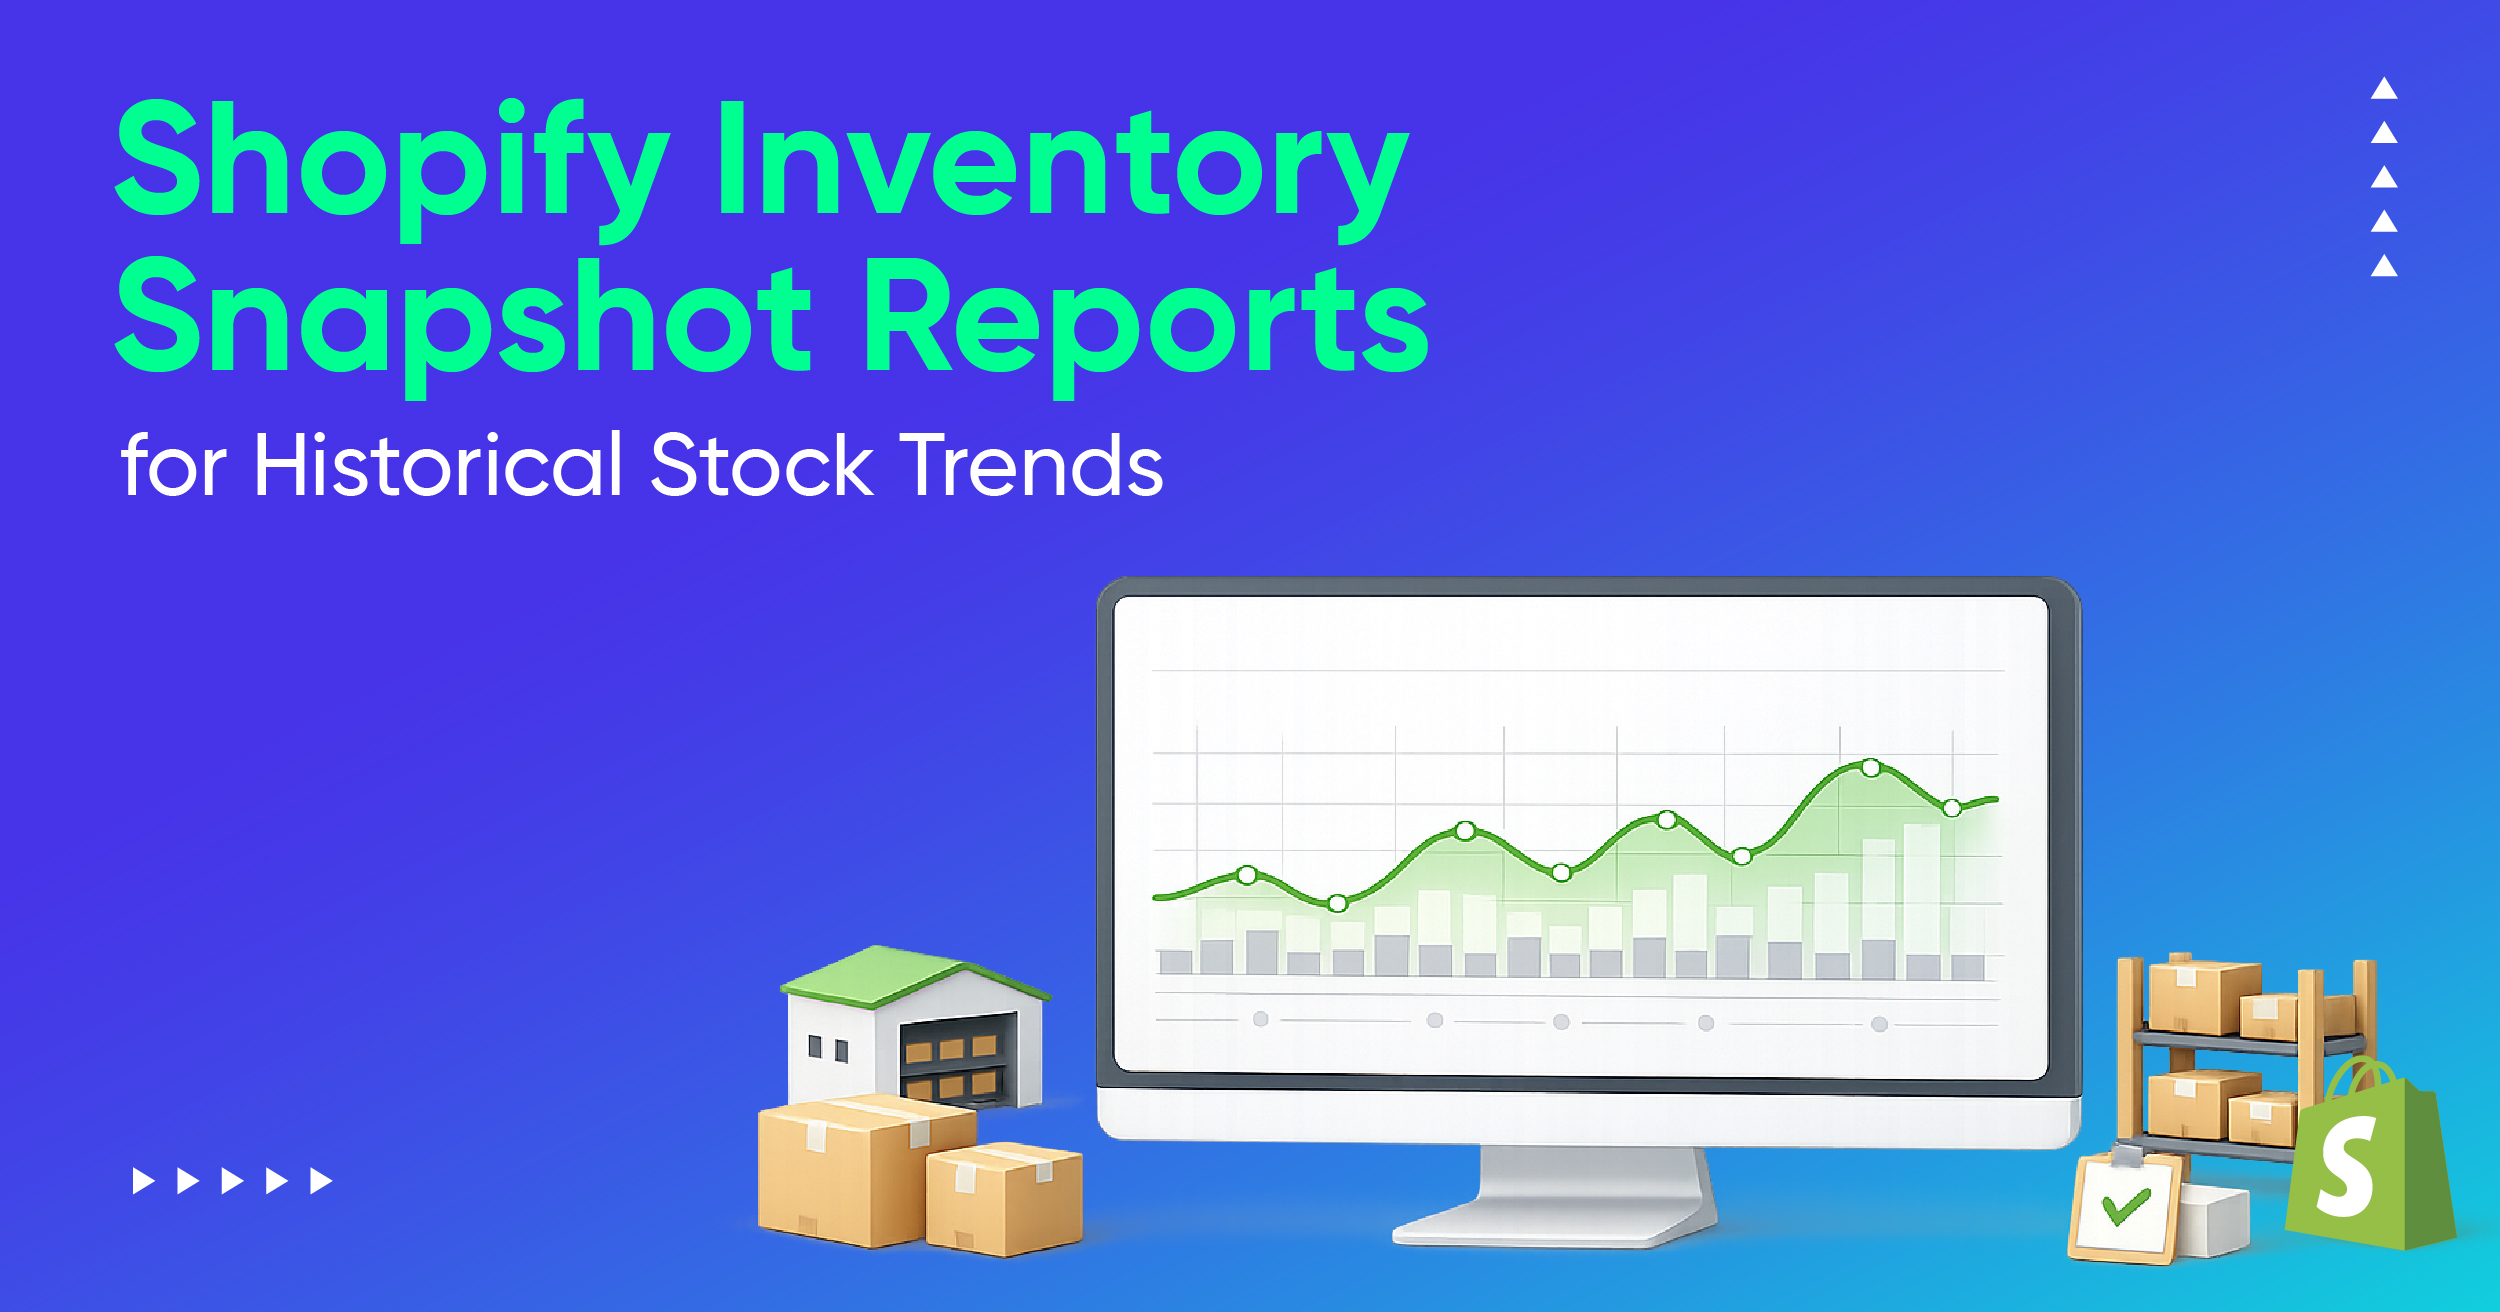
Understand Inventory and Order Fulfillment Trends
Inventory efficiency is essential for POS success. The Inventory by Location report gives a detailed look at stock levels and sales patterns at each store, helping you:
- Identify fast-moving products to keep in stock
- Reduce overstock of slow-moving inventory
- Plan replenishment cycles more accurately
Additionally, the Sales Over Time and Refunds reports track order fulfillment trends, including in-store pickups and online order returns handled through POS. This data helps you synchronize physical and online operations, ensuring smooth cross-channel sales and refund processes.
Get Custom POS Data
Every store’s data needs are unique. Report Pundit’s customization options allow you to combine different report types and data fields to suit your exact goals. For example:
- Combine Sales by Location with Product Tags to analyze a specific product category
- Drill down to see how many e-hybrid vs. combustion vehicles sold at each location (if applicable to your niche)
- Filter by date ranges, staff groups, or customer types for more targeted analysis
This flexibility means your POS reporting adapts as your business grows and your analysis needs evolve.
Case Study: Creating a Custom POS End-of-Day Report with Product and Staff Details
Client Need
A merchant wanted a POS End-of-Day (EOD) report filtered by location with these fields:
- Line Item Name
- Line Item Quantity
- Line Item Total
- Line Item Cost
- Product name and price
- Staff ID, Name, and Email for each transaction
Challenge
By default, only limited line item fields (such as Line Item Properties and Line Item ID) were visible. The team didn’t know how to include product attributes and complete staff details in one view.
Solution
Using Report Pundit’s Add Columns with Custom Property, we added:
- Product Name and Product Price
- Metafields and Note Attributes
- Line Item Properties
- Staff ID, Name, and Email
Result
The merchant launched a comprehensive POS EOD report with product specifics, transaction values, and full staff attribution. Reconciliation became faster, staff accountability improved, and managers could review each day’s performance before the next shift.
How to Put This Into Practice
- Start with a goal. Decide whether you’re optimizing staffing, improving margins, or tightening inventory turns.
- Pick a base report. Use one of the core POS report types above.
- Add the right fields. Include product attributes, cost, discounts, and staff details as needed.
- Filter and segment. Compare locations, time blocks, and promotions.
- Schedule delivery. Send daily EOD summaries to managers and a weekly roll-up to leadership.
- Review and iterate. Save versions and refine as your questions evolve.
Key Takeaways
- Shopify POS reports give crucial visibility into in-store performance, but default views can be limiting.
- Custom POS reporting with Report Pundit lets you combine fields, filter by location, and attribute results to individual staff.
- Automated schedules ensure everyone starts the day with the numbers that matter.
- Bringing product, staff, inventory, and profitability together helps you act faster and grow smarter.


.webp)
.webp)


Build and automate your Shopify Reporting
Unlock the full potential of your Shopify store with Report Pundit. Gain access to over 2000 data fields, automate reports, and make data-backed decisions to grow your business.