Shopify Customer Journey Reports to Improve Retention and ROI

.svg)
.svg)
.svg)
The Shopify Customer Journey Report is part of the Customer reports available in Shopify Analytics. These reports provide data on your customers' behavior, including metrics like average order count, average order totals, and expected purchase value. Key reports related to customer journeys include:
- New vs Returning Customers: Shows the number of first-time and returning customers over a selected period.
- Customer Cohort Analysis: Groups customers based on their first purchase date and tracks their repeat purchases over time, helping you identify valuable customer segments.
- RFM Customer Analysis: Analyzes customers based on recency, frequency, and monetary value to categorize them into groups like Champions, Loyal, or At Risk.
Why use Shopify Customer Journey Reports
To get crucial metrics on customer behavior, conversion rates, and marketing effectiveness, because you must know how your customers interact with your store from their first visit to making a purchase and becoming your loyal customer.
These report helps you to:
- Identify which marketing channels and campaigns drive the most traffic and sales.
- Understand customer retention and repeat purchase patterns through cohort and RFM analyses.
- Optimize your marketing strategies by targeting specific customer segments based on their purchase history and behavior.
- Improve the overall shopping experience by analyzing conversion funnels and customer interactions.
Shopify Customer Journey Reports Essential for Analysis
Within Customer Journey Reports, the Acquisition and Behaviour report highlights how visitors discover your store through search engines, social media, referrals, or direct traffic, and then explores what they do once they arrive by tracking page views. To learn more about these and other Shopify reports, you can refer to The Complete Guide to Shopify Reports, while here we will mainly focus on Customer Journey Reports.
- Customer cohort analysis
- Customers by location
- New customer sales over time
- New customers over time
- New vs returning customers
- One-time customers
- Predicted spend tiers
- Returning customer rate over time
- Returning customers
- RFM customer analysis
- RFM customer list
Customer Cohort Analysis
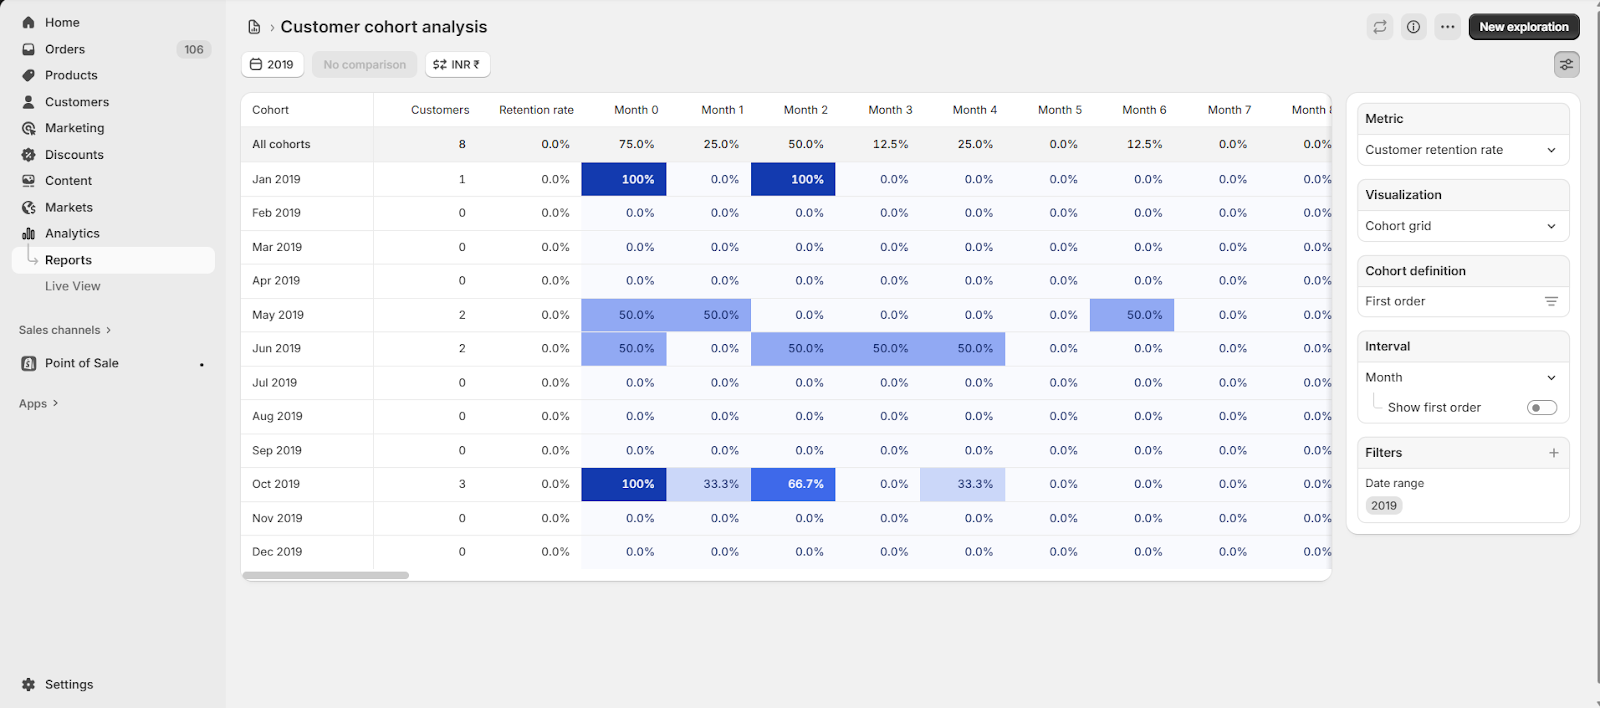
The Customer Cohort Analysis report shows how customers are acquired and retained. By default, it groups customers based on the date of their first order. You can customize metrics, define cohorts, and apply filters to view specific data.
This report helps you identify customers who make repeat purchases and understand which are most valuable, guiding decisions on when and how to re-engage them.
The Customer cohort analysis contains the following elements:
- Report visualization
- Cohort analysis table
- Cohort analysis details
Report Visualization- The Customer Cohort Analysis report is shown as a heatmap by default. You can change the visualization type from the configuration panel, with options such as:
- Cohort grid (heatmap)
- Retention curve
Cohort Analysis Table- The cohort analysis table shows repeat purchases based on when customers made their first purchase. Each row is a cohort grouped by the first purchase month.
- Column 1: Cohort name (month of first purchase)
- Column 2: Total of the selected metric
- Column 3: Metric for first orders
- Other columns: Metric over weeks, months, or quarters after the first order (Period 0 includes same-period repeats).
Example: If John’s first purchase was in February 2022 and he bought again in February, June, and September, he appears in the February cohort with repeat purchases in Month 0, Month 4, and Month 7.
You can customize metrics, cohort definitions, and filters in the configuration panel.
Cohort Analysis Details- You can click any interval cell in the cohort analysis table (e.g., Sep 2024 row, Month 2 column) to view details like:
- Total sales for the cohort
- Average order value and orders per customer
- Amount spent per customer
- Number of new vs. returning customers and their orders
- Top marketing and sales channels
- Predicted spend tier overview
- Ratio of one-time vs. subscription orders
- Top customer locations in the cohort

Customers by Location
In the Customers by location report, you’ll see all newly added customers based on their geographical location. Here are the key points about how Shopify defines customers:
- Anyone who buys a product from your store
- Anyone who creates an account on your website
- Anyone who begins the checkout process, even if they don’t finish their purchase
You can select new customer activity by date range, which will display the following results:
- Number of new customers added by region.
- Number of orders placed by those customers.
- Total amount spent, including discounts, taxes, refunds, and shipping costs.
One-time Customers
The One-time customers report displays data of customers who placed only one order from your Shopify store (where the preset filter is returning is No).
Where, returning is No" means that the report only includes customers who have not made any repeat purchases.
You can view the following information for each customer:
- Name
- Email address
- Permission for marketing promotion – which means the customer has permitted you to send marketing promotional material to them.
- Orders to date
- Total spent to date (taxes, shipping, refunds, and discounts applied)
This data is quite helpful when you are trying to reactivate inactive or even hesitant shoppers.
For example, if you’ve had 100 customers who just bought once in the last quarter, you can probably run a promotional email campaign targeting them with one-time 10% off discount coupons. This could give them enough motivation to make a second purchase.
Returning Customers
Returning customers are the lifeblood of your sales. According to shopify, 28.2% of all e-commerce transactions come from repeat customers. Shopify’s Returning customers report shows you data on customers who are placing two or more orders.
For each customer, you’ll get the following details:
- Name
- Email address
- Permission for marketing promotion
- First order date
- Last order day
- Orders to date
- Average order value
- Total spent to date
This information will help you determine your Ideal Customer Profile (ICP). An ICP is the type of customer that will most likely buy your products.
You can then create necessary promotional campaigns to target your ideal customers.
New vs Returning Customers
When it comes to e-commerce sales, the First-time vs returning customer sales report is arguably one of the most important reports Shopify has to offer.
Whether you’re selling digital downloads or physical goods, comparing one-time vs returning customer sales always provides actionable insights, such as which type of customers are buying the most from you.
In this report, you will find the number of orders placed by first-time customers, right alongside returning customer activity. You can group these sales by hour, day, week, month, quarter, year, hour of day, day of week, or month of year
Like many other Shopify reports, you can filter results based on customer or shipping attributes, and display which records you’d like to appear by editing columns.
New Customers Over Time
The Customer Overtime report shows the total number of first-time and returning customers who placed orders in your store over time. This report is cumulative, meaning the numbers increase over time based on previous reporting periods within the date range.
Once you choose and confirm your desired date range (along with filters and columns based on your needs), this report will display the following:
- The month of data
- Customer type (First-time or Returning)
- Number of customers (including total)
Predicted spend tier
The Customer by Predicted Spend Tier report helps you stop rolling the dice on high-value customers to target for maximized customer lifetime value and ROI. It predicts the value of each customer in a chosen cohort, so you know what they’re really worth to you. You save a ton of time, money, and other resources on chasing the wrong kind of customer with your marketing.
The details you get from this report are:
- Customer name
- The predicted spend tier
- Email subscription status
- The date the customer placed their last order
- The number of orders that they have placed
- The total amount that they have spent, including taxes, discounts, shipping, and any refunds
RFM Customer Analysis
RFM stands for R (Recency): Days since last purchase, F (Frequency): Total number of orders, and M (Monetary): Total amount spent. RFM analysis helps you understand customer behavior to improve retention and loyalty.
Each digit ranges from 1 (lowest 20%) to 5 (top 20%) based on your store’s data (not industry benchmarks). Customers are then grouped into 11 RFM categories, which you can use to plan marketing, sales, and loyalty strategies.
The RFM category for a customer can change over time as their spending, purchase frequency, and loyalty shift. For example, a shopper who buys often may move from New to Active, and later to Loyal or Champion. If they stop purchasing, they might become Dormant or Previously Loyal.
The RFM Customer Analysis report automatically assigns helpful tags to each customer, such as New, Loyal, Active, Dormant, Previously Loyal, Champions, and more. These tags make it easy to see where every customer stands so you can target them with the right campaigns and offers.
Note: Individual RFM scores aren’t shown in Shopify, only the group classification.
The report table includes:
- Percentage of total customers
- New customer records
- Average days since last order
- Total orders
- Total amount spent
Note: A discrepancy may occur between the total number of customers and the number of grouped customers due to data synchronization delays.
RFM Customer List
This RFM list includes all customers (except those in the Prospects RFM group) and shows:
- Average days since last order
- Total number of orders
- Total amount spent
You can add dimensions and filters to create custom explorations. Use the Preview segment to open the segment editor and apply a customer segment based on selected RFM groups and filters.
Note: For details on how RFM groups are calculated and categorized, refer to the RFM Customer Analysis report.
And that brings us to the end of Shopify customer reports. Using these reports effectively will help you gain significant information about your customers, which will later enable you to optimize your store.
Discover Advanced Customer Journey Reports for Your Store
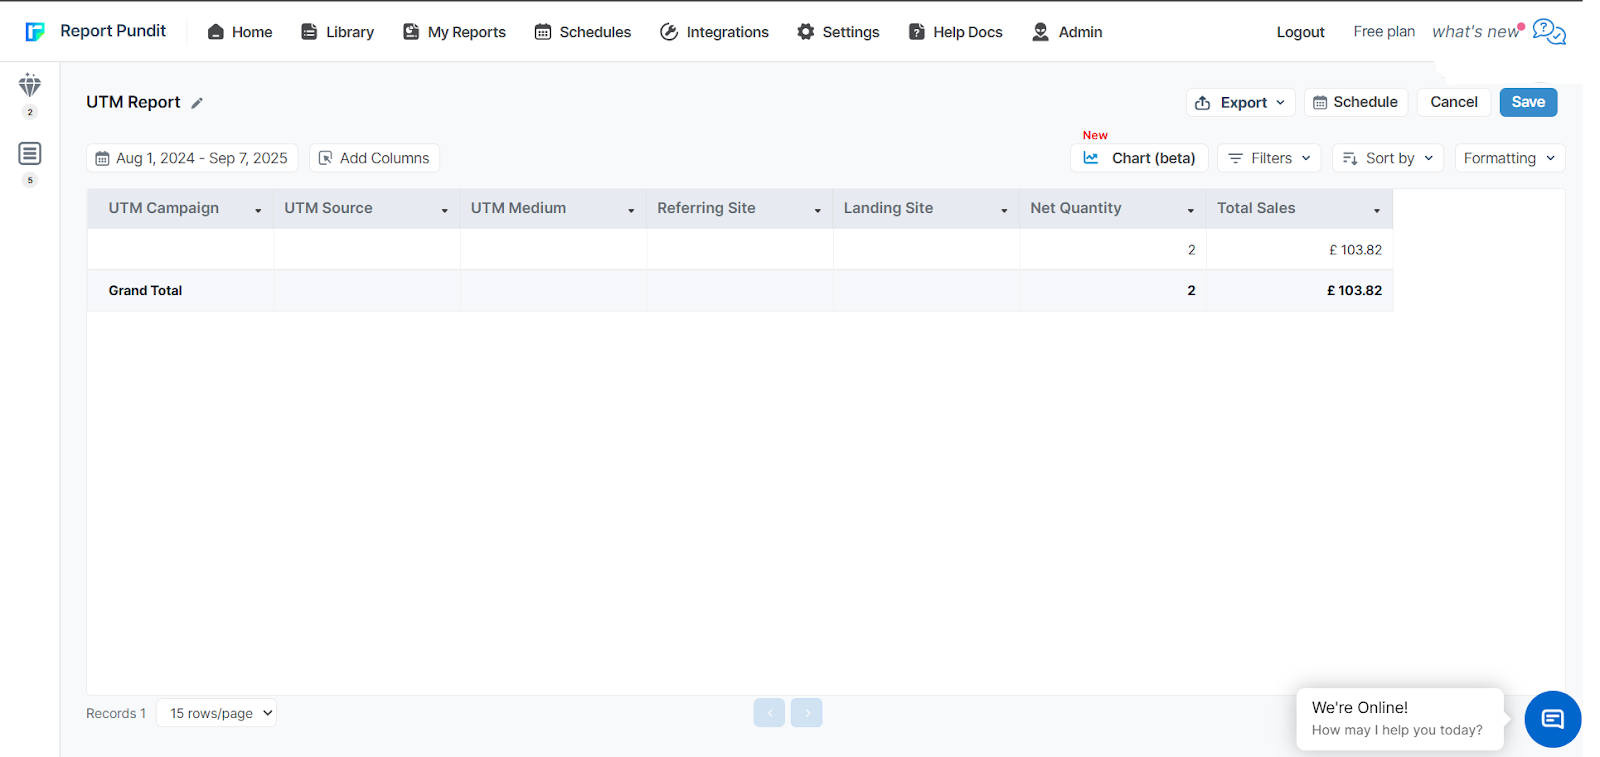
UTM Report
This report helps track UTM to help you measure the performance of your marketing campaigns by identifying where your store’s traffic is coming from. By appending UTM parameters such as utm_source, utm_medium, and utm_campaign to your links, you can attribute sessions, orders, and sales to specific marketing efforts.
When you send an email send an email campaign, UTM tracking is automatically included. You can also customize UTM parameters for each campaign, allowing you to track link clicks and conversions.
To review the impact of your UTM-tagged campaigns, Shopify provides Marketing reports and Campaign reports, where you can analyze metrics like sales, orders, sessions, and conversion rates attributed to particular UTM campaigns and sources.
Customer Journey
The Customer Journey in Shopify refers to the path your customers take from their first interaction with your store to making a purchase and beyond.
It provides detailed customer reports that include metrics such as Customer Name, Total Spent, and Order Count, which can help you analyze your customer base effectively.
Sales by Referring Site
The Sales by Referring Site report in Shopify shows you which websites or sources are generating sales for your store. It groups sales data by the referring domain, for example, Google, Facebook, Instagram, or other external websites that sent visitors who eventually made a purchase.
By reviewing this report, you can quickly identify your top-performing referral sources and see which channels contribute the most revenue. This insight helps you decide where to focus your marketing budget and efforts, and where you may need to adjust strategies to improve performance.
Sales by UTM Source
The Sales by UTM Source report displays the revenue attributed to specific UTM sources from your marketing campaigns. Using UTM parameters such as utm_source, you can identify whether sales came from channels like Facebook, Google, email campaigns, or other traffic sources.
By analyzing this report, you can see which sources are driving the highest return and optimize your marketing spend toward the channels that perform best.
Sales by UTM Medium
The Sales by UTM Medium report in Shopify enables you to analyze sales attributed to various UTM medium parameters in your marketing campaigns, including email, social, and paid ads. This report shows how various marketing channels contribute to your store's sales. These reports display adjusted gross sales, orders, and sessions linked to UTM parameters, helping you understand which marketing mediums are most effective.
When creating Email campaigns or other marketing activities, UTM tracking is included by default and can be customized to better track your campaign's performance.
Sales by UTM Campaign
The Sales by UTM Campaign report shows sales attributed to specific UTM campaign parameters (utm_campaign) used in your marketing links. This report helps you identify which individual campaigns, such as seasonal promotions, product launches, or ad initiatives, are generating the most revenue for your store.
Whenever you create Shopify marketing campaigns or send Email campaigns, UTM tracking is automatically applied, and you can rename the UTM campaign to better track and differentiate performance across campaigns.
By analyzing this report, you can evaluate the effectiveness of each campaign, compare results, and refine your marketing strategy to focus on the initiatives that drive the most sales.
Conclusion
Shopify’s Customer Journey and Marketing Reports give you a complete view of how shoppers find, buy, and return to your store. From tracking new versus returning buyers to analyzing cohorts, RFM segments, UTM data, and referral sources, these tools reveal which campaigns are effective and which customers drive the most value. By using these reports, you can focus your budget on the right channels, build loyalty with high-value customers, and improve every step of the shopping experience.
If you want something truly amazing and advanced, you must try custom reporting or third-party apps like Report Pundit, which let you create customer journey dashboards, automate schedules, and optimize your ROI, ultimately growing your Shopify store.


.webp)
.webp)


Build and automate your Shopify Reporting
Unlock the full potential of your Shopify store with Report Pundit. Gain access to over 2000 data fields, automate reports, and make data-backed decisions to grow your business.