Shopify Sales Reports Explained for Better Understanding


.svg)
.svg)
.svg)
Sales data isn't just numbers, but it's the source of data for your Shopify store’s performance. And there’s a lot of pile-up sales data to manage. Shopify Sales Reports can organize that data into comprehensive records, complete with multiple features that make it easy to gather insights from it.
Let’s understand what Shopify sales reports can deliver for your business and how you can take them further.
Shopify Sales and Order Reports
What is a Sales Report?
A Shopify sales report shows how your store's performance has evolved. It includes key figures like orders, revenue, discounts, returns, taxes, and shipping, and lets you break results down by product, variant, channel, location, staff, and date to spot trends and make better decisions
Below is a list of the most common default sales reports available in Shopify, accessible on all plans. Let’s go through them.
As their names suggest, each report gives data on a specific aspect of your sales. Many data columns are common between them, with some unique ones setting the reports apart from one another.
What is an Order Report?
The Shopify Orders Detail Report brings all the crucial data of an order together in one place. As a result, you (merchants) can easily keep track of what’s happening with each order.
As orders are the main way customers connect with a store, it’s important to make sure they are delivered on time and meet customer needs. With this report, you can see order numbers, fulfillment progress, shipping updates, delivery status, and returns. In this way, you always have a clear picture of how your store is performing.
Key Difference Between Shopify Sales & Order Report
Here are a few major differences between the two:
The 'Orders Report' in Shopify provides a high-level summary of all orders placed in your store. It gives an overview of order volume, fulfillment status, shipping progress, and return statistics without going into the granular details of each order. This report helps merchants quickly understand overall order activity and operational efficiency on a summary level.
On the other hand, the 'Sales Report' offers a detailed breakdown of each order, including specifics about the products sold, quantities, shipping costs, taxes, discounts, and other financial details related to the order. Sales Reports dive deeper into the revenue generation side, showing how much money was made, the impact of promotions, and detailed sales trends by product, customer, or location.
Simply, the Orders Report focuses on 'order processing at the summary level', while the Sales Report concentrates on 'financial details and comprehensive analysis of sales performance down to product and transaction level' in Shopify.
How Shopify Sales and Order Reports Can Help Your Business
Growing a successful Shopify store means looking beyond basic sales figures and understanding the story your data tells. Whether it’s tracking staff performance, analyzing sales channels, managing bundles, or staying on top of tax reporting, the right reports can make all the difference.
Here’s a look at essential reports across categories, and how they can help you make business decisions.
1. Shopify Average Order Quantity Over Time
This report gives you a snapshot of how your average order value changes over time. You can break it down by hour, day, week, month, even by day of the week or time of day.
Keep in mind that this report shows overall averages, not the highest or lowest sales values.
For example, if you make just 2 sales one day and then 99 the next, your average won’t be 99. It’ll be somewhere in between, depending on your 30-day performance. This report helps you spot long-term insights rather than get distracted by spikes.

2. Shopify Bundle total sales over time
This report tracks the number of orders and total sales generated from bundled products, where two or more items are sold together as a single package.
Bundling can be a smart strategy to move slower inventory by pairing it with your best sellers. This report shows whether that strategy is working for you or not, and helps you to modify your offers if needed.
3. Shopify POS staff orders total
This report highlights the sales made by each of your store staff through your Point of Sale (POS) system over a period of time.
You can see which staff members are making the most sales, how much discount is being given to the customers, and you can even use this data to offer performance-based rewards. It's a great way to appreciate your top performers.
4. Shopify Sales by Customer Name
The Sales by Customer Name report can be extremely useful when you want to identify your most or least loyal/active customers by sales activity.
Suppose you want to focus on customers with sales over $500 during the last year. You can use this report and add the filters to fetch the relevant data.
You can then use the results to run targeted email campaigns focused on upsell opportunities.
5. Shopify Top Product Variants by Units Sold
This report tells you which specific product variants (like color, size, or style) are selling the most.
It gives you a more detailed look than just “top-selling products.” For example, maybe your black t-shirt in size M is selling way more than any other size or color, and that's important when planning inventory!
Key details in this report include:
- Product title: Name of the product
- Variant title: Name of the specific variant
- Variant SKU: Identification code for the variant
6. Shopify Total Sales Over Time
Often called your “master sales report,” the Total Sales Over Time report in Shopify plots sales activity on a clear line graph, letting you see performance across custom time increments (day, week, month, year). You can export data for a specific date range, group it by different periods, and view metrics such as total orders, gross sales, discounts, returns, net sales, shipping, taxes, and fees.
This report gives a view of how your business is performing over time, helping you spot seasonal trends, measure campaign impacts, and understand whether your store’s growth is consistent or fluctuating.
7. Shopify Total Sales by Product
This report lists unit sales by product along with details like product title, vendor, and type. It includes a breakdown of gross sales, discounts, returns, and net sales.
By showing exactly which products generate the most revenue, this report helps you prioritize your marketing spend, refine your product lineup, and make smarter stocking decisions.
8. Shopify Total Sales by Vendor
For merchants working with multiple brands or suppliers, this report details net quantity, gross sales, discounts, returns, net sales, taxes, and total sales by vendor.
It’s an excellent report for supplier negotiations, measuring vendor performance, and ensuring you’re focusing resources on the most profitable partnerships.
9. Shopify Sales by Discount Codes
This report shows sales generated by specific discount codes within a selected period, including both automatic discounts and manually entered codes.
It helps you measure the effectiveness of promotions, identify which codes drive the most sales, and fine-tune your discount strategy for maximum profit.
10. Shopify Total Sales by Social Referrer
This report tracks which social channels (e.g., Facebook, Instagram, Google) contribute the most sales.
By identifying your top-performing traffic sources, you can optimize ad spend, double down on channels with the highest ROI, and adjust marketing campaigns.
11. Shopify Active Subscriptions Over Time
This report tracks the number of active subscription contracts over time, displaying trends in a line graph and allowing period comparisons.
It is essential for subscription-based businesses, letting you quickly spot growth trends and measure the long-term stability of your recurring revenue.
12. Shopify Canceled Subscriptions Over Time
The report shows how many subscription contracts were canceled over time, with comparisons across different periods.
This is an important churn analysis report. By tracking cancellation spikes, you can investigate causes like- whether it’s product dissatisfaction, pricing, or delivery issues and implement retention strategies.
13. Shopify New Subscriptions Over Time
Tracks the number of new subscription contracts over time and compares current performance to previous periods.
By revealing how many new subscribers you gain, you can measure acquisition success and test the impact of marketing campaigns targeting subscriptions.
14. Shopify Subscription vs. One-Time Sales
Compares total sales and order counts for subscription products versus one-time purchases.
This helps you understand the balance of recurring versus single-purchase revenue, guiding pricing, upsell tactics, and retention strategies.
15. Shopify Bundle Item vs. Non-Bundle Sales
Shopify Bundle item vs. Non-bundle Sales report compares the sales performance of bundled items versus the same products sold individually.
It also helps determine if bundling is boosting sales or just moving inventory differently. It’s especially useful for pricing strategy and promotional planning.
16. Shopify Total Sales by Bundle Component
It shows sales data for each product included in bundles. And by identifying best-selling components in bundles, you can adjust bundle composition for pricing and promotion strategies to maximize your sales.
17. Shopify Gross Sales by Sales Channel
This report provides the total revenue per sales channel, excluding taxes, fees, discounts, and returns.
18. Shopify Gross Sales Over Time
It shows the value of all purchased items before adjustments over a selected period.
This is a raw measure of your revenue potential, helping you spot sales peaks and dips without the distortion of discounts or returns and edited orders.
19. Shopify Items Sold by Referrer
A referrer is the source that sends visitors to your store, showing where they came from before buying.
For example, if someone clicks a link to your product on Instagram and then makes a purchase, Instagram is the referrer.
So, this report shows which referrers generate the most product sales. By knowing exactly where your converting customers come from, you can better target marketing, optimize acquisition campaigns, and focus efforts on high-converting sources.
20. Shopify Total Sales by Referrer
This report tracks total sales based on the exact source that referred the customer. And helps you determine which partnerships, affiliates, or campaigns are most effective at driving conversions.
21. Shopify Net Sales by Sales Channel
This report shows net sales (gross sales minus discounts and returns) broken down by channel.
This provides a clearer profitability picture for each sales channel, helping you identify which ones are worth scaling and which may be draining resources.
22. Shopify Net Sales Over Time
Tracks your store’s net sales over a chosen time frame.
This report is ideal for assessing overall business health. This report helps you distinguish between actual revenue growth and short-term sales spikes driven by promotions.
23. Shopify Total Sales by Product Variant
Breaks down gross sales for each product variant, excluding shipping, and shows net quantity sold.
This is perfect for inventory and merchandising. It ensures you stock the right sizes, colors, and configurations based on actual demand.
24. Shopify Total Sales by Billing Location
This allows you to see sales data by customer billing region or country. And this geographic insight lets you run targeted location-based campaigns and tailor your inventory and shipping options to regional demand.
25. Shopify Total Sales by Currency
This report shows the currency used in sales; it is available only to Shopify Payments merchants.
Example: For international sellers, this report clarifies currency trends and helps you set prices, run promotions, and plan currency-specific products.
26. Shopify Total Sales by Sales Channel
This report tracks total sales across all sales channels, including retail, online, and others.
By comparing sales volume between channels, you can optimize channel strategies and balance focus between POS and web sales.
27. Shopify Average Order Value Over Time
The report calculates the average amount spent per order over time, visualized in a line graph.
It is also helpful for identifying upselling opportunities, testing pricing strategies, and understanding changes in customer purchasing behavior.
28. Shopify New Vs Returning Customers Sales
The New vs Returning Customers report in Shopify compares first-time buyers with repeat customers over a chosen period. You can group results by hour, day, week, month, quarter, or year, with separate rows for each customer type.
A first-time customer is making their very first purchase, and a returning customer is someone who has shopped with you before. This report helps track acquisition and retention trends, showing whether growth comes from new shoppers or loyal buyers.
29. Shopify New vs Returning Customers Over Time
The New vs Returning Customers Over Time report in Shopify shows how many first-time and returning customers placed orders, grouped by a chosen time unit (hour, day, week, month, quarter, or year). This helps you analyze acquisition and retention trends over specific periods.
Shopify Orders Report
As an e-commerce merchant, you need to know how and when orders are placed, how they’re fulfilled, how they’re returned, and how much fuel you’ve got on a day-to-day basis.
With Shopify’s Order reports, you’ll easily find this information. These reports give you details about order frequency, order volume, fulfillment information, shipping data, and product returns.
To access these reports, choose Analytics in the left side admin panel; then click on the category of Orders Report Reports.
Here are some of the order reports you’ll find:
1. Shopify Order to fulfillment time
A Shopify Order to Fulfillment Time Report explains how long it takes from when a customer places an order until it is fulfilled. It helps store owners understand how quickly they process orders and identify any delays in their workflow.

2. Shopify Items bought together
The Items bought together report displays the most common product combinations purchased together, so you can identify opportunities for bundles, upsells, and promotions. This report includes only processed orders as opposed to items inside a cart before checkout.
You can change dimensions between Products bought together and Variants bought together, and apply filters such as 'Number of products bought together' and 'Number of variants bought together' to gain more specific insights into your customers' buying habits.
3. Shopify Items ordered over time
The "Items ordered over time" metric in Shopify helps you track the total number of individual product units ordered during a specified time period. This metric is useful for understanding sales trends and inventory demand over time.
4. Shopify Items returned by product
You can view the quantity of items returned by product using Shopify's sales reports. Specifically, the report shows the total number of items ordered and returned during a selected time period, along with the return rate.
This report provides details such as product title, ordered quantity, returned quantity, and return rate, helping you understand which products are returned most often.
5. Shopify Items returned over time
Report tracks the number or value of products that customers have returned to the store over a specified period. This report helps merchants understand return trends, identify frequently returned products, and analyze reasons behind returns to optimize inventory, customer service, and sales strategies.
6. Shopify Orders and Returns by Product
The Orders and returns by product report helps you understand which products are your best sellers, and which get returned the most often. The report displays the total number of products that were ordered over the selected time period and how many of them were returned.
7. Shopify Orders delivered over time
You can view the report in your Shopify admin to track the total number of orders that have been delivered over a selected time period. This report provides metrics on delivered orders, helping you monitor your delivery performance.
8. Shopify Orders fulfilled over time
You can view the "Orders fulfilled over time" report in your Shopify admin to track the total number of orders that have been fulfilled, shipped, or delivered over a selected time period. This report provides metrics such as the number of fulfilled orders, shipped orders, and delivered orders, helping you monitor your fulfillment performance.
9. Shopify Orders Over Time
This report shows all the orders within a time period.
Whenever you need a visual trend that displays how many orders are placed between dates, this is the report that gets the work done.
By default, the Orders over time report displays the average units ordered, average order value, and quantity of items returned within a selected date range.
10. Shopify Return rate over time
The Return rate over time report displays the percentage of items returned compared to the total number of items that were ordered during the selected time period. It displays the percentage of items returned compared to the total number of items that were ordered during the selected time period. This report helps you understand how your return rate changes over time, giving you insights into product returns and customer behavior.
11. Shopify Shipping and Delivery Performance
The Shipping and delivery report is a critically important logistical resource in your Shopify arsenal. It shows you the collective time required for a product to be fulfilled, shipped, and delivered to customers from the moment an order is placed. This is an excellent tool to optimize your overall fulfillment and delivery time since Shopify gives you a chart-based performance view that easily identifies anomalies.
12. Shopify Shipping labels by order
The "Shipping labels by order" report in your Shopify provides a detailed breakdown of the shipping labels you've purchased over a selected time period.
This report excludes return labels, canceled or voided labels, adjustments, and labels not purchased through Shopify Shipping. It provides information such as order number, origin and destination country, and postal codes, carrier, shipping service, tracking number, package details, shipping cost, and any discounts received.
13. Shopify Shipping labels over time
Use this report in your Shopify admin to analyze purchase trends and the costs of Shopify Shipping labels over a chosen time period. It provides details such as the number of labels purchased, total cost, and average cost per label. This report also excludes similar metrics like Shopify Shipping labels by order report.
How to Create a Sales Report in Shopify
- Log in to Shopify Admin
- Go to Analytics → Reports and filter by the Sales category to view sales-related reports.
- Create a Custom Report (Optional)
- Click New Exploration to build a custom sales report from scratch.
- Choose Metrics and Dimensions
- Example: Metrics → Net Sales
- Dimensions → Month, Product
- Add filters as needed.
- Run the Report
- Click Run to generate the report.
- Save and Access Anytime
- Click Save, give your report a name, and access it anytime under Reports.
How Report Pundit Works Beyond
With Report Pundit, you get 30+ ready-to-use reports on Sales and Orders. Plus, you get insights with data on refunds, draft orders, staff performance, and much more, giving you a complete store view in one place.
Report Pundit includes all the reports Shopify provides, plus a library of additional prebuilt reports you can generate (we’ll cover these below). The key difference is that with Report Pundit, you can customize reports, add custom properties, metafields, and third-party data, automate delivery and scheduling, all of which Shopify’s native reports do not support.
After creating a report, you can schedule it to be delivered anytime in the file format and destination you want. You can also connect third-party apps to include sales and other store data directly in your reports.
So, let's explore Report Pundit's pre-made reports one by one:
- Last 24 Hours Orders
You can use the Last 24 Hours Orders report to track all orders from the past day and quickly see sales trends, customer activity, and order statuses. This helps you monitor recent performance, spot opportunities, respond to issues faster, and make informed decisions with an up-to-date report.
- Last 30 days Sales Summary
This report gives a complete view of sales performance over the past 30 days by tracking total revenue, order count, and average order value. It also tells product-specific sales trends and pricing insights so that you can focus on marketing for top-performing products to improve product stock planning.
- Order Report
Order reports help you understand your order volume, fulfillment, sales, shipping, delivery, and returns. They provide valuable insights to improve how you process and manage orders.
Here’s what you get with order reports:
- Orders over time: This shows the total number of orders received during a selected period.
- Orders and returns by product: Displays best-selling products along with their return rates.
- Order to delivery speed: Tracks how long it takes to fulfill and deliver orders.
- Orders fulfilled over time: Shows the number of orders that have been fulfilled, shipped, or delivered over a period of time.
- Shipping labels by order: Provides details about shipping labels purchased for each order.
- Finance Summary Report
This report gives a clear snapshot of your financial performance by bringing together key metrics such as sales, gift cards, payouts, gross profit, and transaction breakdown in one easy-to-read, accounting-friendly format.
This is a prebuilt report that you can customize as well. It saves time by removing the need to check multiple reports, and delivers automatically by email to make month-end reconciliations simple and efficient.
- Sales by Product
The Sales by Product report shows each product’s performance over a chosen period. It tells the top and low performers. With that, you can manage inventory more effectively, focus marketing on popular items, and adjust strategies for slower sellers to enhance overall sales.
- Sales by Variant
The Sales by Variant Report shows detailed information about how each version of a product is selling. It groups data by product variant, so you can see metrics such as the number of items sold, quantities ordered, and other key details. This helps store owners understand which variants perform best and make smarter decisions about inventory and sales.
- Sales by Vendor
The Sales by Vendor report shows how each vendor’s products impact your store’s performance and helps you make strategic decisions to boost profits. By tracking sales, purchase costs, and margins, you can identify high-performing vendors, improve ROI, and refine purchasing strategies while optimizing inventory management.
- Sales by POS
The report shows detailed sales and net product counts at each POS location while accounting for refunds, giving an accurate data of performance. This report helps track product movement, manage stock levels, plan replenishment, and compare sales across locations.
- Sales by Staff
This report quickly analyzes sales for each staff member across all POS locations, from gross to total sales, allowing you to see exactly how sales are calculated. It helps you assess individual contributions, identify top performers, and spot areas for improvement. By linking staff performance to sales outcomes, you can make better decisions on staffing levels and resource allocation.
- Sales by Discount Code
The Sales by Discount Code report in Report Pundit shows sales generated from specific discount codes over a chosen period. It helps you see which codes drive the most sales, understand customer preferences and buying behavior, and measure how discounts affect profitability. This insight lets you adjust promotions and improve budgeting decisions.
- Sales by Channel
The Sales by Channel report displays sales by source, enabling you to understand which channels generated the most revenue. You can see why customers prefer certain channels to improve their shopping experience and refine your marketing strategies.
Additionally, it identifies the top-selling products for each channel, helping you optimize promotions and other marketing strategies.
- Sales by Customer
The Sales by Customer Report shows sales by individual customers, which helps you to identify your most valuable and frequent, and non-frequent buyers.
With these insights, you can build loyalty programs, send targeted offers, and engage customers personally. It also shows which products are most popular with top customer segments.
- Refund Report
Refund Report tracks money that is returned to customers when they return a product or service. It helps you to maintain accurate financial records to monitor refund trends, improve customer satisfaction, and help you prepare tax filings.
- Commission Report
Motivating teams through fair rewards boosts engagement and performance. So, this Commission Report helps by rewarding store staff and affiliates by showing their sales performance and calculating their commission share. It tracks commissions on a daily, monthly, and quarterly basis, which makes it easier to monitor progress.
It also supports better pricing and marketing decisions by revealing how commissions influence sales.
- Completed Draft Order
The Completed Draft Order" report shows the draft order that has been finalized and converted into a regular order in your store. This happens when payment is collected or the order is marked as paid.
Draft orders let you create orders for customers, such as for phone or in-person sales. Once completed, they act like any other order in your store.
- Pending Draft Order
A Pending Draft Order is an order that a store owner or staff member has started on behalf of a customer but hasn’t finished yet. This can happen for many reasons, such as waiting for payment, missing details, or a change in the customer’s decision.
With the Pending Draft Order report, you can easily see these unfinished orders, reach out to the customers, and encourage them to complete their purchase.
- Order Tags and Line Item Properties
This report includes order tags and line items for every order, along with key sales and product details, enabling thorough analysis and processing. You can apply product-specific customizations through line item properties, while order tags help categorize orders and spot trends based on types or special requests. As a result, you get clearer insights.
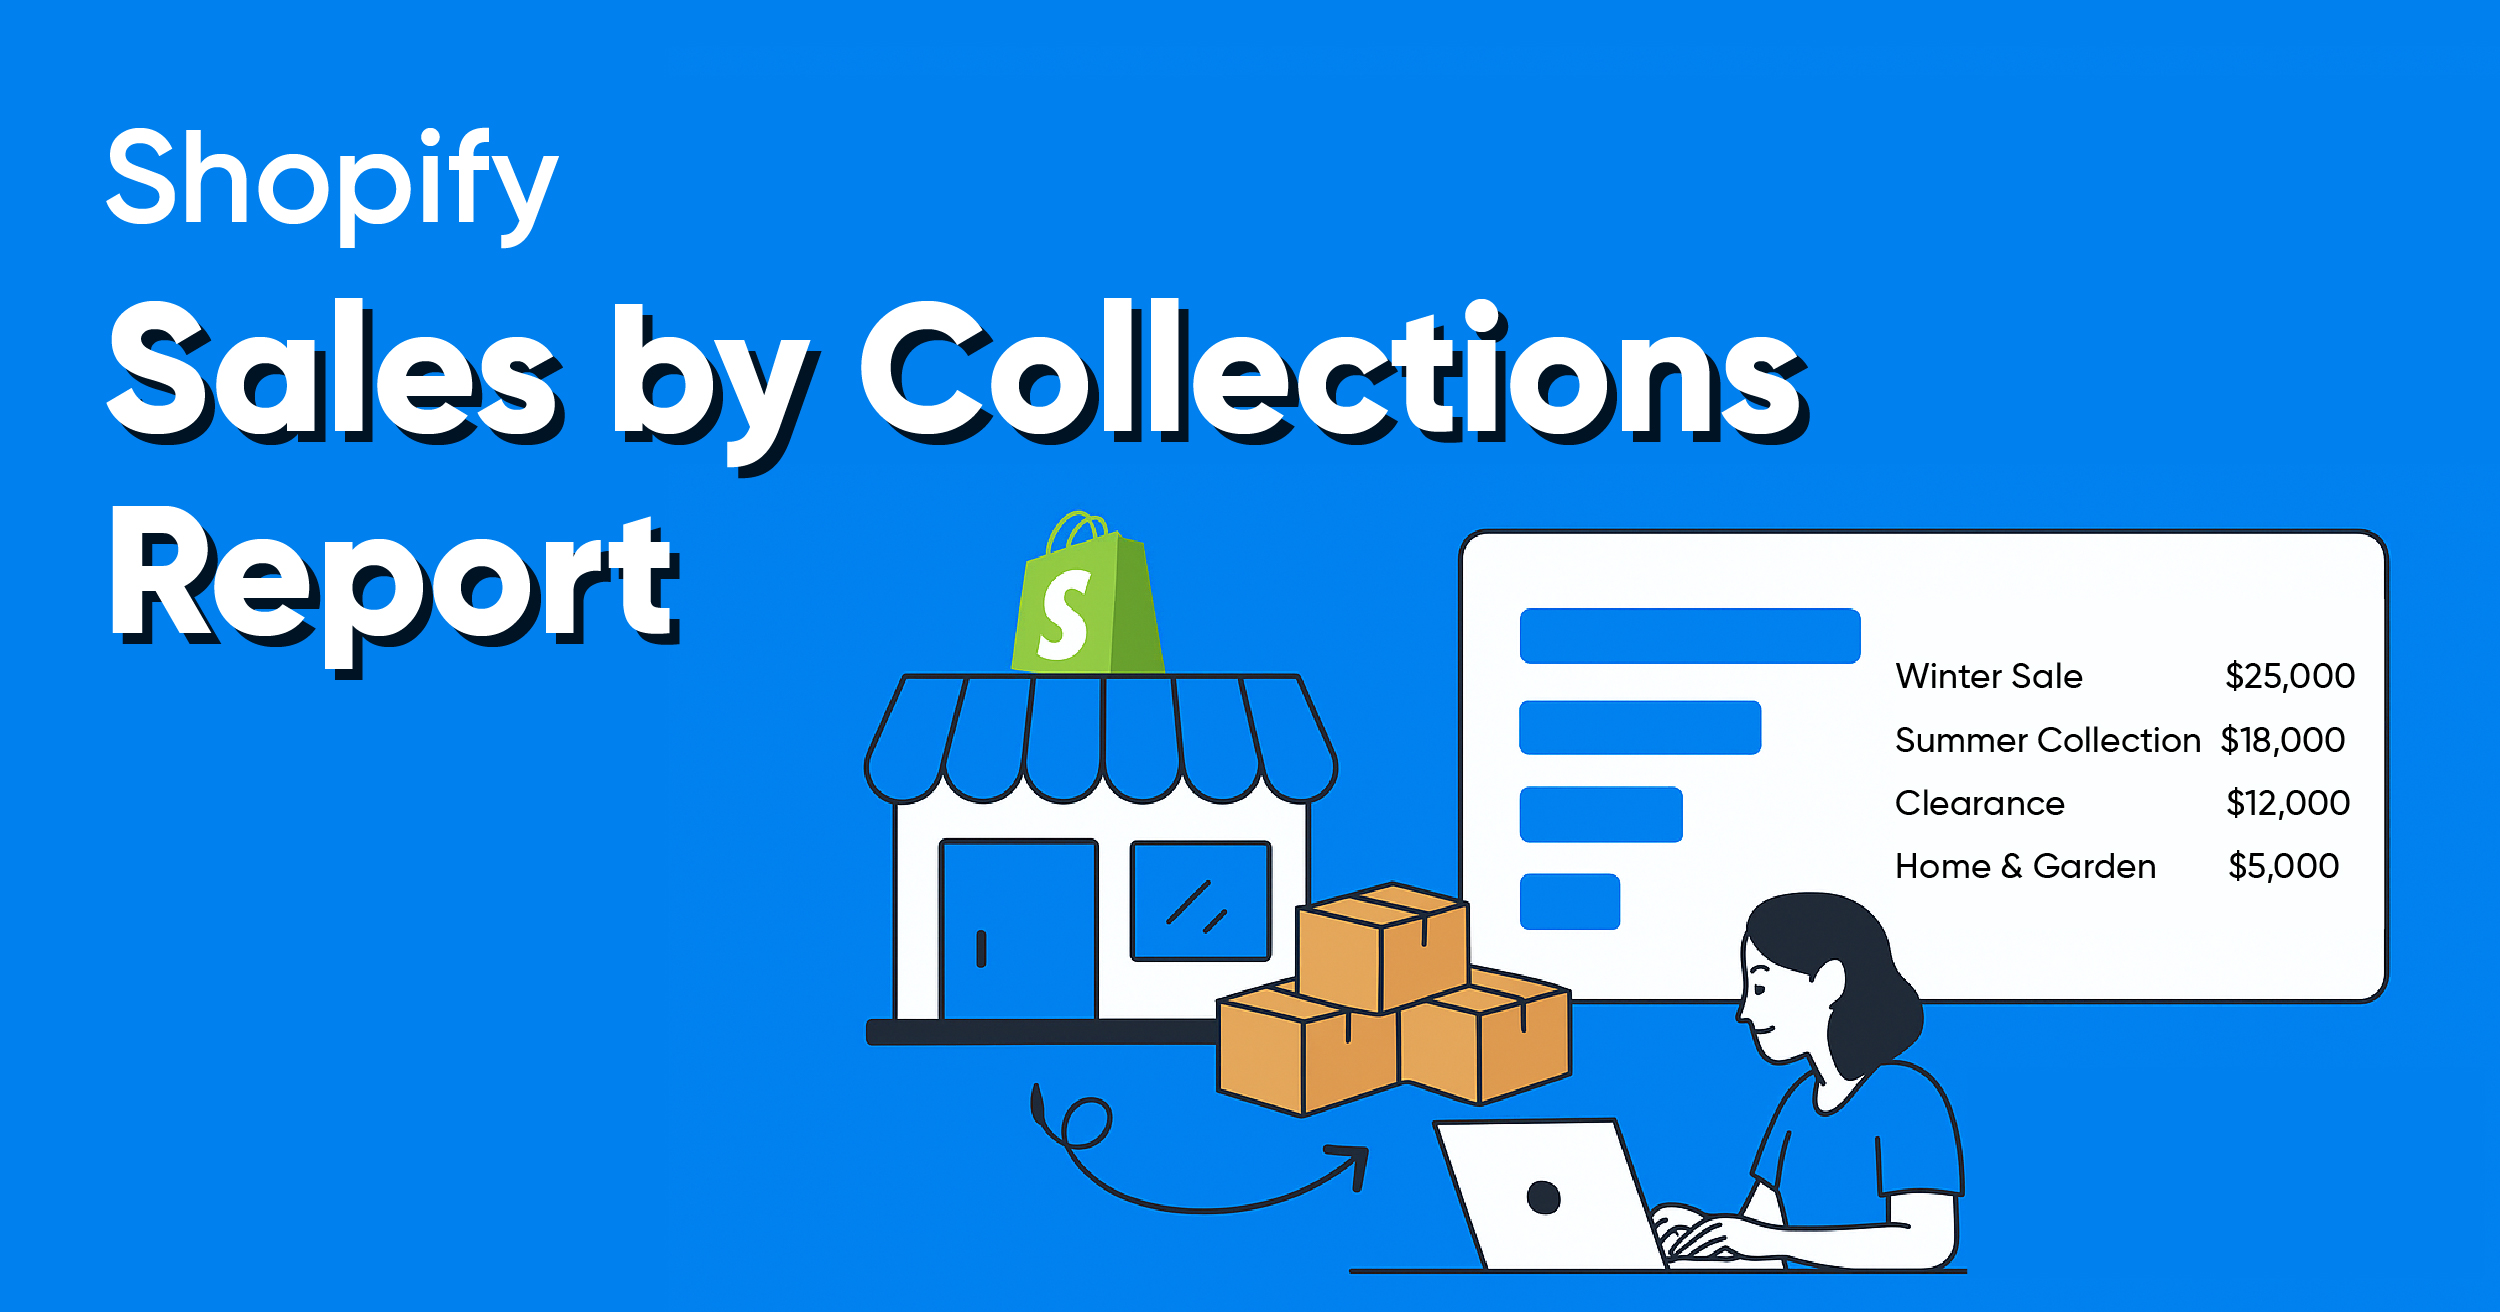
- Sales by Collections
The Sales by Collections report shows your product sales, product costs, and profitability by collection, helping you see which ones drive the most revenue. With this data, you can identify popular collections across customer demographics and locations, then adjust marketing and product strategies to boost sales and meet customer preferences.
- Sales Over Time
The Sales Over Time Report uses historical data to track costs, orders, sales channels, and payment methods. It helps you spot trends, manage sales tax returns, and evaluate channel performance.
With a clear view of total sales in a selected period, you can simplify tax compliance and ensure accurate reporting. You can also review sales, payments, and refunds in detail to analyze transactions, improve fulfillment, and enhance your store’s performance.
- Sales by Billing Location
The Sales by Billing Location report shows sales by customer billing address, categorized by country, region, or city. It helps you spot high-performing regions, guiding decisions on opening new stores. Moreover, by identifying areas with strong demand for specific products, you can manage inventory more effectively and ensure popular items are always available where they are needed most.
- Sales by Checkout Currency
The Sales by Checkout Currency report shows your sales by the currency customers use at checkout, along with order counts and total sales converted to your local currency. This helps you track international sales, understand currency trends, and plan pricing or promotions for different markets.
- Sales by Device ID
The report shows sales data by device type, such as mobile, desktop, or tablet, helping you spot trends and understand customer behavior. With these insights, you can improve your site or app for each device, enhance the user experience, and focus resources where they drive the most sales.
- Detailed Sales Report
This report displays each sale and return your store made during a selected time frame, organized by date. It breaks down orders into individual line items, including products and shipping charges, showing details such as gross sales, discounts, returns, net sales, shipping charges, taxes, and total sales.
This report helps you get a detailed view of your sales transactions for bookkeeping, tax reporting, and financial analysis.
- Order vs Return (Monthly)
The Orders vs Returns (Monthly) report in Report Pundit helps you compare the total number of orders placed against the number of returns processed each month. This report provides insights into your sales performance and return rates over time, allowing you to identify trends and make informed decisions about inventory and customer service.
- Sales by Fulfillment Location
The "Sales by Fulfillment Location" report provides insights into your sales performance based on the locations from which orders are fulfilled. This report helps you understand how different fulfillment locations contribute to your overall sales.
- Retail sales by staff attributed to the sale
The Retail sales by staff attributed to the sales report gives POS lets you track sales made by each staff member. This report is available only with the Shopify POS Pro plan. It shows which staff member handled a sale, either for the full order or for specific items within it. Sales attribution can be set up to happen automatically at checkout or entered manually.
This report is useful for monitoring staff performance and calculating commissions. You can also see staff attribution details in order records, as well as during exchanges and returns.
- Retail sales by staff at register (daily):
The Retail sales by staff at register (daily) report in Report Pundit POS shows the daily sales made by each staff member at your POS locations. This report is only available with the Shopify POS Pro plan. It includes details such as the date of sales, the staff member who processed the sale, the POS location where the sale took place, and the percentage of sales that had staff assigned to line items.
You can use this report to track daily staff performance and better understand sales attribution at your stores.
- Retail sales by staff at the Register
The Retail sales by staff at the register report in Report Pundit POS show the sales made by each staff member at your POS locations. This report is only available with the Shopify POS Pro plan. It includes details such as the staff member who processed the sale, the POS location where the sale occurred, and the percentage of sales that had staff assigned to line items.
- Payment outstanding
The Payment Outstanding Report shows how much money a customer still needs to pay for an order. This usually happens when the payment is due later, or when an order is marked as pending or overdue. In Shopify, you can handle these by setting payment terms, sending invoices, and keeping track of unpaid orders in your admin.
For example, a customer orders furniture worth $500 and agrees to pay later. They pay $200 upfront, leaving $300 unpaid. The Payment Outstanding Report will show that the customer still owes $300 for that order, so you can remind them or send an invoice.
- Payment Term
To view totals of all transactions by date, sales channel, and payment method, you usually need to compile two separate reports, which takes time to sort and analyze. Instead, our reporting app combines all this information in one report, saving time, simplifying analysis, and allowing automated email delivery for quick access whenever you need it.
- Payment Due on
The Payment Due On report shows the amount that customers owe for orders that have not yet been fully paid. This is relevant for orders with payment terms or deferred payments where the payment is scheduled to be made at a later date.
- Cogs Report
This report helps ensure prices cover production costs and stay competitive, and calculates gross profit margins by comparing revenue with direct costs. This helps you focus on top-performing products, discontinue low-margin items, and decide when to switch suppliers.
By understanding costs accurately, you avoid incorrect COGS reporting that can inflate profits and lead to poor decisions.
- Bundle Item Vs Non-bundle Item Sales
It can show how many bundles you sold, list their components with quantities, and track revenue from bundles compared to individual products. Moreover, it lets you compare performance across date ranges or sales channels, helping you see what sells best and optimize pricing.
- Deleted products in Order
Shopify excludes only deleted and test orders placed in test mode, so your reports stay clean and accurate. As a result, you can rely on the data for making decisions and tracking business performance.
If an order contains a deleted product, the product details are no longer available through the API or in reports. The only detail you can retrieve about the deleted product in the context of an order is the product ID. This means that while the order itself remains, information about the deleted product within that order is limited or unavailable.
Conclusion
Shopify’s Sales and Order Reports help store owners track revenue, discounts, taxes, and how orders are handled across products, customers, and sales channels. However, Report Pundit gives a wider range of options. It offers more than 120 ready-to-use reports that you can adjust, schedule, and share with ease. It also integrates with data from other apps, so you can manage performance in one place and make clear plans for your business.


.webp)
.webp)


Build and automate your Shopify Reporting
Unlock the full potential of your Shopify store with Report Pundit. Gain access to over 2000 data fields, automate reports, and make data-backed decisions to grow your business.