Last 24 Hours Orders Report for Shopify
Use the Last 24 Hours Orders report to stay updated on all orders placed within the past day. It provides critical insights into sales trends, customer transactions, and order statuses, allowing you to monitor your store's recent activity and make informed business decisions.


5 from 1,800+ merchants
2,000+ data fields
Trusted by 40,000+ Shopify stores
Updated June 2026
.png)
.png)

.svg)
.svg)
.svg)
Why this report matters
The first question most morning shifts ask is “what came in overnight?” Shopify’s admin answers it slowly: you click into Orders, eyeball a list, and lose the hourly shape entirely. When a flash sale or an influencer post lands at 2am, you find out when the warehouse is already behind.
A dedicated 24-hour view turns that scramble into a standing report. You see order count and revenue by hour, which channel drove them, and how many are still unfulfilled — the exact inputs a fulfillment lead needs before assigning the day.
Speed matters: 69% of shoppers expect delivery faster than retailers offer (McKinsey) [verify], and the gap starts at the picking table. Catching a 300-order overnight spike at 7am instead of 11am is four hours of head start on every promise you made at checkout.
What’s included
Order name / number
The Shopify order reference (e.g. #1042) used to find the order in admin.
Example: #1042, #1043 … sequential within your store.
Order date & time
The exact timestamp the order was placed, in your store time zone.
Heads up: The 24-hour window is anchored to your store time zone, not the buyer’s. Cross-time-zone stores should confirm the boundary before reconciling.
Hour bucket
The order grouped into its hour of placement, so you can see intraday peaks.
Example: A 2am–3am row of 84 orders flags an overnight campaign spike.
Who & where
Customer
The customer name or email attached to the order; blank for guest checkouts that withheld it.
Sales channel
Where the order originated — Online Store, Shopify POS, Draft, or a connected channel.
Example: Online Store vs Shopify POS vs Buy Button.
Location
The location assigned to fulfill the order, useful for multi-warehouse routing.
Money & status
Order total
The amount the customer paid, including shipping and tax.
Formula: Order total = Subtotal − Discounts + Shipping + Tax
Financial status
Paid, pending, partially paid, or refunded — so you don’t ship against an unpaid order.
Fulfillment status
Unfulfilled, partially fulfilled, or fulfilled — the column the warehouse sorts on.
Heads up: An order can be Paid but Unfulfilled; that pairing is exactly the queue your pickers work from.
Who uses this report
Fulfillment lead
Marketing manager
On-call founder
Customer support
How to read the report
- Read the hour buckets first. A flat line means steady demand; a single tall bar usually traces back to a campaign, a feature, or a bot — worth knowing which.
- Watch the Paid + Unfulfilled count. That number is your literal morning workload. If it’s climbing day over day, fulfillment capacity is the constraint, not demand.
- Scan financial status for pending clusters. A burst of pending payments at one hour often points to a gateway hiccup, not buyer hesitation.
- Compare channels within the window. If POS suddenly outpaces Online Store overnight, you’re probably looking at a time-zone artifact or a test order — verify before acting.
How to build the report in Report Pundit
- Install Report Pundit from the Shopify App Store and open the app inside your Shopify admin.
- Click Create Report (or open the pre-built “Last 24 Hours Orders” template from the Sales category).
- Set the data source to Orders.
- Add columns: Order name, Order created at, Customer, Sales channel, Location, Total, Financial status, Fulfillment status.
- Apply a date filter of “Last 24 hours” (rolling) so the window moves with each run.
- Add a grouping by Hour of “Order created at” to get the intraday breakdown.
- Optional: add a filter for Fulfillment status = Unfulfilled to make it a pure work queue.
- Click Run to preview, then Save the report.
- Open Schedule, set it to send at the start of your shift (e.g. 6:45am daily), and choose email, Slack, or Google Sheets as the destination.
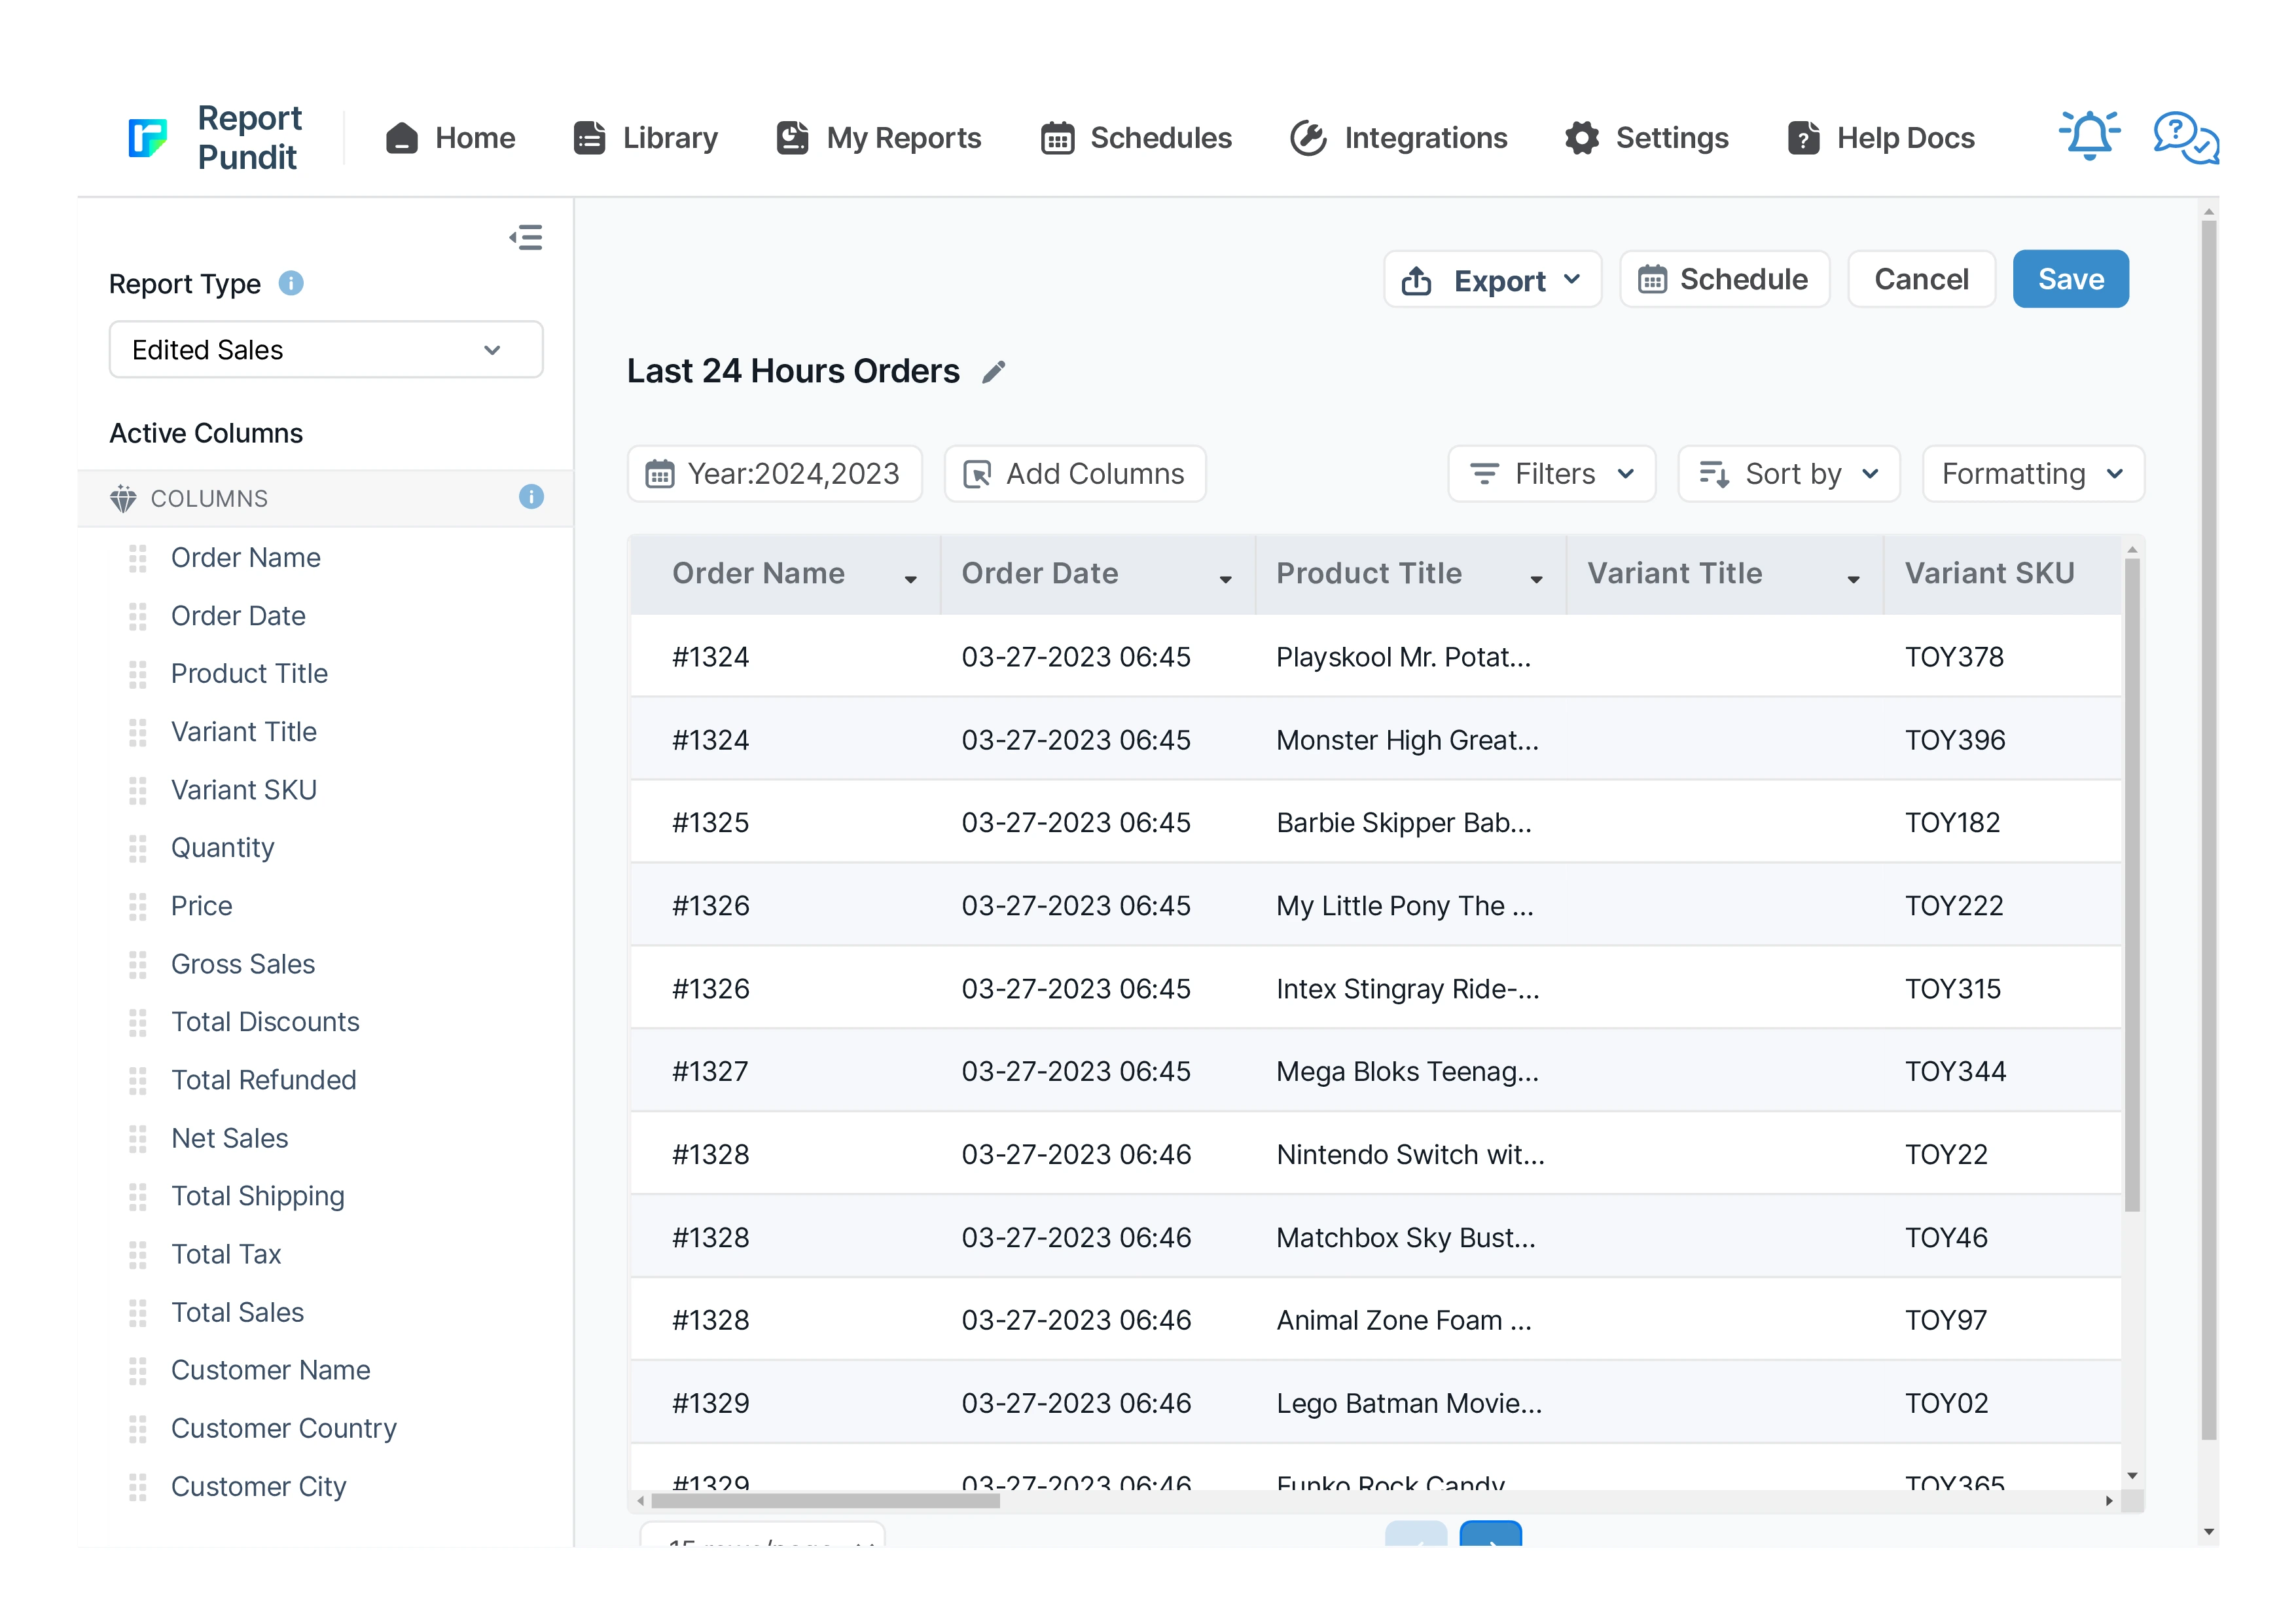
Sample report
Customization & filters
- Filter to a single sales channel (e.g. Online Store only) or a single location.
- Group by sales channel instead of hour to compare POS vs online overnight.
- Add a calculated column for items per order to spot bulk buyers.
- Narrow the window to the last 6 or 12 hours for a tighter operational view.
- Add Tags to isolate wholesale, subscription, or pre-order traffic.
Automate & export
- Schedules — hourly, daily, weekly, monthly, or custom cron
- Delivery formats — Excel, CSV, PDF, or push to Google Sheets in real time
- Group by month or week — trends instead of a static snapshot
- Destinations — email (multiple recipients), Google Sheets, Google Drive, FTP/SFTP, Looker Studio, BigQuery
- Conditional alerts — get notified only if a channel's net sales drop more than X% week-over-week
Report Pundit vs Shopify's native Sales by Channel report
Frequently Asked Questions
Shopify’s native Orders page shows a flat list you have to filter manually and can’t schedule. With Report Pundit you apply a rolling “Last 24 hours” date filter on the Orders source, group by hour, and save it as a standing report that refreshes on its own.
It refreshes on a near real-time basis (hourly or better) and re-pulls each time it runs or is scheduled. For a continuously updating screen you’d combine it with a scheduled Google Sheets export. [verify exact refresh interval against your plan]
Yes. Schedule the report to send at a fixed time — including multiple times a day — to email, Slack, FTP, Google Drive, Google Sheets, BigQuery, or Power BI.
Benefits

24-Hour Performance Overview
In-Depth Order Analysis
Customizable Insights
Related Reports
Sales Over Time
Leverage historical data with the Sales Over Time Report. This report covers costs, order details, sales channels, and payment methods, helping you track trends, manage sales tax returns, and assess the effectiveness of each sales channel.
Commission
The Commission Report is the key to rewarding store staff and affiliates for sales they generate. It provides an overview of their sales performance along with calculated commissions share.
Sales by POS
The report provides detailed sales figures and net product counts, accounting for refunds, at each POS location, offering a clear view of actual sales performance and inventory movement.
Order vs Return (Monthly)
A report interpreting monthly returns by comparing the total sales value with the sales value of returned orders, including percentage calculations for both return orders and return value.
Sales by Staff
A report designed for quick analysis of sales attributed to each staff member across all POS locations, with details from gross sales to net sales calculations.
Last 30 days Sales Summary
A report that provides a comprehensive overview of sales performance over the past 30 days, including total revenue, order count, average order value, and product-specific sales trends for detailed analysis.
Order Tags and Line Item Properties
A detailed report built to include order tags and line items added to each placed order, along with essential sales and product details for thorough analysis and processing.
Sales by Product
The Sales by Product report offers details about each product’s sales performance over a given time frame. It provides valuable insights into which of your products are and aren’t selling well. These insights will enable you to make informed decisions about inventory management and marketing and improve your business.
Sales by Billing Location
The Sales by Billing Location report in Shopify provides a detailed breakdown of sales based on the billing addresses of your customers. This report categorizes sales data of your customer base by country, region, or city.
Refund
Report Pundit’s Refund Report records the details of money returned by a Shopify merchant to unsatisfied customers when they return the product/service. These reports help the merchant keep track of the refunds issued, monitor customer satisfaction and have a proper record of financial transactions for filing taxes.
Sales by Collections
The Sales by Collections report provides a detailed view of your product sales, inventory costs, and profitability by collection, helping you see which collections drive revenue and how they resonate with your audience, allowing you to tailor your product strategies accordingly.
Sales by Vendor
The Sales by Vendor report analyzes how each vendor's products contribute to your store's success. By examining sales, purchase costs, and profitability, this report provides insights to make strategic decisions, maximize profits, and optimize inventory management based on vendor performance.
Sales by Checkout Currency
This report displays the breakdown of your sales by customer currency used at the checkout with the total sales value also being displayed in your local currency.
Completed Draft Order
This report provides insights into finalized draft orders, displaying detailed information on converted orders, including product details, pricing, and customer data for analysis.
Sales by Fulfillment Location
Data reported to analyze sales based on order fulfillment locations for any specified date range, including product quantity sold and corresponding sales value.
Sales by Device ID
The report displays sales data segmented by device type, such as mobile, desktop, or tablet, allowing merchants to analyze performance based on customer device usage.
Sales by Discount Code
Sales by Discount Code report in Report Pundit provides a detailed analysis of sales generated through specific discount codes over a defined period.
Sales by Variant
Gain detailed insights into each product variant's performance with the Sales by Variant Report. Beyond basic sales data, it shows how each variant impacts your store's success. Use it to fine-tune inventory management and identify popular options, helping you make strategic decisions to boost your bottom line.
Sales by Customer
The Sales by Customer Report provides Shopify merchants with valuable insights into customer purchasing behavior. This report breaks down sales by individual customers, highlighting the most valuable and active customers.
Sales by Channel
The Sales by Channel report displays sales data based on the source of each sale. It's a valuable report offering insights into multichannel Shopify selling.
Finance Summary
The Finance Summary Report provides an overview of your store’s financial performance by aggregating key revenue, expense, and tax data. This report helps store owners understand their overall profitability, cash flow, and key cost drivers, making it essential for budgeting and financial planning

Build and automate your Shopify Reporting
Unlock the full potential of your Shopify store with Report Pundit. Gain access to over 2000 data fields, automate reports, and make data-backed decisions to grow your business.