Sales by Vendor Report for Shopify
The Sales by Vendor report analyzes how each vendor's products contribute to your store's success. By examining sales, purchase costs, and profitability, this report provides insights to make strategic decisions, maximize profits, and optimize inventory management based on vendor performance.


5 from 1,800+ merchants
2,000+ data fields
Trusted by 40,000+ Shopify stores
Updated June 2026
.png)
.png)

.svg)
.svg)
.svg)
Why this report matters
Vendor relationships run on leverage, and leverage runs on data. Walking into a renewal knowing a supplier drives 22% of your net sales — and that their return rate is double the catalog average — changes the conversation entirely.
Shopify stores the vendor field but does little with it: there’s no native, exportable, schedulable vendor performance report on lower plans. Most buyers reconstruct it by hand once a year, right before they need it.
Grouping sales by vendor turns the Vendor field you already maintain into a scorecard: who drives revenue, who carries the returns, and whose share is rising or fading. It’s also the cleanest way to spot over-reliance on a single supplier before it becomes a risk.
What’s included
Identification
Vendor
The vendor/supplier assigned to the product in Shopify.
Heads up: Vendor reporting is only as clean as the field itself — inconsistent spellings (“Nike” vs “NIKE”) split a vendor into two rows. Normalize the field for accurate totals.
Products / SKUs
Count of distinct products or variants attributed to the vendor.
Revenue
Units sold
Total quantity sold across the vendor’s products in the period.
Gross & net sales
Vendor revenue before and after discounts and returns.
Formula: Net sales = Gross − Discounts − Returns
Vendor share of mix
The vendor’s percentage of total net sales — your concentration read.
Formula: Vendor share = Vendor net sales ÷ Total net sales × 100
Example: One vendor at 22% of net sales is a relationship worth protecting — and a risk worth diversifying.
Average order value (by vendor)
AOV for orders containing the vendor’s products.
Formula: AOV = Vendor-attributed sales ÷ Orders
Heads up: Orders often contain multiple vendors; how mixed-cart sales are attributed affects this figure — keep the method consistent.
Quality & trend
Refunds / returns by vendor
Returned value and rate for the vendor’s products.
Formula: Return rate = Returned units ÷ Units sold × 100
Period-over-period change
Whether the vendor’s revenue and share are rising or falling.
Formula: Change % = (This period − Last period) ÷ Last period × 100
Who uses this report
Buyer
Category manager
Owner
Finance
How to read the report
- Lead with share of mix. Absolute revenue is the headline; share of mix is the strategy — it tells you where you’re concentrated and exposed.
- Put return rate next to revenue. A top vendor with an above-average return rate isn’t as profitable as the sales line suggests.
- Read the trend, not just the rank. A mid-size vendor growing 30% quarter over quarter deserves more attention than a flat #1.
- Clean the vendor field first. Split spellings inflate vendor count and understate the leaders; normalize before you draw conclusions.
How to build the report in Report Pundit
- Open Report Pundit in your Shopify admin and choose Create Report (or the pre-built “Sales by Vendor” template).
- Set the data source to Sales / Order line items.
- Group the report by Vendor.
- Add columns: Units sold, Gross sales, Discounts, Returns, Net sales, Orders.
- Add a calculated Vendor share column (vendor net sales ÷ total net sales) and an AOV column.
- Add a Return rate column (returned units ÷ units sold).
- Set your date range and add a prior-period comparison for the trend column.
- Run, confirm vendor names aren’t split by spelling, and Save.
- Schedule a monthly send to buying and finance, or export to a shared Google Sheet ahead of renewals.
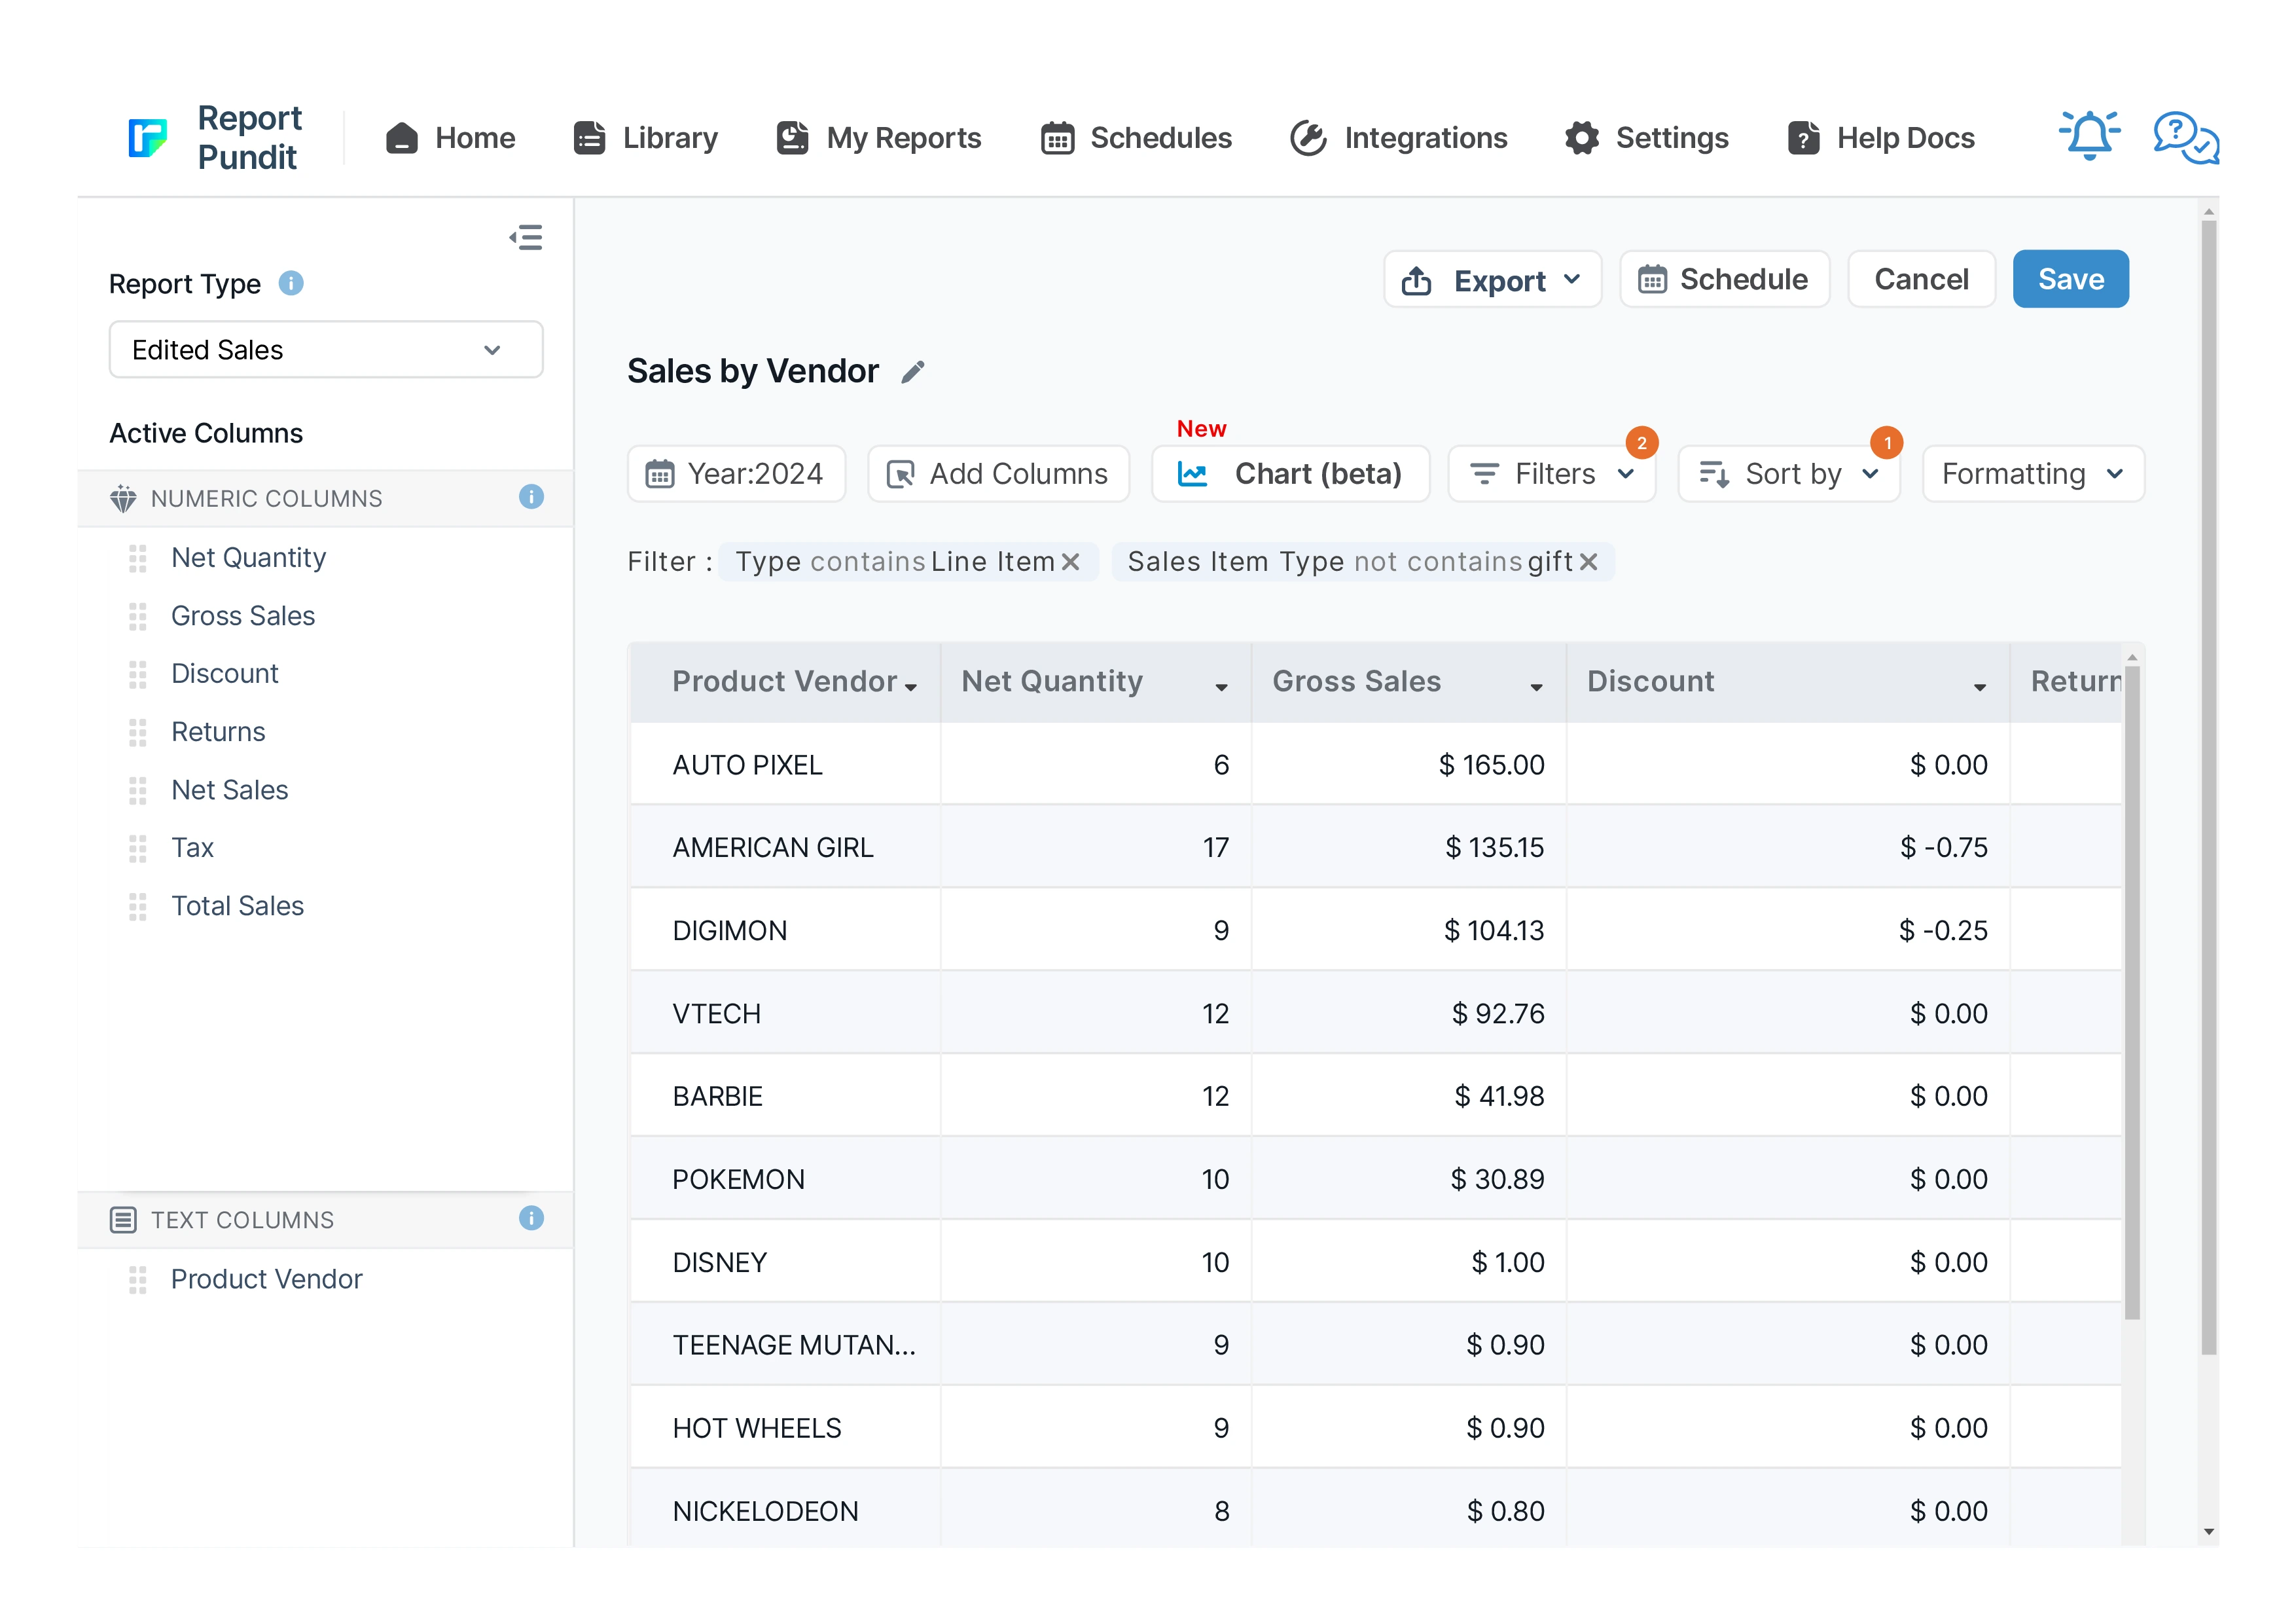
Sample report
Customization & filters
- Group by vendor then product type for a two-level category view.
- Filter to a single channel, location, or collection.
- Add a gross-margin-by-vendor column where product cost is set.
- Compare two periods to surface rising and fading vendors.
- Normalize vendor names with a calculated/standardized field before grouping.
Automate & export
- Schedules — hourly, daily, weekly, monthly, or custom cron
- Delivery formats — Excel, CSV, PDF, or push to Google Sheets in real time
- Group by month or week — trends instead of a static snapshot
- Destinations — email (multiple recipients), Google Sheets, Google Drive, FTP/SFTP, Looker Studio, BigQuery
- Conditional alerts — get notified only if a channel's net sales drop more than X% week-over-week
Report Pundit vs Shopify's native Sales by Channel report
Frequently Asked Questions
From the Vendor field on each product in Shopify. The report is only as accurate as that field, so normalize inconsistent spellings before relying on the totals.
Yes. A calculated share column (vendor net sales ÷ total net sales) shows concentration — useful for both negotiation leverage and spotting over-reliance on one supplier.
Orders often contain products from several vendors. The report attributes sales to each vendor’s lines; because attribution method affects vendor AOV, keep it consistent across periods.
Benefits

Vendor Product Performance
Vendor Profit Margin
Optimized Reordering and Stock Management
Related Reports
Sales by Product
The Sales by Product report offers details about each product’s sales performance over a given time frame. It provides valuable insights into which of your products are and aren’t selling well. These insights will enable you to make informed decisions about inventory management and marketing and improve your business.
Commission
The Commission Report is the key to rewarding store staff and affiliates for sales they generate. It provides an overview of their sales performance along with calculated commissions share.
Sales by Fulfillment Location
Data reported to analyze sales based on order fulfillment locations for any specified date range, including product quantity sold and corresponding sales value.
Refund
Report Pundit’s Refund Report records the details of money returned by a Shopify merchant to unsatisfied customers when they return the product/service. These reports help the merchant keep track of the refunds issued, monitor customer satisfaction and have a proper record of financial transactions for filing taxes.
Sales by Variant
Gain detailed insights into each product variant's performance with the Sales by Variant Report. Beyond basic sales data, it shows how each variant impacts your store's success. Use it to fine-tune inventory management and identify popular options, helping you make strategic decisions to boost your bottom line.
Finance Summary
The Finance Summary Report provides an overview of your store’s financial performance by aggregating key revenue, expense, and tax data. This report helps store owners understand their overall profitability, cash flow, and key cost drivers, making it essential for budgeting and financial planning
Sales by Collections
The Sales by Collections report provides a detailed view of your product sales, inventory costs, and profitability by collection, helping you see which collections drive revenue and how they resonate with your audience, allowing you to tailor your product strategies accordingly.
Completed Draft Order
This report provides insights into finalized draft orders, displaying detailed information on converted orders, including product details, pricing, and customer data for analysis.
Sales by Channel
The Sales by Channel report displays sales data based on the source of each sale. It's a valuable report offering insights into multichannel Shopify selling.
Order vs Return (Monthly)
A report interpreting monthly returns by comparing the total sales value with the sales value of returned orders, including percentage calculations for both return orders and return value.
Sales by Staff
A report designed for quick analysis of sales attributed to each staff member across all POS locations, with details from gross sales to net sales calculations.
Sales by Billing Location
The Sales by Billing Location report in Shopify provides a detailed breakdown of sales based on the billing addresses of your customers. This report categorizes sales data of your customer base by country, region, or city.
Order Tags and Line Item Properties
A detailed report built to include order tags and line items added to each placed order, along with essential sales and product details for thorough analysis and processing.
Last 24 Hours Orders
Use the Last 24 Hours Orders report to stay updated on all orders placed within the past day. It provides critical insights into sales trends, customer transactions, and order statuses, allowing you to monitor your store's recent activity and make informed business decisions.
Sales Over Time
Leverage historical data with the Sales Over Time Report. This report covers costs, order details, sales channels, and payment methods, helping you track trends, manage sales tax returns, and assess the effectiveness of each sales channel.
Sales by Checkout Currency
This report displays the breakdown of your sales by customer currency used at the checkout with the total sales value also being displayed in your local currency.
Sales by Customer
The Sales by Customer Report provides Shopify merchants with valuable insights into customer purchasing behavior. This report breaks down sales by individual customers, highlighting the most valuable and active customers.
Sales by Discount Code
Sales by Discount Code report in Report Pundit provides a detailed analysis of sales generated through specific discount codes over a defined period.
Last 30 days Sales Summary
A report that provides a comprehensive overview of sales performance over the past 30 days, including total revenue, order count, average order value, and product-specific sales trends for detailed analysis.

Build and automate your Shopify Reporting
Unlock the full potential of your Shopify store with Report Pundit. Gain access to over 2000 data fields, automate reports, and make data-backed decisions to grow your business.