Finance Summary Report for Shopify
The Finance Summary Report provides an overview of your store’s financial performance by aggregating key revenue, expense, and tax data. This report helps store owners understand their overall profitability, cash flow, and key cost drivers, making it essential for budgeting and financial planning


5 from 1,800+ merchants
2,000+ data fields
Trusted by 40,000+ Shopify stores
Updated June 2026
.png)
.png)

.svg)
.svg)
.svg)
Why this report matters
Month-end close shouldn’t start with five CSV exports. Yet that’s how most stores reconcile: one file for sales, one for taxes, one for refunds, and a manual stitch to get a single defensible revenue figure.
Shopify’s finance reports are useful but partial — tax detail and year-over-year comparison get thin on lower plans, and nothing schedules itself for the close. Your accountant ends up asking for the same breakdown every month.
A single finance summary that walks gross → discounts → returns → net → shipping → tax, split by region and comparable year over year, turns the close from an afternoon into a review. This is reporting, not advice — always confirm figures with your accountant before filing.
What’s included
Revenue reconciliation
Gross sales
Product revenue before discounts, returns, shipping, and tax.
Formula: Gross sales = Σ (unit price × quantity)
Discounts
Total discounts applied in the period.
Returns / refunds
Value refunded in the period, reducing revenue.
Heads up: Refunds are recognized on the refund date, not the original order date — this can shift a figure across a period boundary.
Net sales
Revenue after discounts and returns.
Formula: Net sales = Gross sales − Discounts − Returns
Total sales
Net sales plus shipping and tax — the top-line booked figure.
Formula: Total sales = Net sales + Shipping + Tax
Tax & shipping
Tax collected by region
Tax broken out by jurisdiction (country/state), the view filing needs.
Example: CA $1,240 · NY $980 · TX $610 for the month.
Shipping charged
Shipping revenue collected from customers.
Shipping cost
What fulfillment actually cost, where available.
Heads up: Shipping cost only appears if you feed it in — via a carrier/3PL integration or a calculated column; Shopify doesn’t store your true cost natively. [verify]
Comparison
Net payments
Amounts settled to you after gateway activity, useful for matching payouts.
Heads up: Processor fees and payout timing vary by gateway; reconcile against your payout report, not just this summary.
Year-over-year
The same period last year beside this year, with the delta.
Formula: YoY % = (This year − Last year) ÷ Last year × 100
Who uses this report
Bookkeeper
Owner
Accountant / advisor
Finance analyst
How to read the report
- Walk the build-up top to bottom. Gross, then discounts, then returns, then net. If net looks off, the leak is almost always in discounts or refunds.
- Separate shipping revenue from shipping cost. Charging $6 and paying $9 to ship is a quiet margin drain that only shows when you put the two side by side.
- Read tax by region, never in aggregate. Filing is per jurisdiction; an aggregate tax number is useless at close.
- Trust payouts over gross for cash. Net payments after fees is what actually lands in the bank — reconcile to it.
How to build the report in Report Pundit
- Open Report Pundit in your Shopify admin and choose Create Report (or the pre-built “Finance Summary” template).
- Set the data source to Sales / Finance.
- Add the revenue build-up columns: Gross sales, Discounts, Returns, Net sales, Shipping, Tax, Total sales.
- Add a Tax-by-region grouping (country/state) so jurisdictions break out.
- Add Refunds and, if you have it, a Shipping-cost column (from a 3PL/carrier integration or a calculated field).
- Set the date range to the calendar month (or quarter) you’re closing.
- Add a prior-year comparison for the same range to populate the YoY column.
- Run, reconcile net sales and tax against a known figure, and Save.
- Schedule it to send on your close date to finance and your accountant via email or a shared Google Sheet.
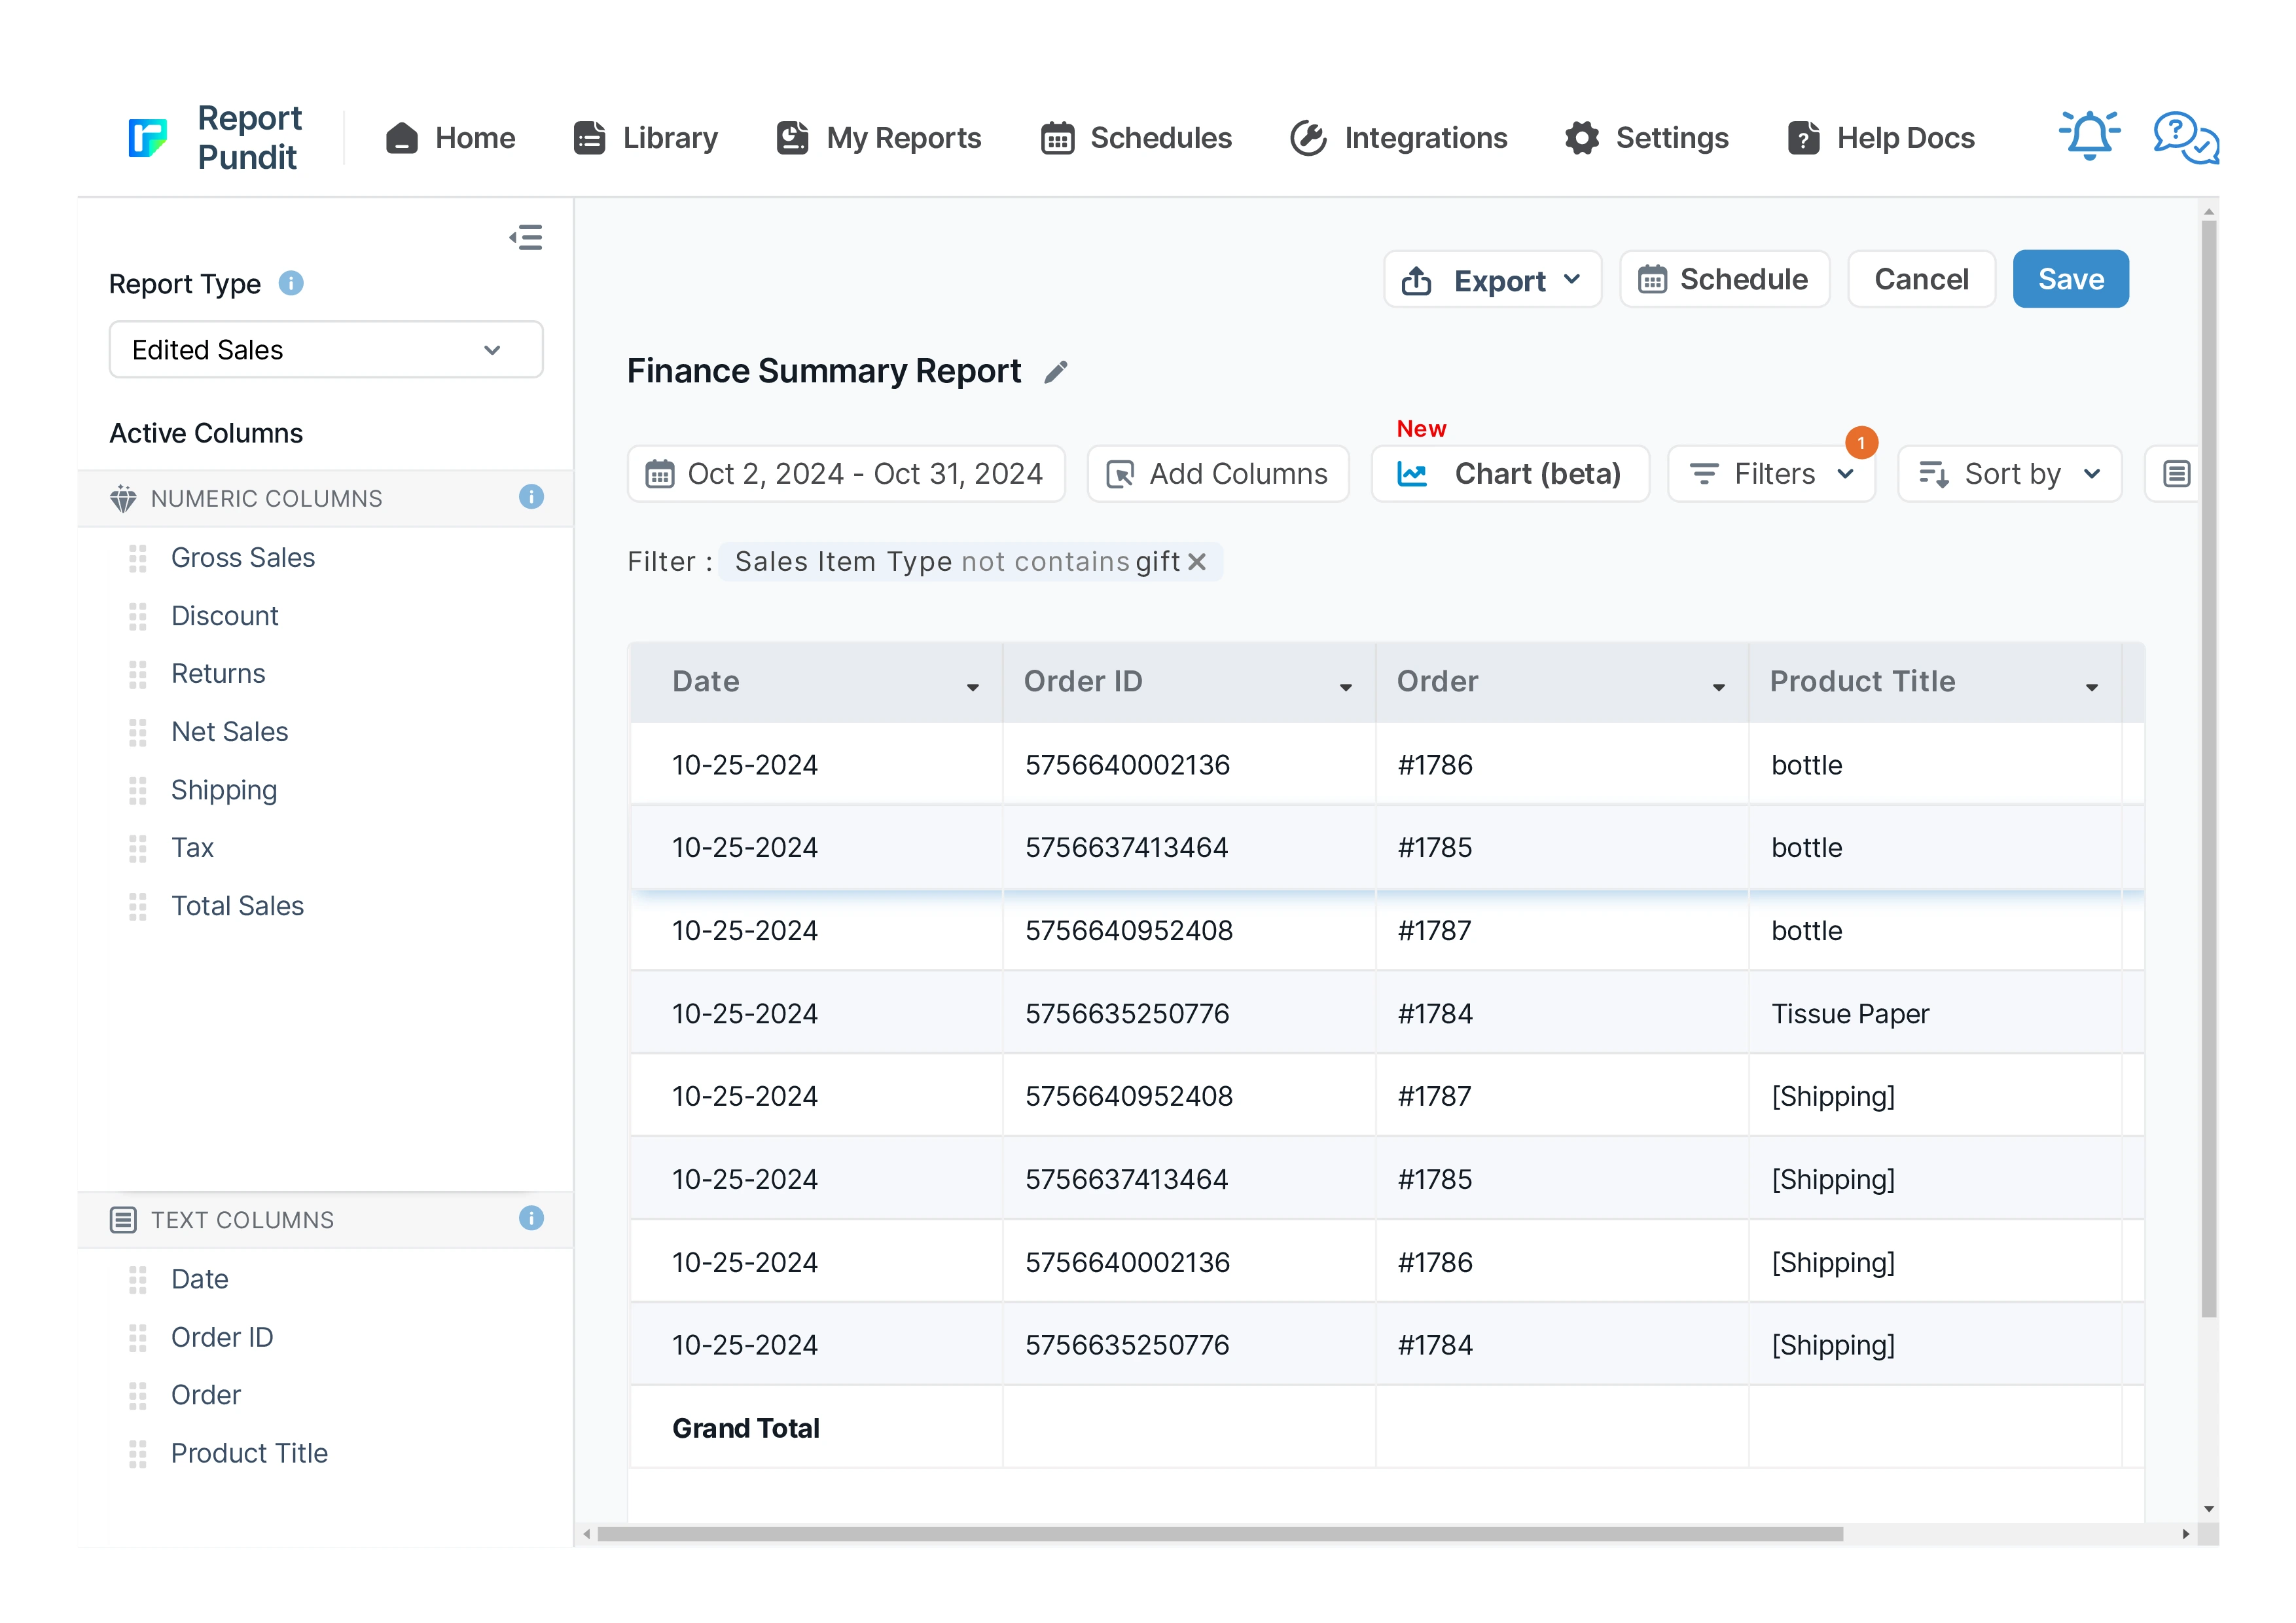
Sample report
Customization & filters
- Switch between monthly, quarterly, and annual close periods.
- Group tax by country, state/province, or both.
- Add a calculated gross-margin line if product cost is set in Shopify.
- Filter to a single channel or location for entity-level reporting.
- Convert multi-currency stores to a single reporting currency.
Automate & export
- Schedules — hourly, daily, weekly, monthly, or custom cron
- Delivery formats — Excel, CSV, PDF, or push to Google Sheets in real time
- Group by month or week — trends instead of a static snapshot
- Destinations — email (multiple recipients), Google Sheets, Google Drive, FTP/SFTP, Looker Studio, BigQuery
- Conditional alerts — get notified only if a channel's net sales drop more than X% week-over-week
Report Pundit vs Shopify's native Sales by Channel report
Frequently Asked Questions
Net sales is gross minus discounts and returns. Total sales adds shipping and tax on top. Net sales is the revenue figure; total sales is what was booked including pass-through amounts.
Yes. Group tax by jurisdiction to get the per-region breakdown filing requires, instead of a single aggregate number.
It shows shipping charged natively. True shipping cost only appears if you feed it in through a carrier/3PL integration or a calculated column, since Shopify doesn’t store your real cost.
Benefits

Net Profit
Sales Performance
Areas of Cost
Related Reports
Sales Over Time
Leverage historical data with the Sales Over Time Report. This report covers costs, order details, sales channels, and payment methods, helping you track trends, manage sales tax returns, and assess the effectiveness of each sales channel.
Sales by Checkout Currency
This report displays the breakdown of your sales by customer currency used at the checkout with the total sales value also being displayed in your local currency.
Sales by Product
The Sales by Product report offers details about each product’s sales performance over a given time frame. It provides valuable insights into which of your products are and aren’t selling well. These insights will enable you to make informed decisions about inventory management and marketing and improve your business.
Sales by Channel
The Sales by Channel report displays sales data based on the source of each sale. It's a valuable report offering insights into multichannel Shopify selling.
Sales by Discount Code
Sales by Discount Code report in Report Pundit provides a detailed analysis of sales generated through specific discount codes over a defined period.
Refund
Report Pundit’s Refund Report records the details of money returned by a Shopify merchant to unsatisfied customers when they return the product/service. These reports help the merchant keep track of the refunds issued, monitor customer satisfaction and have a proper record of financial transactions for filing taxes.
Order Tags and Line Item Properties
A detailed report built to include order tags and line items added to each placed order, along with essential sales and product details for thorough analysis and processing.
Sales by POS
The report provides detailed sales figures and net product counts, accounting for refunds, at each POS location, offering a clear view of actual sales performance and inventory movement.
Last 24 Hours Orders
Use the Last 24 Hours Orders report to stay updated on all orders placed within the past day. It provides critical insights into sales trends, customer transactions, and order statuses, allowing you to monitor your store's recent activity and make informed business decisions.
Order vs Return (Monthly)
A report interpreting monthly returns by comparing the total sales value with the sales value of returned orders, including percentage calculations for both return orders and return value.
Sales by Staff
A report designed for quick analysis of sales attributed to each staff member across all POS locations, with details from gross sales to net sales calculations.
Detailed Sales
The full-detail sales export — every line with channel, payment, tax, cost, and margin — built for deep analysis and your data warehouse.
Sales by Customer
The Sales by Customer Report provides Shopify merchants with valuable insights into customer purchasing behavior. This report breaks down sales by individual customers, highlighting the most valuable and active customers.
Weekly Sales Pattern
Your true day-of-week rhythm — which days and hours actually sell — so you staff, schedule ads, and send emails when buyers are buying.
Sales by Variant
Gain detailed insights into each product variant's performance with the Sales by Variant Report. Beyond basic sales data, it shows how each variant impacts your store's success. Use it to fine-tune inventory management and identify popular options, helping you make strategic decisions to boost your bottom line.
Sales by Vendor
The Sales by Vendor report analyzes how each vendor's products contribute to your store's success. By examining sales, purchase costs, and profitability, this report provides insights to make strategic decisions, maximize profits, and optimize inventory management based on vendor performance.
Completed Draft Order
This report provides insights into finalized draft orders, displaying detailed information on converted orders, including product details, pricing, and customer data for analysis.
Last 30 days Sales Summary
A report that provides a comprehensive overview of sales performance over the past 30 days, including total revenue, order count, average order value, and product-specific sales trends for detailed analysis.
Sales by Device ID
The report displays sales data segmented by device type, such as mobile, desktop, or tablet, allowing merchants to analyze performance based on customer device usage.
Sales by Collections
The Sales by Collections report provides a detailed view of your product sales, inventory costs, and profitability by collection, helping you see which collections drive revenue and how they resonate with your audience, allowing you to tailor your product strategies accordingly.
Commission
The Commission Report is the key to rewarding store staff and affiliates for sales they generate. It provides an overview of their sales performance along with calculated commissions share.

Build and automate your Shopify Reporting
Unlock the full potential of your Shopify store with Report Pundit. Gain access to over 2000 data fields, automate reports, and make data-backed decisions to grow your business.