Sales Over Time Report for Shopify
Leverage historical data with the Sales Over Time Report. This report covers costs, order details, sales channels, and payment methods, helping you track trends, manage sales tax returns, and assess the effectiveness of each sales channel.


5 from 1,800+ merchants
2,000+ data fields
Trusted by 40,000+ Shopify stores
Updated June 2026
.png)
.png)

.svg)
.svg)
.svg)
Why this report matters
A single period’s total tells you what happened; the trend tells you what’s happening. Seasonality, momentum, the dip after a promo ends — none of it shows in a snapshot, all of it shows in a time series.
Shopify has a Sales over time report, but it’s gated on lower plans, can’t be scheduled, and caps historical data at about 13 months. For year-over-year planning, that cap is exactly the data you need and can’t reach.
Plotting revenue, orders, and AOV by day, week, or month — with channel and payment context — turns raw sales into a planning input. Keeping more than 13 months of history is what makes a real year-over-year and seasonality read possible.
What’s included
Time grain
Period (day / week / month)
The time bucket the row represents — your chosen grain.
Heads up: Match the grain to the question: daily for campaign reaction, monthly for seasonality. Too fine a grain hides the trend in noise.
Core metrics
Orders
Order count in the period — the demand line.
Gross & net sales
Revenue before and after discounts and returns, per period.
Formula: Net sales = Gross − Discounts − Returns
Average order value
How basket size moves over time, independent of volume.
Formula: AOV = Net sales ÷ Orders
Units
Items sold per period, for a volume read alongside revenue.
Context splits
By sales channel
The trend split across Online Store, POS, and connected channels.
Example: POS climbs every December while online holds — a seasonality pattern worth staffing for.
By payment method
How tender mix (card, PayPal, gift card, etc.) shifts over time.
Heads up: Payment-method detail depends on your gateways and connected apps being reported through Report Pundit.
Who uses this report
Owner
Finance / planning
Marketing
Ops
How to read the report
- Pick the grain for the question. Daily reveals campaign reaction; monthly reveals seasonality. The wrong grain either buries the signal or invents one.
- Read AOV and volume as separate lines. Revenue can rise on bigger baskets or more orders — the levers differ, so watch them apart.
- Compare like periods. Hold the window steady (this Dec vs last Dec) so seasonality doesn’t masquerade as growth or decline.
- Mind the post-promo dip. A spike usually borrows from the following weeks; judge a campaign on the net over the whole window.
How to build the report in Report Pundit
- Open Report Pundit in your Shopify admin and choose Create Report (or the pre-built “Sales Over Time” template).
- Set the data source to Sales / Orders.
- Group by your chosen time grain — day, week, or month.
- Add columns: Orders, Units, Gross sales, Discounts, Returns, Net sales.
- Add a calculated AOV column (net sales ÷ orders).
- Add a secondary grouping by Sales channel or Payment method for the context split.
- Set a date range that goes beyond 13 months if you need year-over-year history.
- Run, eyeball the trend for any gaps, and Save.
- Schedule a weekly or monthly send to leadership, or export to Google Sheets to chart the series.
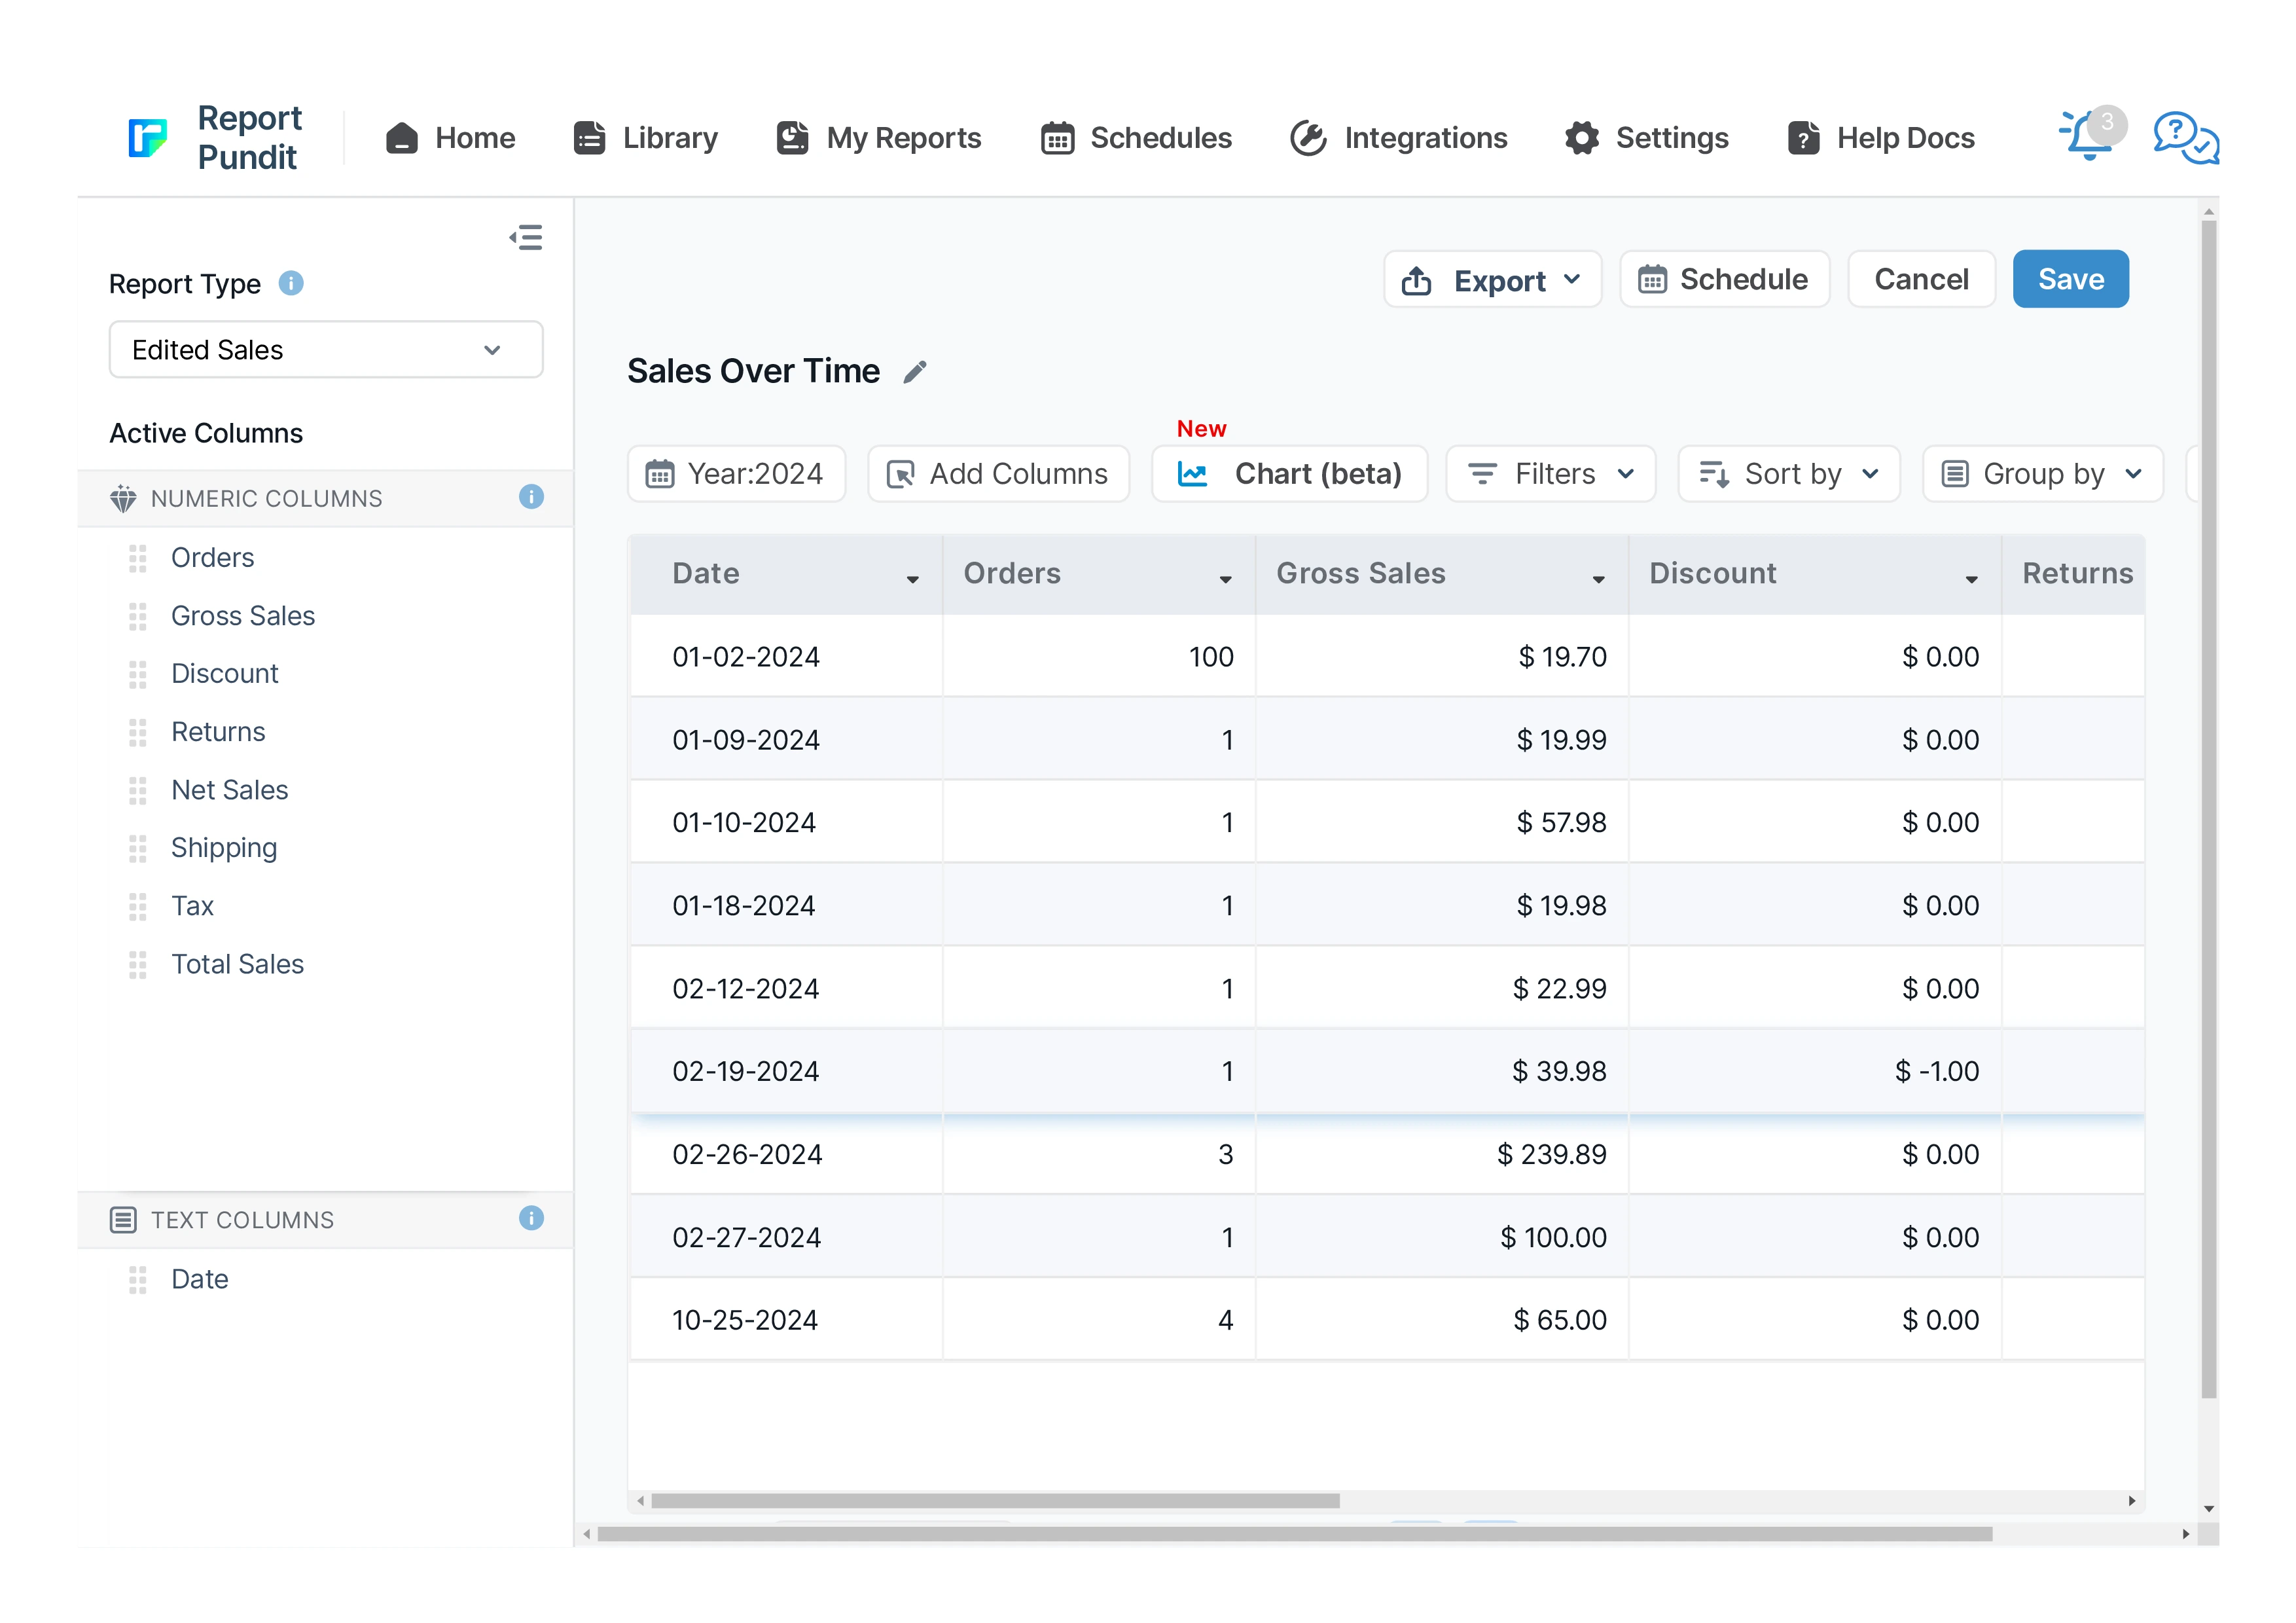
Sample report
Customization & filters
- Switch the grain between day, week, month, quarter, or year.
- Overlay a prior-year series for year-over-year.
- Split by channel, payment method, location, or product type.
- Add a moving-average or growth-% calculated column.
- Extend the window past 13 months for long-range history.
Automate & export
- Schedules — hourly, daily, weekly, monthly, or custom cron
- Delivery formats — Excel, CSV, PDF, or push to Google Sheets in real time
- Group by month or week — trends instead of a static snapshot
- Destinations — email (multiple recipients), Google Sheets, Google Drive, FTP/SFTP, Looker Studio, BigQuery
- Conditional alerts — get notified only if a channel's net sales drop more than X% week-over-week
Report Pundit vs Shopify's native Sales by Channel report
Frequently Asked Questions
Yes. Shopify’s native reporting caps historical data at about 13 months; Report Pundit can report beyond that, which is what makes a real year-over-year and seasonality view possible.
Day, week, month, quarter, or year. Match the grain to the question — daily for campaign reaction, monthly for seasonality.
Yes — overlay a prior-year series for the same periods. Native year-over-year is gated to higher Shopify plans; Report Pundit does it on any plan.
Benefits

Track Sales Trends
Streamline Tax Filing
Complete Transaction Analysis
Related Reports
Sales by Channel
The Sales by Channel report displays sales data based on the source of each sale. It's a valuable report offering insights into multichannel Shopify selling.
Sales by Customer
The Sales by Customer Report provides Shopify merchants with valuable insights into customer purchasing behavior. This report breaks down sales by individual customers, highlighting the most valuable and active customers.
Sales by Product
The Sales by Product report offers details about each product’s sales performance over a given time frame. It provides valuable insights into which of your products are and aren’t selling well. These insights will enable you to make informed decisions about inventory management and marketing and improve your business.
Commission
The Commission Report is the key to rewarding store staff and affiliates for sales they generate. It provides an overview of their sales performance along with calculated commissions share.
Completed Draft Order
This report provides insights into finalized draft orders, displaying detailed information on converted orders, including product details, pricing, and customer data for analysis.
Sales by Device ID
The report displays sales data segmented by device type, such as mobile, desktop, or tablet, allowing merchants to analyze performance based on customer device usage.
Order vs Return (Monthly)
A report interpreting monthly returns by comparing the total sales value with the sales value of returned orders, including percentage calculations for both return orders and return value.
Sales by Billing Location
The Sales by Billing Location report in Shopify provides a detailed breakdown of sales based on the billing addresses of your customers. This report categorizes sales data of your customer base by country, region, or city.
Refund
Report Pundit’s Refund Report records the details of money returned by a Shopify merchant to unsatisfied customers when they return the product/service. These reports help the merchant keep track of the refunds issued, monitor customer satisfaction and have a proper record of financial transactions for filing taxes.
Detailed Sales
The full-detail sales export — every line with channel, payment, tax, cost, and margin — built for deep analysis and your data warehouse.
Last 30 days Sales Summary
A report that provides a comprehensive overview of sales performance over the past 30 days, including total revenue, order count, average order value, and product-specific sales trends for detailed analysis.
Sales by Vendor
The Sales by Vendor report analyzes how each vendor's products contribute to your store's success. By examining sales, purchase costs, and profitability, this report provides insights to make strategic decisions, maximize profits, and optimize inventory management based on vendor performance.
Last 24 Hours Orders
Use the Last 24 Hours Orders report to stay updated on all orders placed within the past day. It provides critical insights into sales trends, customer transactions, and order statuses, allowing you to monitor your store's recent activity and make informed business decisions.
Sales by Staff
A report designed for quick analysis of sales attributed to each staff member across all POS locations, with details from gross sales to net sales calculations.
Sales by Fulfillment Location
Data reported to analyze sales based on order fulfillment locations for any specified date range, including product quantity sold and corresponding sales value.
Order Tags and Line Item Properties
A detailed report built to include order tags and line items added to each placed order, along with essential sales and product details for thorough analysis and processing.
Weekly Sales Pattern
Your true day-of-week rhythm — which days and hours actually sell — so you staff, schedule ads, and send emails when buyers are buying.
Sales by Checkout Currency
This report displays the breakdown of your sales by customer currency used at the checkout with the total sales value also being displayed in your local currency.
Finance Summary
The Finance Summary Report provides an overview of your store’s financial performance by aggregating key revenue, expense, and tax data. This report helps store owners understand their overall profitability, cash flow, and key cost drivers, making it essential for budgeting and financial planning
Sales by Collections
The Sales by Collections report provides a detailed view of your product sales, inventory costs, and profitability by collection, helping you see which collections drive revenue and how they resonate with your audience, allowing you to tailor your product strategies accordingly.
Sales by POS
The report provides detailed sales figures and net product counts, accounting for refunds, at each POS location, offering a clear view of actual sales performance and inventory movement.
Sales by Discount Code
Sales by Discount Code report in Report Pundit provides a detailed analysis of sales generated through specific discount codes over a defined period.
Sales by Variant
Gain detailed insights into each product variant's performance with the Sales by Variant Report. Beyond basic sales data, it shows how each variant impacts your store's success. Use it to fine-tune inventory management and identify popular options, helping you make strategic decisions to boost your bottom line.

Build and automate your Shopify Reporting
Unlock the full potential of your Shopify store with Report Pundit. Gain access to over 2000 data fields, automate reports, and make data-backed decisions to grow your business.