What Is the Inventory by Product Type Report?
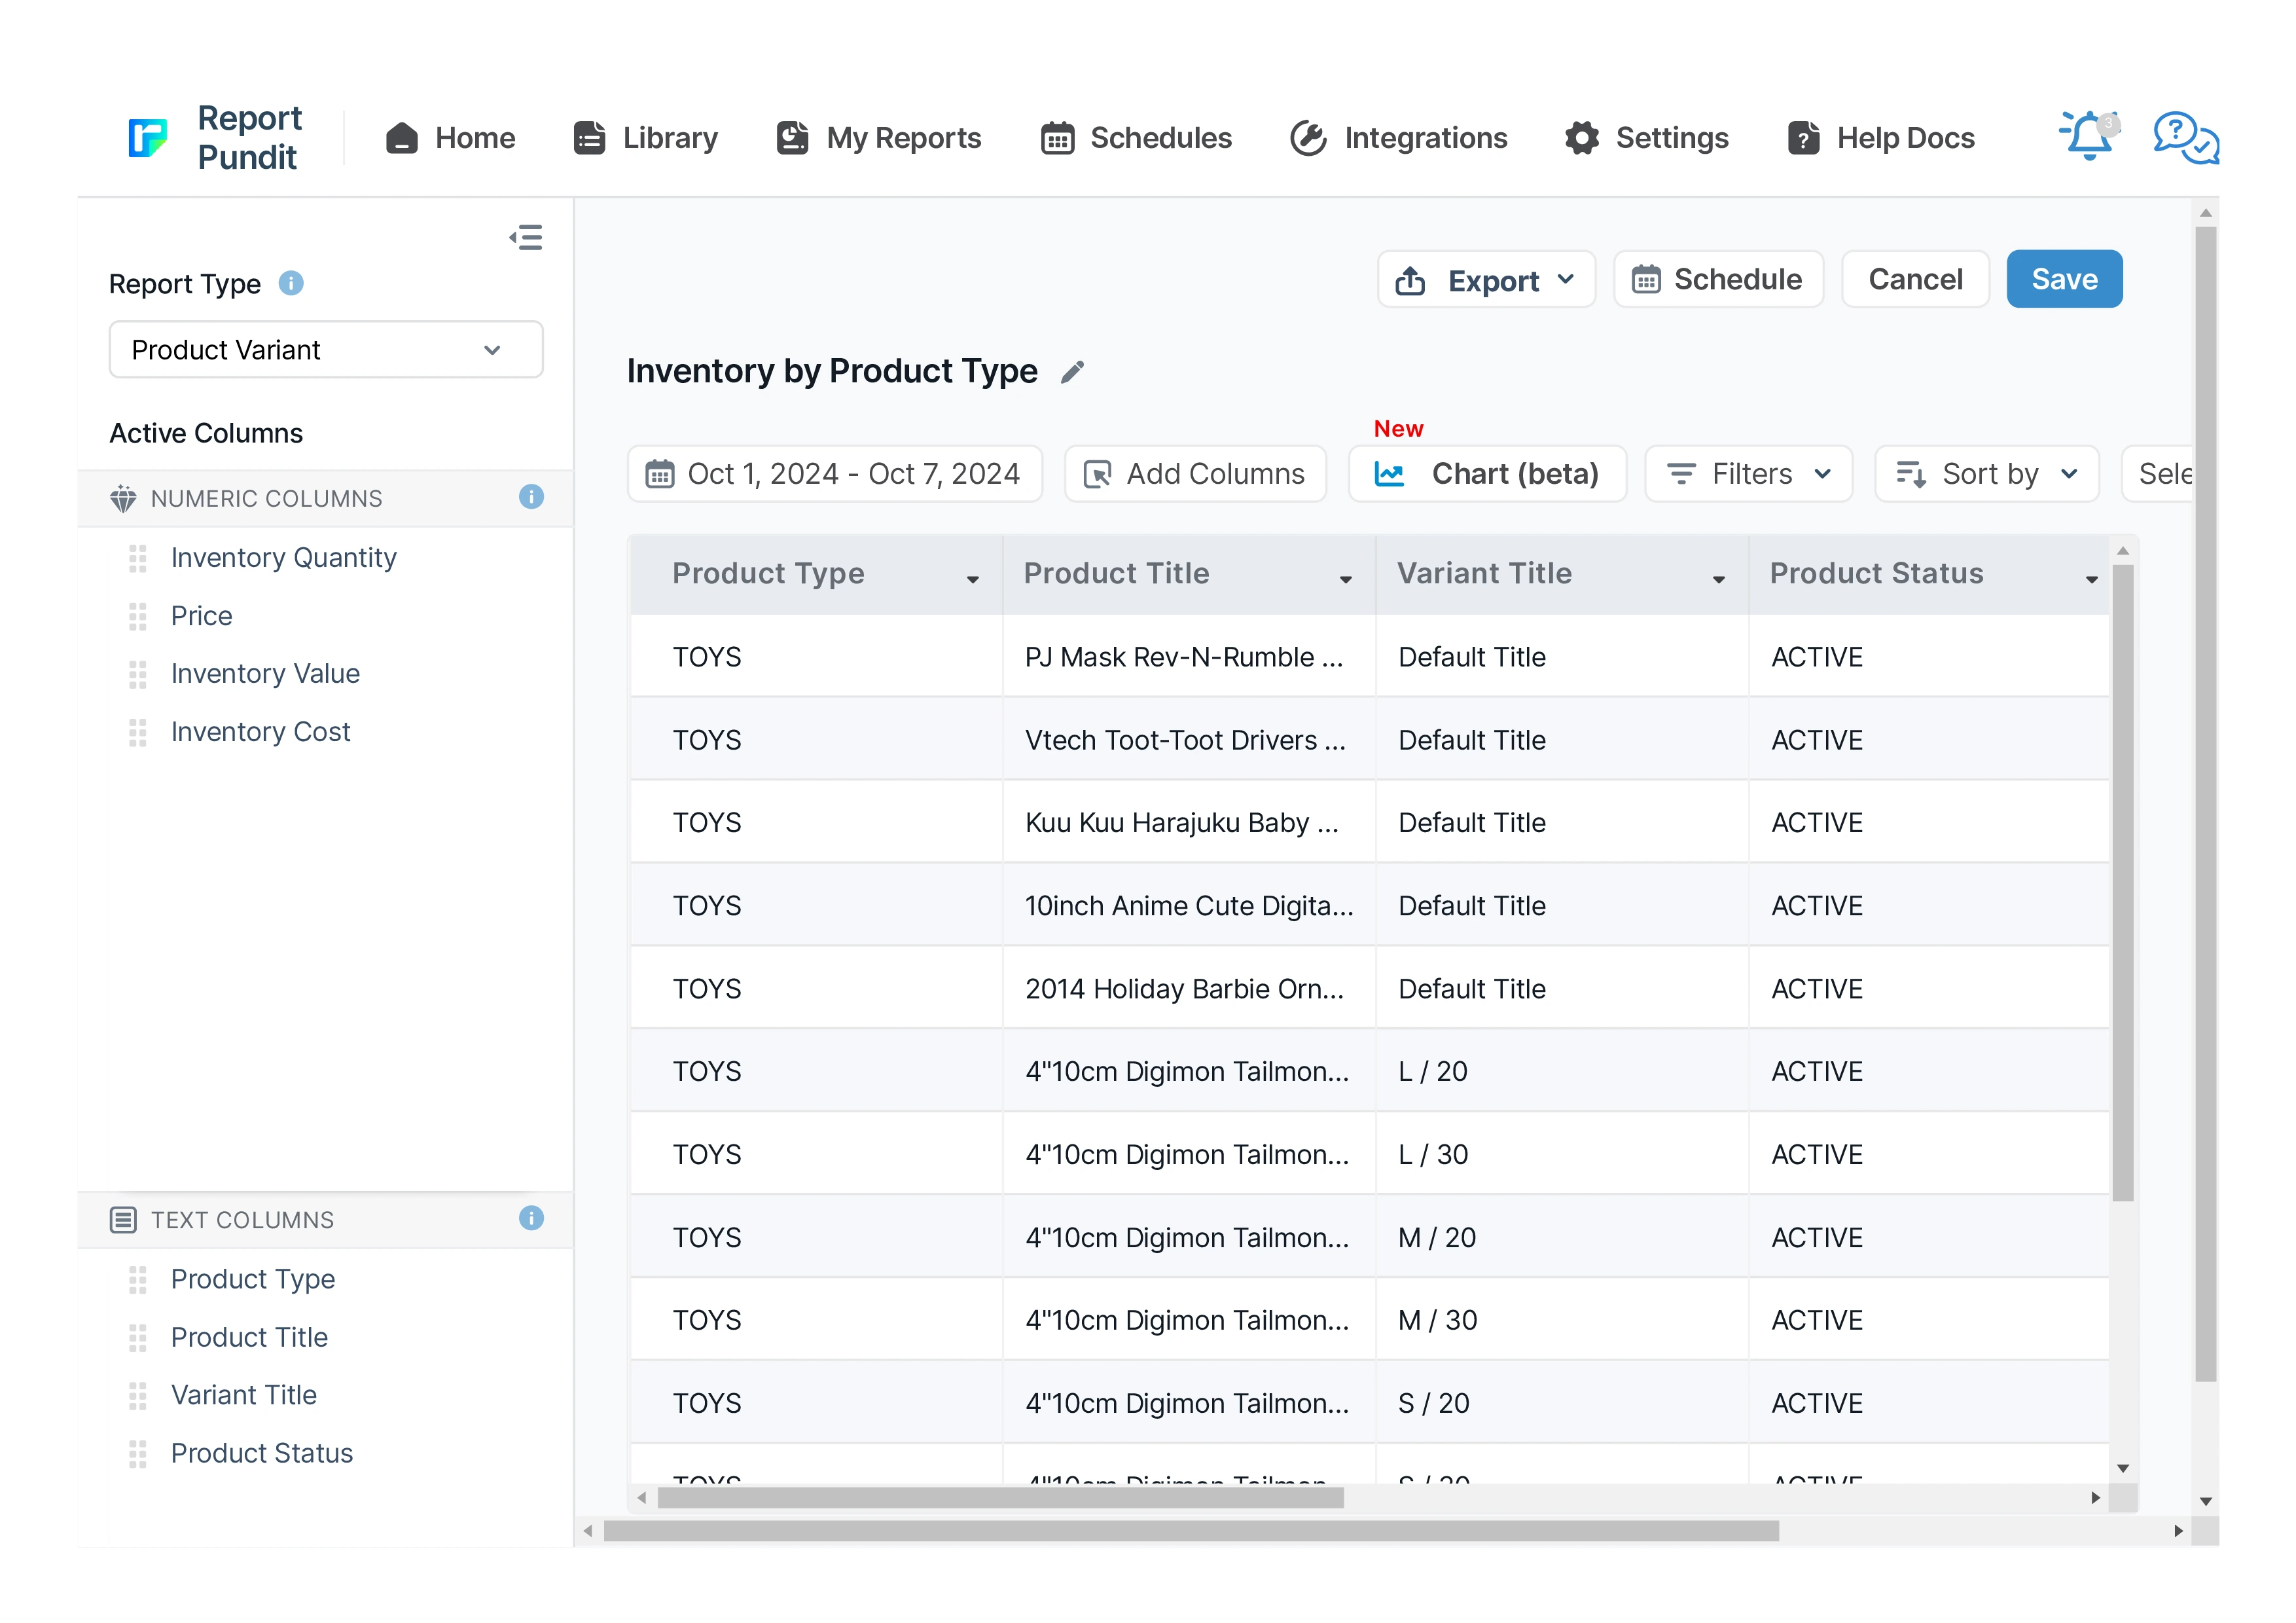
The Shopify Inventory by Product Type report groups your stock by the product type assigned to each item, then shows the units on hand, price, inventory value, and inventory cost for every product and variant inside each type. Instead of scrolling a flat product list, you get a category-by-category view of where your stock and your cash are sitting.
Product type here is the custom product type set on each Shopify product, such as dresses, supplements, or accessories. It is not the same as a collection. A collection can mix many product types and is usually built for merchandising, while product type is a single catalog classification, which makes it a cleaner way to roll inventory up by category.
Merchants reach for this report when they need to know which categories hold the most stock value, which are overstocked, and which are running thin before the next purchase order goes out. It turns "how much am I holding, and where" into a number you can act on.
Which Fields Are Included in the Inventory by Product Type Report?
These fields let you evaluate stock levels and financial exposure one product type at a time.
You can customize the pre-made report by adding, removing, or rearranging columns so it matches how your catalog is organized.
Important Insights You Can Find in This Report
Which product types hold the most inventory value?
Sort the report by inventory value and read from the top. This tells you which categories carry the largest share of your stock investment, which is rarely the category with the most units. A single high-priced product type can outweigh several high-volume ones. Knowing where the value concentrates tells you which categories deserve the most attention when you plan reorders or clear space.
Are you overstocked in one category while another runs thin?
Compare inventory quantity across product types against how each one usually sells. A category sitting on far more units than it moves is cash parked on a shelf, while a fast-selling type with a shrinking quantity is a stockout waiting to happen. This report puts both in the same view, so you catch the imbalance before it becomes a markdown or a lost sale.
Is draft or archived stock still counted in a category's totals?
Filter or scan the Product Status column within a product type. Items that are draft or archived can still hold inventory quantity, value, and cost even though customers cannot buy them from your storefront. If a category looks heavier than expected, status is often the reason. It flags stock that is inflating your category totals without contributing to sales.
THE ANALYST'S READ: The Signal Most Merchants Miss
Look at the gap between Inventory Value and Inventory Cost for each product type. Value is measured at selling price and cost is measured at what you paid, so the space between them is the potential gross margin sitting in that category's stock.
A wide gap could indicate a category with healthy margin cushion, where holding stock is less risky because each unit carries room to profit. A narrow gap may suggest you are holding expensive stock with little margin protection, so a discount or a write-down in that category hurts more than the unit count alone would imply.
It is worth checking any product type that carries a high inventory cost but only a slim value-to-cost gap. That combination ties up real money in stock that has limited room to absorb markdowns, and it is often hidden when you only look at quantity or at value on its own.
How Can You Automate the Inventory by Product Type Report?
Open Report Pundit, open the pre-made Inventory by Product Type report, and press Save. The columns are already set. If you would rather build it yourself, go to Custom Reports, add the fields listed above, apply any filter you need, and Save.
From there you can schedule it to email you automatically on a daily, weekly, or monthly basis, so you never rebuild it by hand. The same schedule can send it to your team, your VA, or your accountant. You can also export it as Excel, CSV, or PDF, or push it to Google Sheets or Google Drive.
Frequently Asked Questions
What does the Inventory by Product Type report group by?
It groups your inventory by the product type field set on each Shopify product. Every product and variant rolls up under its assigned type, giving you a category-level view of stock, value, and cost.
What is the difference between Inventory Value and Inventory Cost in this report?
Inventory Value is your on-hand stock measured at selling price (inventory quantity multiplied by price). Inventory Cost is the same stock measured at what you paid for it (cost per item multiplied by quantity). Value shows what the stock could sell for; cost shows what you have invested in it.
How is this different from the Inventory by Collections report?
This report groups by product type, which is a single catalog classification per product. Inventory by Collections groups by collection, which can contain many product types and is usually built for merchandising. Use product type for a clean category rollup and collections when your stock questions follow how you group products on the storefront.
Can I see stock at the variant level within each product type?
Yes. The Variant Title column breaks each product into its variants, so you see inventory quantity, value, and cost at the level you actually reorder, not just at the product level.
Can I filter this report to one product type or status?
Yes. You can filter to a single product type, a specific status such as active only, or another part of the data, then save that view so it runs the same way each time.