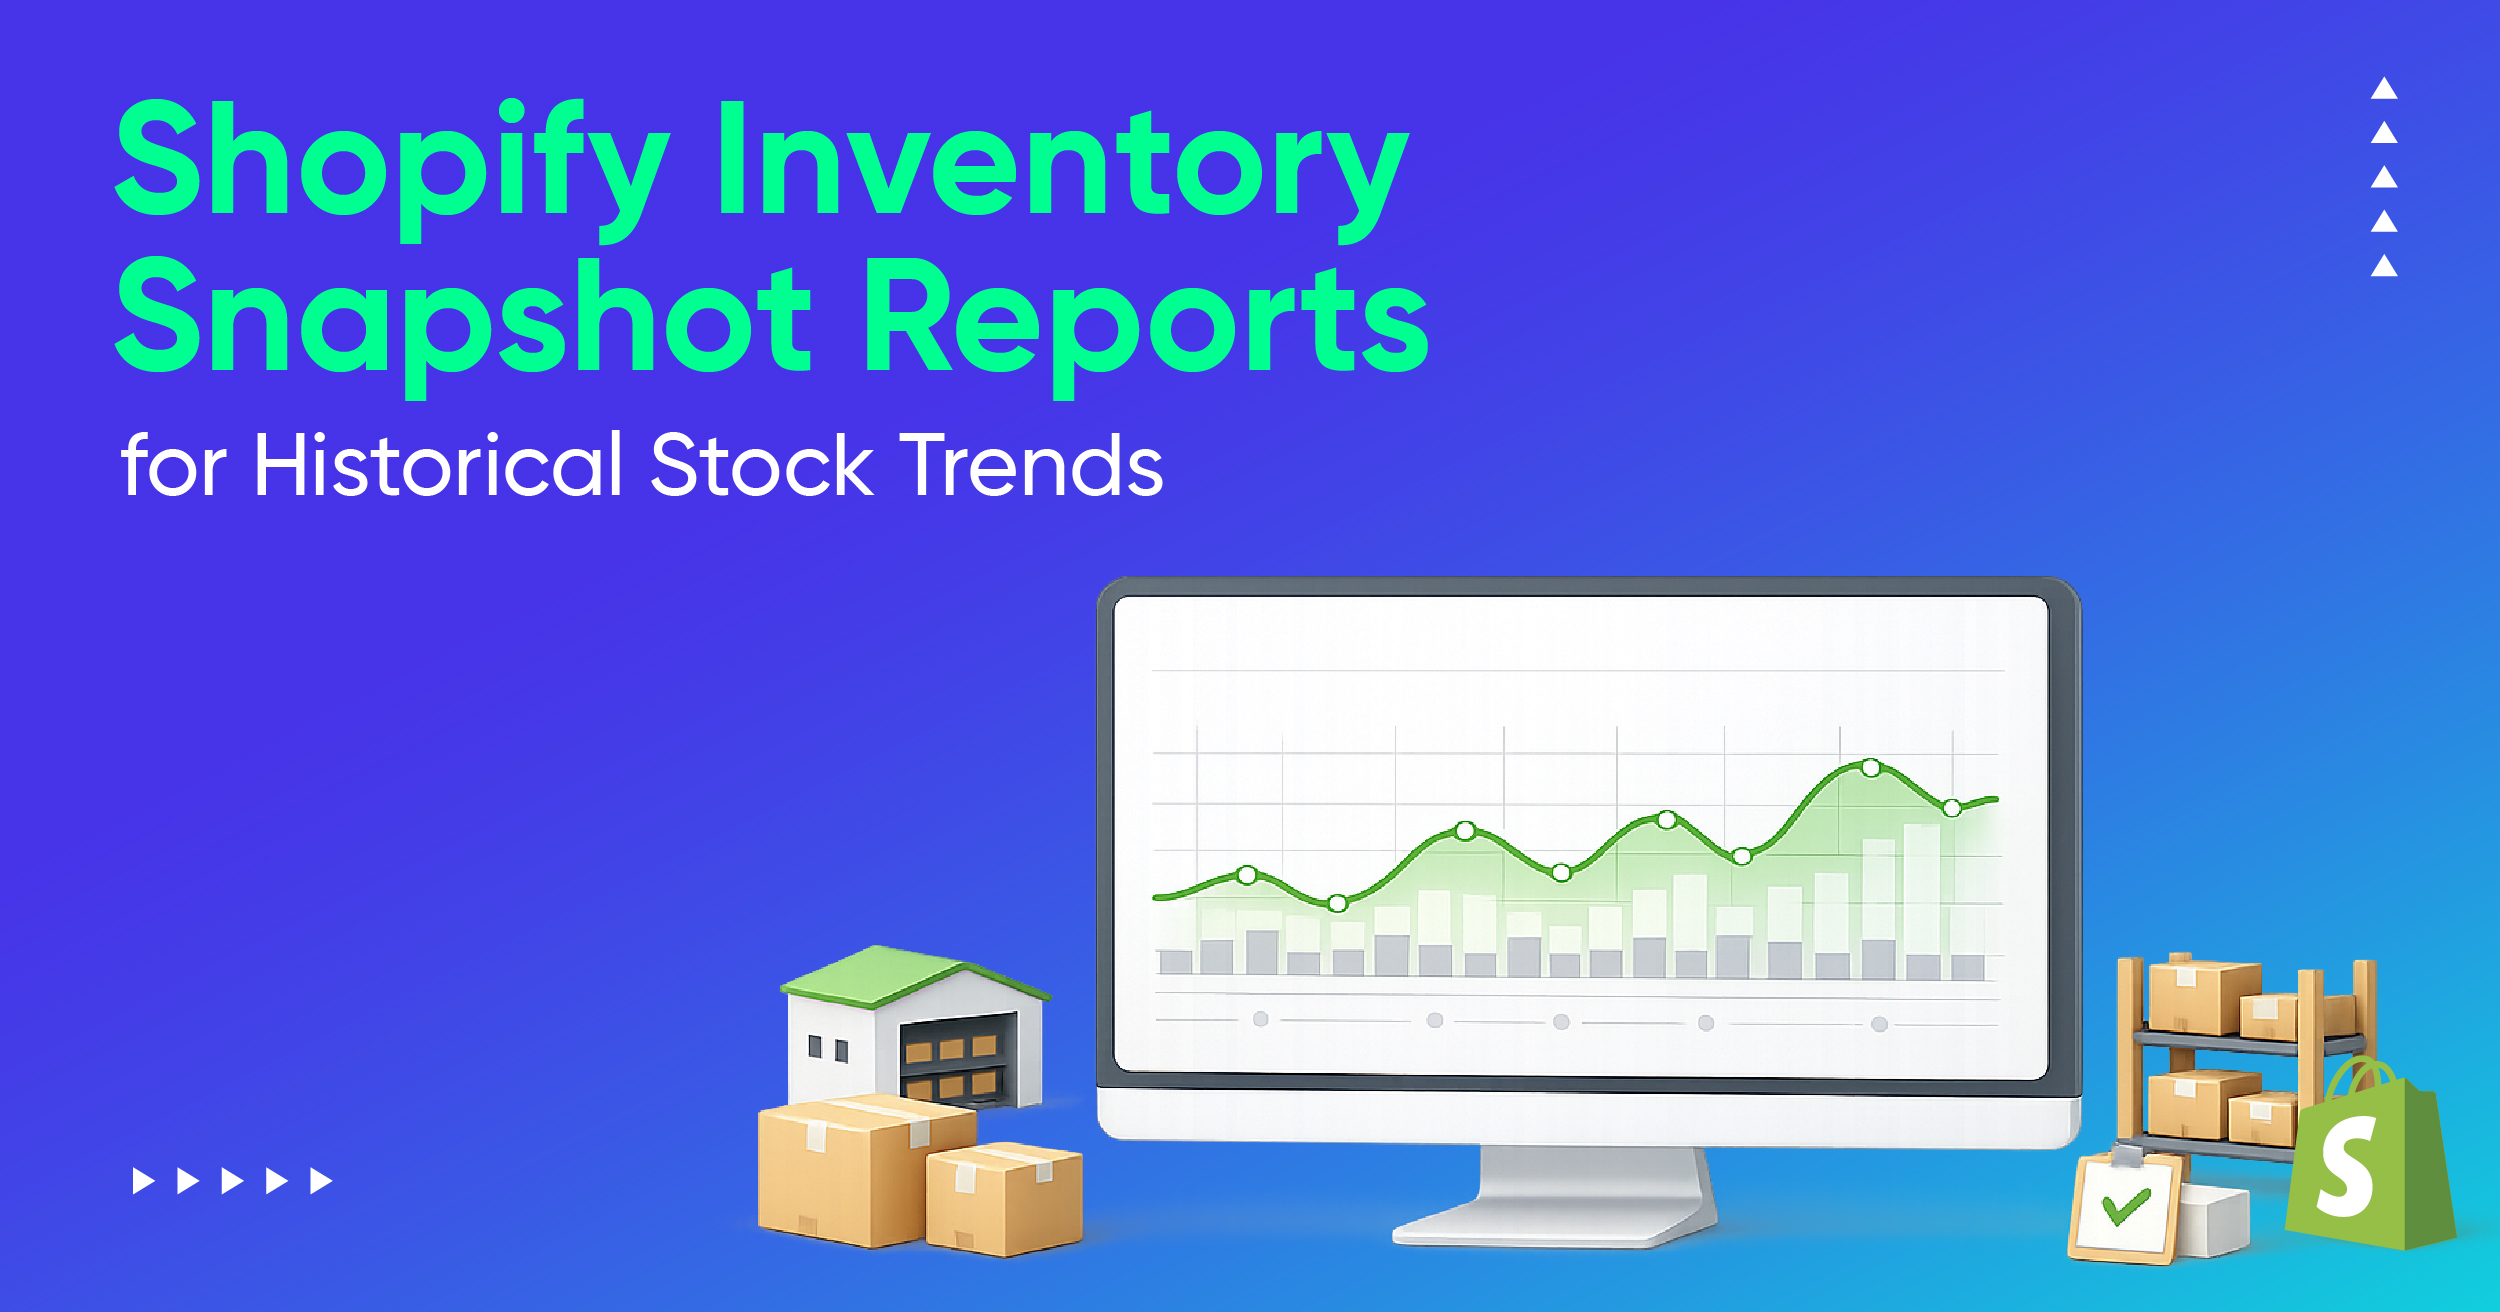
Shopify Inventory Snapshot Reports for Historical Stock Trends

.svg)
.svg)
.svg)
Monitor Historical Stock Trends with Shopify Inventory Snapshot Reports
Current inventory tells you where stock stands now. It does not tell you what inventory looked like last Tuesday, at the end of a promo, or on the day your accountant needs for period-end closing.
That is why inventory snapshots matter. A snapshot gives you a point-in-time record of stock by product, variant, and often location. Over time, those snapshots become a history of how inventory moved, when it started building up, and where availability changed. Shopify’s native inventory reporting already includes a Month-end inventory snapshot report, along with related inventory reports and adjustment-history reporting, so merchants do have a native starting point for historical visibility.
The catch is that month end history and adjustment history do not answer every operational question. If you need inventory data for a specific past date within the last 180 days, a weekly timeline, or a daily stock trail around a launch, transfer, or seasonal spike, you usually need a dedicated inventory snapshot workflow on top of Shopify’s native reports.
What an inventory snapshot actually shows
An inventory snapshot is a record of stock levels at a specific point in time.
Think of it as freezing the stock position for that moment. Instead of seeing only the inventory you have today, you can look back and answer questions like:
- How many units of this SKU did we have on March 31?
- When did this variant start slowing down?
- Which location started running low first?
- How much stock was on hand before or after a major promotion?
Shopify’s native inventory reports include month-end snapshots and month-end inventory value, which are useful for accounting and period-end review. Shopify also offers Inventory remaining per product, Inventory sold daily by product, Products by sell-through rate, and ABC product analysis, which help put stock levels in context.
What Shopify gives you natively for inventory history
Shopify does support historical inventory reporting, but it is important to understand what kind of history it provides.
From Analytics > Reports, merchants can access Shopify’s inventory reports, including:
- Month-end inventory snapshot
- Month-end inventory value
- Inventory sold daily by product
- Products by percentage sold
- ABC product analysis
- Products by sell-through rate
- Inventory remaining per product
- Inventory adjustment changes
- Inventory adjustments by count
From the Inventory page in Shopify admin, you can manage stock, make adjustments, and view inventory-related activity. For individual products and variants, Shopify’s adjustment history page shows the last 180 days of inventory adjustment history. For older history, Shopify points merchants to the Inventory adjustment changes report.
There are two native limitations merchants should know:
- historical inventory-based metrics in Shopify go back only to October 1, 2023
- historical inventory for deleted locations does not display in inventory reports, only active locations appear in historical reporting data
Those details matter because they shape what Shopify can answer on its own and where merchants may still need a separate snapshot process.
Current inventory vs historical inventory: the difference that changes decisions
A lot of inventory confusion comes from mixing these two views.
Current inventory tells you what is available right now. That is useful for day-to-day operations, replenishment checks, and immediate stock visibility.
Historical inventory tells you what stock looked like on a past date or through a past period. That is what you need for audit support, trend analysis, period-end reconciliation, and understanding how stock changed over time. Shopify’s native month-end snapshot reports serve that purpose at period end, while adjustment history explains how quantities changed along the way.
When you combine the two, the picture gets much clearer:
- current inventory tells you what you can sell now
- month-end snapshot tells you where you closed the period
- adjustment history tells you how stock changed
- scheduled daily or weekly snapshots show the pattern in between
That is what turns inventory from a static number into a usable operating timeline.
Why historical stock data matters so much
Historical inventory is not just for audits. It affects purchasing, cash flow, merchandising, and forecasting.
Without a historical view, you are often forced to infer what happened from what you see now. That works poorly when the business needs answers like:
- when stock started piling up
- when a location ran out
- whether a promotion accelerated sell-through
- whether a receiving issue or adjustment changed the stock position unexpectedly
Month-end snapshots help with financial closing and valuation. Adjustment history helps with tracing changes and discrepancies. But the real power comes when you can study stock behavior across time, not just at month-end. That is how merchants catch patterns before they become expensive.
Historical snapshots make slow movers easier to spot
Looking only at today’s inventory can be misleading.
A product might look overstocked now because it arrived recently. Another product might show a moderate quantity today, but that same quantity may have been sitting for weeks with almost no movement. Snapshot history is what separates “newly received stock” from “inventory that has been stuck too long.”
Shopify’s inventory reports already include Products by percentage sold, Products by sell-through rate, and Inventory remaining per product, which help identify how efficiently inventory is moving. When those metrics are read alongside historical stock snapshots, merchants can tell not just that a product is slow now, but when the slowdown began and whether it is getting worse.
That usually leads to better action:
- markdowns or bundles for real slow movers
- tighter reorder control for weak variants
- assortment changes for products that tie up cash without moving
Snapshots are also a planning tool, not just a cleanup tool
Historical stock data is just as useful for forward planning as it is for fixing problems.
When merchants can compare opening stock, units sold, adjustments, and ending stock over a sequence of dates, they get a more realistic picture of sell-through and replenishment timing. Shopify’s native inventory reports support period-end views and sold-per-day reporting. A dedicated snapshot workflow extends that idea by letting merchants read changes across the dates that matter to the business, not just the end of the month.
That helps with decisions like:
- how many days of stock remain on key items
- which products deserve deeper buys next season
- which vendors or categories need closer review
- how promotions or seasonal demand changed stock movement
Multi-location inventory is where snapshot history becomes even more valuable
Inventory gets harder to understand when stock is spread across multiple locations.
A store may have one SKU available overall but still have a real stock problem because the wrong location is carrying it. Historical reporting helps teams see where stock was held, where it moved, and when one location started carrying the burden for the others. Shopify’s inventory reports and adjustment reporting support location-aware analysis, and the adjustment changes report can be filtered by dimensions such as SKU, location, staff member, app, and adjustment reason.
This is especially useful for questions like:
- which warehouse stocked out first
- where stock accumulated after a transfer
- which location had repeated adjustments
- whether a discrepancy was caused by receiving, a return, a transfer, or a manual correction
What inventory movement history helps explain
Stock levels do not change by magic. They change because something happened.
That “something” may be:
- a sale
- a return
- an inventory count correction
- a transfer between locations
- received inventory
- damage or rejection
- a manual adjustment
- an app-driven sync or workflow
Shopify’s inventory adjustment history surfaces the event behind the adjustment, and the broader inventory adjustment changes report gives merchants a way to analyze changes across products, locations, apps, reasons, and date ranges. That makes historical reporting much more useful because it is not just a stock total. It is a record of how the stock position changed.
Where Shopify’s native history still falls short
Shopify’s native inventory reports are useful, but they do not cover every historical use case merchants ask for.
The most common gaps are:
- needing a point-in-time stock view for a non-month-end date
- wanting daily or weekly snapshots over a custom period
- comparing inventory history across a season or promotion window
- pulling historical stock into scheduled exports for finance or operations
- keeping a longer, more flexible snapshot trail than native inventory history alone provides
That is where a dedicated inventory snapshot report becomes valuable. With Report Pundit, merchants can enable snapshot sync and report on past inventory dates alongside current inventory, which is especially useful when month-end snapshots are not enough and the team needs historical stock on specific dates.
Why Report Pundit is a strong fit for inventory snapshots
Report Pundit is a good fit here because historical stock questions are rarely isolated from the rest of the business.
Merchants often want past inventory alongside product, variant, location, vendor, collection, sales, or adjustment context. Report Pundit’s reporting model supports inventory reports, advanced filters, calculated fields, custom metrics, exports, and scheduled delivery, which makes it easier to turn snapshot history into something finance, ops, and merchandising teams can actually use.
That matters because historical inventory becomes more useful when it is not trapped inside one static report. Teams may want to filter by vendor, review only one warehouse, compare current and past inventory, or export the snapshot trail for reconciliation or planning. A stronger reporting layer makes those workflows much easier.
A practical way to use snapshot reports every month
A simple monthly process often works best:
Start with Shopify’s native month-end inventory snapshot for close-of-period review. Then use adjustment history to understand what changed and why. If the business needs a more granular timeline, layer in daily or weekly snapshot reporting so teams can review stock movement between period-end dates instead of guessing from one closing number to the next.
This gives merchants three useful layers:
- current inventory for now
- month-end snapshot for closing
- snapshot history for the pattern in between
That is usually enough to support audits, replenishment planning, slow-mover analysis, and internal reporting without resorting to ad hoc spreadsheet reconstruction.
Closing
Inventory snapshots are one of the easiest ways to make inventory reporting more trustworthy.
Current stock tells you what is happening now. Historical snapshots tell you what happened over time. When you combine Shopify’s native month-end history and adjustment reporting with a more flexible snapshot workflow, you get a much clearer view of stock trends, audit readiness, slow movers, and replenishment decisions.
If your team needs inventory history beyond month-end views, Report Pundit gives you a practical way to track past stock positions, compare them to current inventory, and turn that history into usable reports for finance, ops, and merchandising.
FAQ
Does Shopify have an inventory snapshot report?
Yes. Shopify includes a Month-end inventory snapshot report inside its inventory reports. It also includes Month-end inventory value and related inventory reporting for sell-through, sold-per-day, and inventory remaining.
Can I see historical inventory in Shopify?
Yes, but with limits. Shopify supports historical inventory reporting through month-end snapshot reports and inventory adjustment reports. For individual products and variants, the adjustment history page shows the last 180 days of adjustment history, and older history is handled through the Inventory adjustment changes report.
How far back does Shopify inventory history go?
For inventory-based metrics in Shopify reports, historical data goes back only to October 1, 2023.
Can Shopify show inventory on a specific past date?
Shopify natively gives merchants month-end snapshot reporting and inventory adjustment history, but if you need stock levels for a specific non-month-end date or a scheduled daily snapshot trail, you usually need a dedicated snapshot workflow.
What happens to historical inventory for deleted locations?
Shopify says historical inventory for deleted locations does not display in inventory reports. Only active locations appear in historical reporting data.
Why are inventory snapshot reports useful for accounting?
They help support period-end stock values, valuation, reconciliation, and audit requests because they preserve inventory positions at a defined point in time instead of forcing teams to reconstruct the past from current stock. Shopify’s month-end inventory snapshot and month-end inventory value reports are especially useful for that purpose.


.webp)
.webp)


Build and automate your Shopify Reporting
Unlock the full potential of your Shopify store with Report Pundit. Gain access to over 2000 data fields, automate reports, and make data-backed decisions to grow your business.