Why Shopify Can't Combine Sales and Inventory Reports (And How to Fix It)

.svg)
.svg)
.svg)
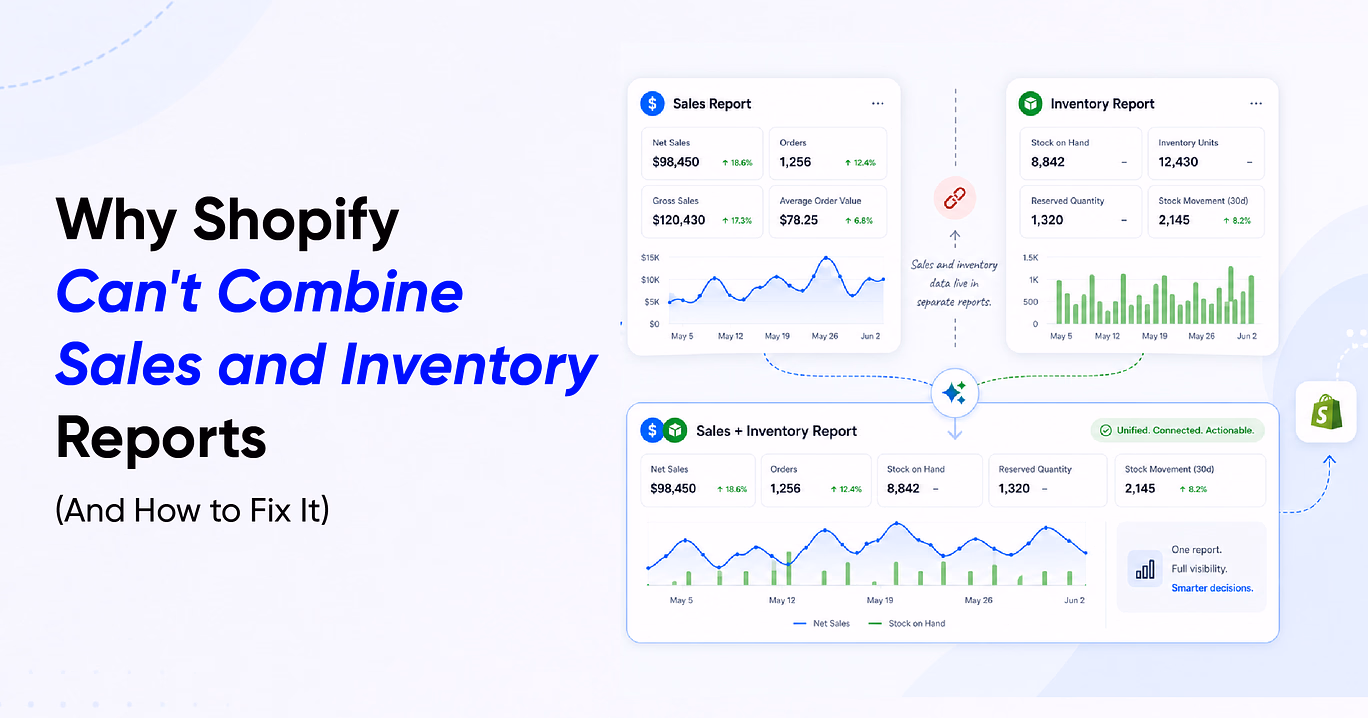
If you've spent any time in Shopify's analytics section, you've probably run into this scenario where you can see your sales data in one place and your inventory data in another, but there's no simple way to view both together in a single native report.
This isn't a setting you missed or a filter you forgot to apply. It is a structural limitation of how Shopify organizes and stores its data, and it creates a real operational problem for merchants who need both views at once.
Here's why it happens, what it costs you, and how to fix it.
What You Actually Need from Combined Reporting
When you ask for a combined inventory and sales report, you are not looking for complex analytics. You simply want a clear view of how products are performing alongside how much stock is available. This helps them make everyday decisions around inventory and planning.
The data you actually need in one place
When you need this report, you can try to answer practical questions like:
- Which products are selling well, and how much stock is left
- Which products are running low because demand is strong
- Which products are sitting in inventory without enough movement
- Can the current stock support future sales
- When should I reorder based on actual sales performance
How Shopify Organizes Its Data and Reports
Shopify structures its analytics into separate categories such as Sales, Inventory, Orders, and Customers. Each category works independently and pulls from a different dataset. This means reports are designed to focus on one area at a time rather than combining multiple data sources.
What each report focuses on
Sales reports typically include:
- Order details and identifiers
- Revenue, discounts, and refunds
- Quantity sold and net sales
Inventory reports focus on:
- Current stock levels
- Inventory cost
- Committed or reserved quantity
The limitation is that these datasets do not overlap. You cannot bring inventory fields into a sales report or sales fields into an inventory report within Shopify’s native system.
Why Sales and Inventory Cannot Be Combined Natively
The main reason Shopify cannot combine sales and inventory in one report comes down to how the data is structured behind the scenes. Sales data and inventory data are built for completely different purposes, and they live in separate systems within Shopify.
Sales data is transactional and related to orders, revenue, discounts, refunds, and time-based activity. Every record is linked to when a purchase happened and how it contributed to overall sales performance. While inventory data is operational. It shows stock levels at a specific point in time, along with cost, availability, and movement of items.
And because of this difference, Shopify uses separate data models for each. These models are not designed to work together inside the native reporting system. There is no built-in way to pull fields from both into a single report.
There are a few key limitations that come from this model:
- Sales and inventory are stored in different data models, which prevents them from being queried together
- Shopify does not support cross-dataset reporting, even in advanced analytics tools
- Metrics are calculated differently, with inventory representing a snapshot and sales representing activity over time
Even if you are using advanced features, the system does not allow combining these datasets into one unified view.
Challenges in Managing Stock Without Sales Context
This becomes more stressful for stores with multiple locations. Since inventory is tracked by location and sales are reported separately, it is difficult to understand how products are performing across different warehouses or stores.
Another challenge is identifying slow-moving or dead stock. A product might appear well-stocked in an inventory report, but without sales data alongside, there is no clear indication of whether it is actually selling. This can lead to excess inventory sitting unused.
Reordering decisions are also impacted. To reorder effectively, you need to know both current stock levels and how quickly products are selling. Without both pieces of information in one place, decisions are often based on estimates rather than clear data.
In practice, this leads to a few common challenges:
- No single view that combines stock levels with sales performance
- Difficulty identifying products that are not selling
- Reordering decisions based on incomplete information
- Inventory is tracked by location, while sales are reported by channel, making it difficult to view stock levels and units sold together in a single report.
- Shopify keeps detailed inventory history for only 90 days, which limits long-term analysis of how inventory levels impact sales trends.
Typical Methods Used to Handle This Limitation
There are a few common ways you may have tried to bring sales and inventory data together using available tools. However, they are not always efficient or sustainable.
Manual exports and spreadsheets
Many merchants export sales and inventory reports separately and then merge them in spreadsheets to create a combined view. While this method works for quick checks, it is time-consuming, repetitive, and increases the chances of manual errors.
Advanced queries still fall short
Even with more advanced reporting options within Shopify, the core limitation remains. These tools provide more flexibility within each dataset but still do not support combining sales and inventory into a single report.
Scalability challenges
As the product catalog grows, managing data manually becomes more complex. What starts as a simple workaround quickly turns into an inefficient process that is difficult to maintain for growing stores.
How to Work Around Shopify’s Inventory and Sales Reporting Limits
Managing inventory without a sales context or tracking sales without stock visibility creates blind spots. You need both datasets together to make accurate, timely decisions. Without this combined view, it becomes difficult to understand the true performance of the product or plan inventory effectively.
A combined report brings sales and inventory data into one place, giving a complete picture of how products are performing and how much stock is available. Instead of switching between multiple reports or relying on spreadsheets, everything is visible in a single, structured view.
This combined view typically includes product name and variant details, current inventory levels, cost and stock value, units sold over a selected period, net and gross sales, and refunds and returns.
This is how it helps you
- Making it easier to identify fast-moving and slow-moving products
- Helping you plan reorders based on actual sales performance
- Reducing the risk of stockouts and overstocking
- Saving time by removing manual data merging
- Supporting faster and more confident decision-making
Solution 1: Use Shopify’s Native Reports from a Different POV
Shopify does provide some overlap between inventory and sales data, but only from separate reporting perspectives rather than in one truly combined report.
From the inventory reporting perspective
Shopify’s Inventory category reports include metrics like units sold, which show how many quantities of a product were sold during a selected period. These reports are useful for understanding stock movement from an inventory standpoint, but they mainly focus on quantity-based inventory tracking and do not include inventory properties.
You can also access inventory-focused data, such as:
- Inventory reorder levels
- Inventory adjustment activity
- Stock availability and inventory movement insights
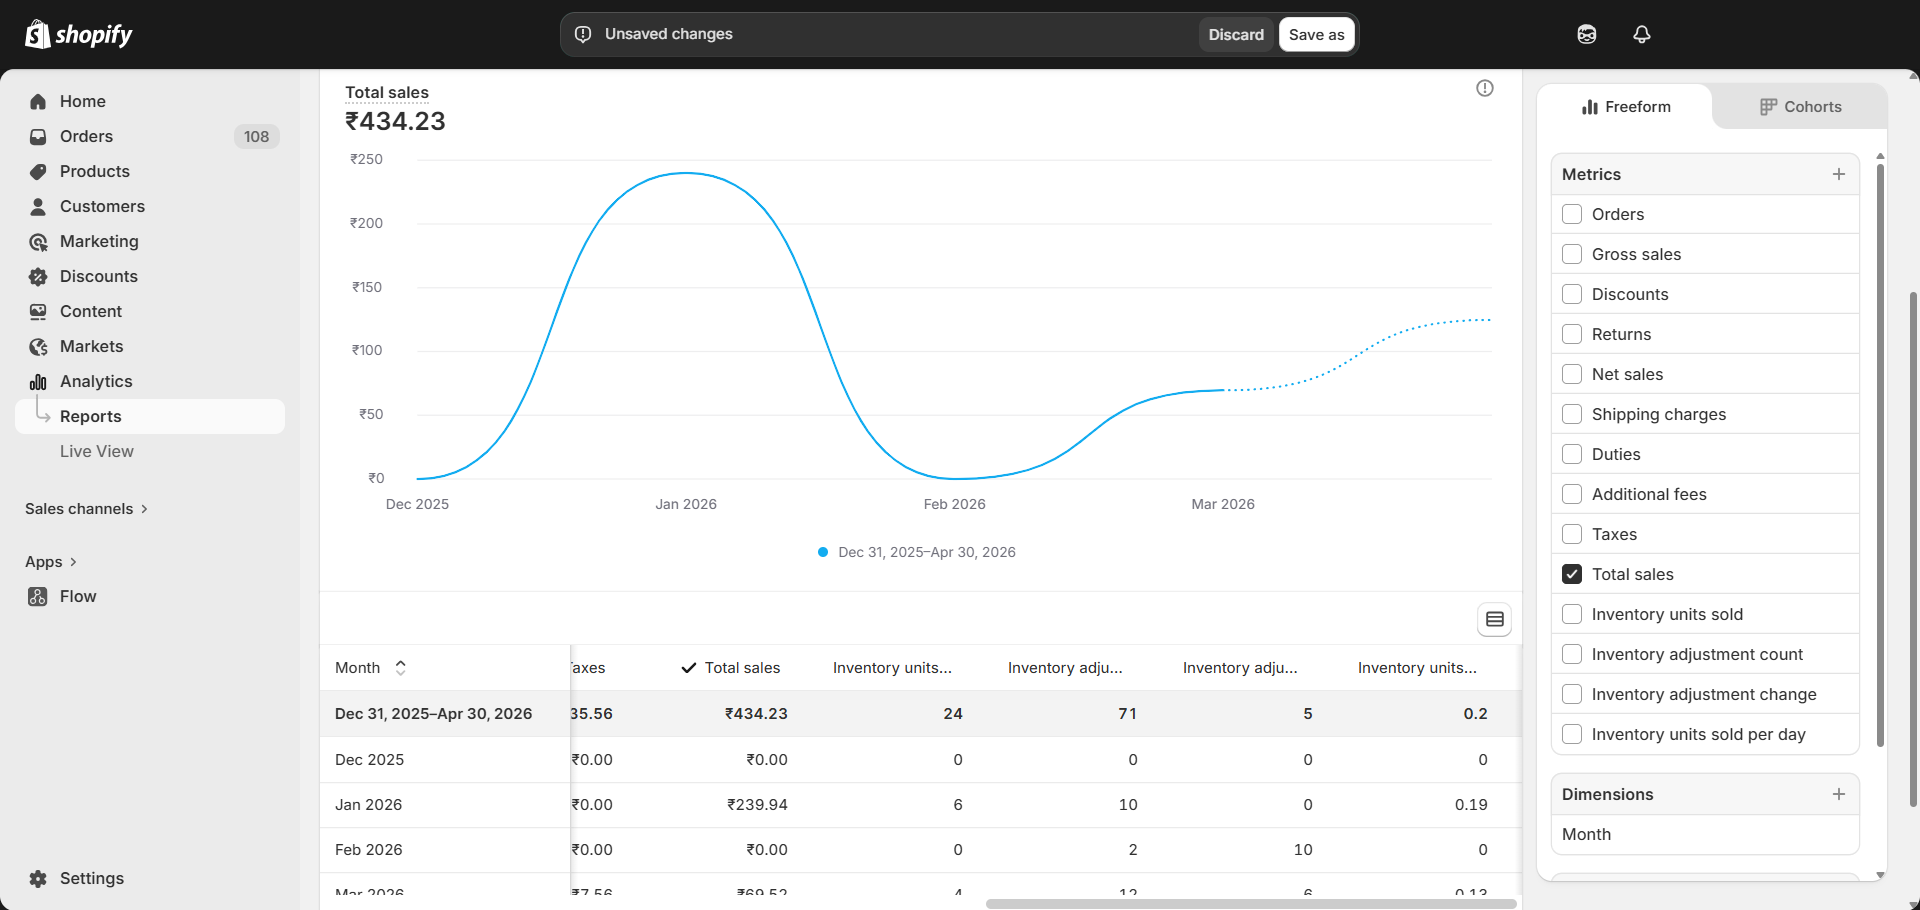
From the sales reporting perspective
Shopify’s Sales reports focus primarily on revenue and order performance, but they also include a few inventory-related metrics. For example, some reports can show inventory units sold, days in inventory, and similar stock-related fields alongside sales data.
However, these reports are still sales-focused and do not provide a fully connected inventory management view with stock levels, reorder insights, or inventory adjustment details in the same report.
While these native reports help provide partial visibility, merchants still need external tools or manual work to create a truly unified inventory and sales report.
Solution 2: Use a Reporting Tool That Combines Both Datasets
A more efficient and long-term approach is to use a reporting tool that can consolidate sales and inventory data into a single report automatically. This removes the need for manual exports and data merging.
With a tool like Report Pundit, you can start with a sales report and include inventory-related fields in the same view, such as inventory item cost, ending inventory units, and inventory units sold or committed quantity.
At the same time, they can retain important sales data in that report, including shipping charges, refunds, net sales, and other order-related metrics.
This creates a single report where all key data points are available together. As a result, you can build the report once, keep it updated automatically, and even schedule it for regular use.

Conclusion
Shopify is a powerful platform, but its native reporting has a clear structural gap. Sales and inventory data live in separate systems, and there is no built-in way to bring them together in one report.
For merchants making decisions around stock, reorders, and product performance, that gap adds up fast. Exporting CSVs and merging spreadsheets might work once or twice, but it is not sustainable as your store grows.
Report Pundit bridges both datasets automatically, so you can build a combined report in minutes, without the manual work


Build and automate your Shopify Reporting
Unlock the full potential of your Shopify store with Report Pundit. Gain access to over 2000 data fields, automate reports, and make data-backed decisions to grow your business.