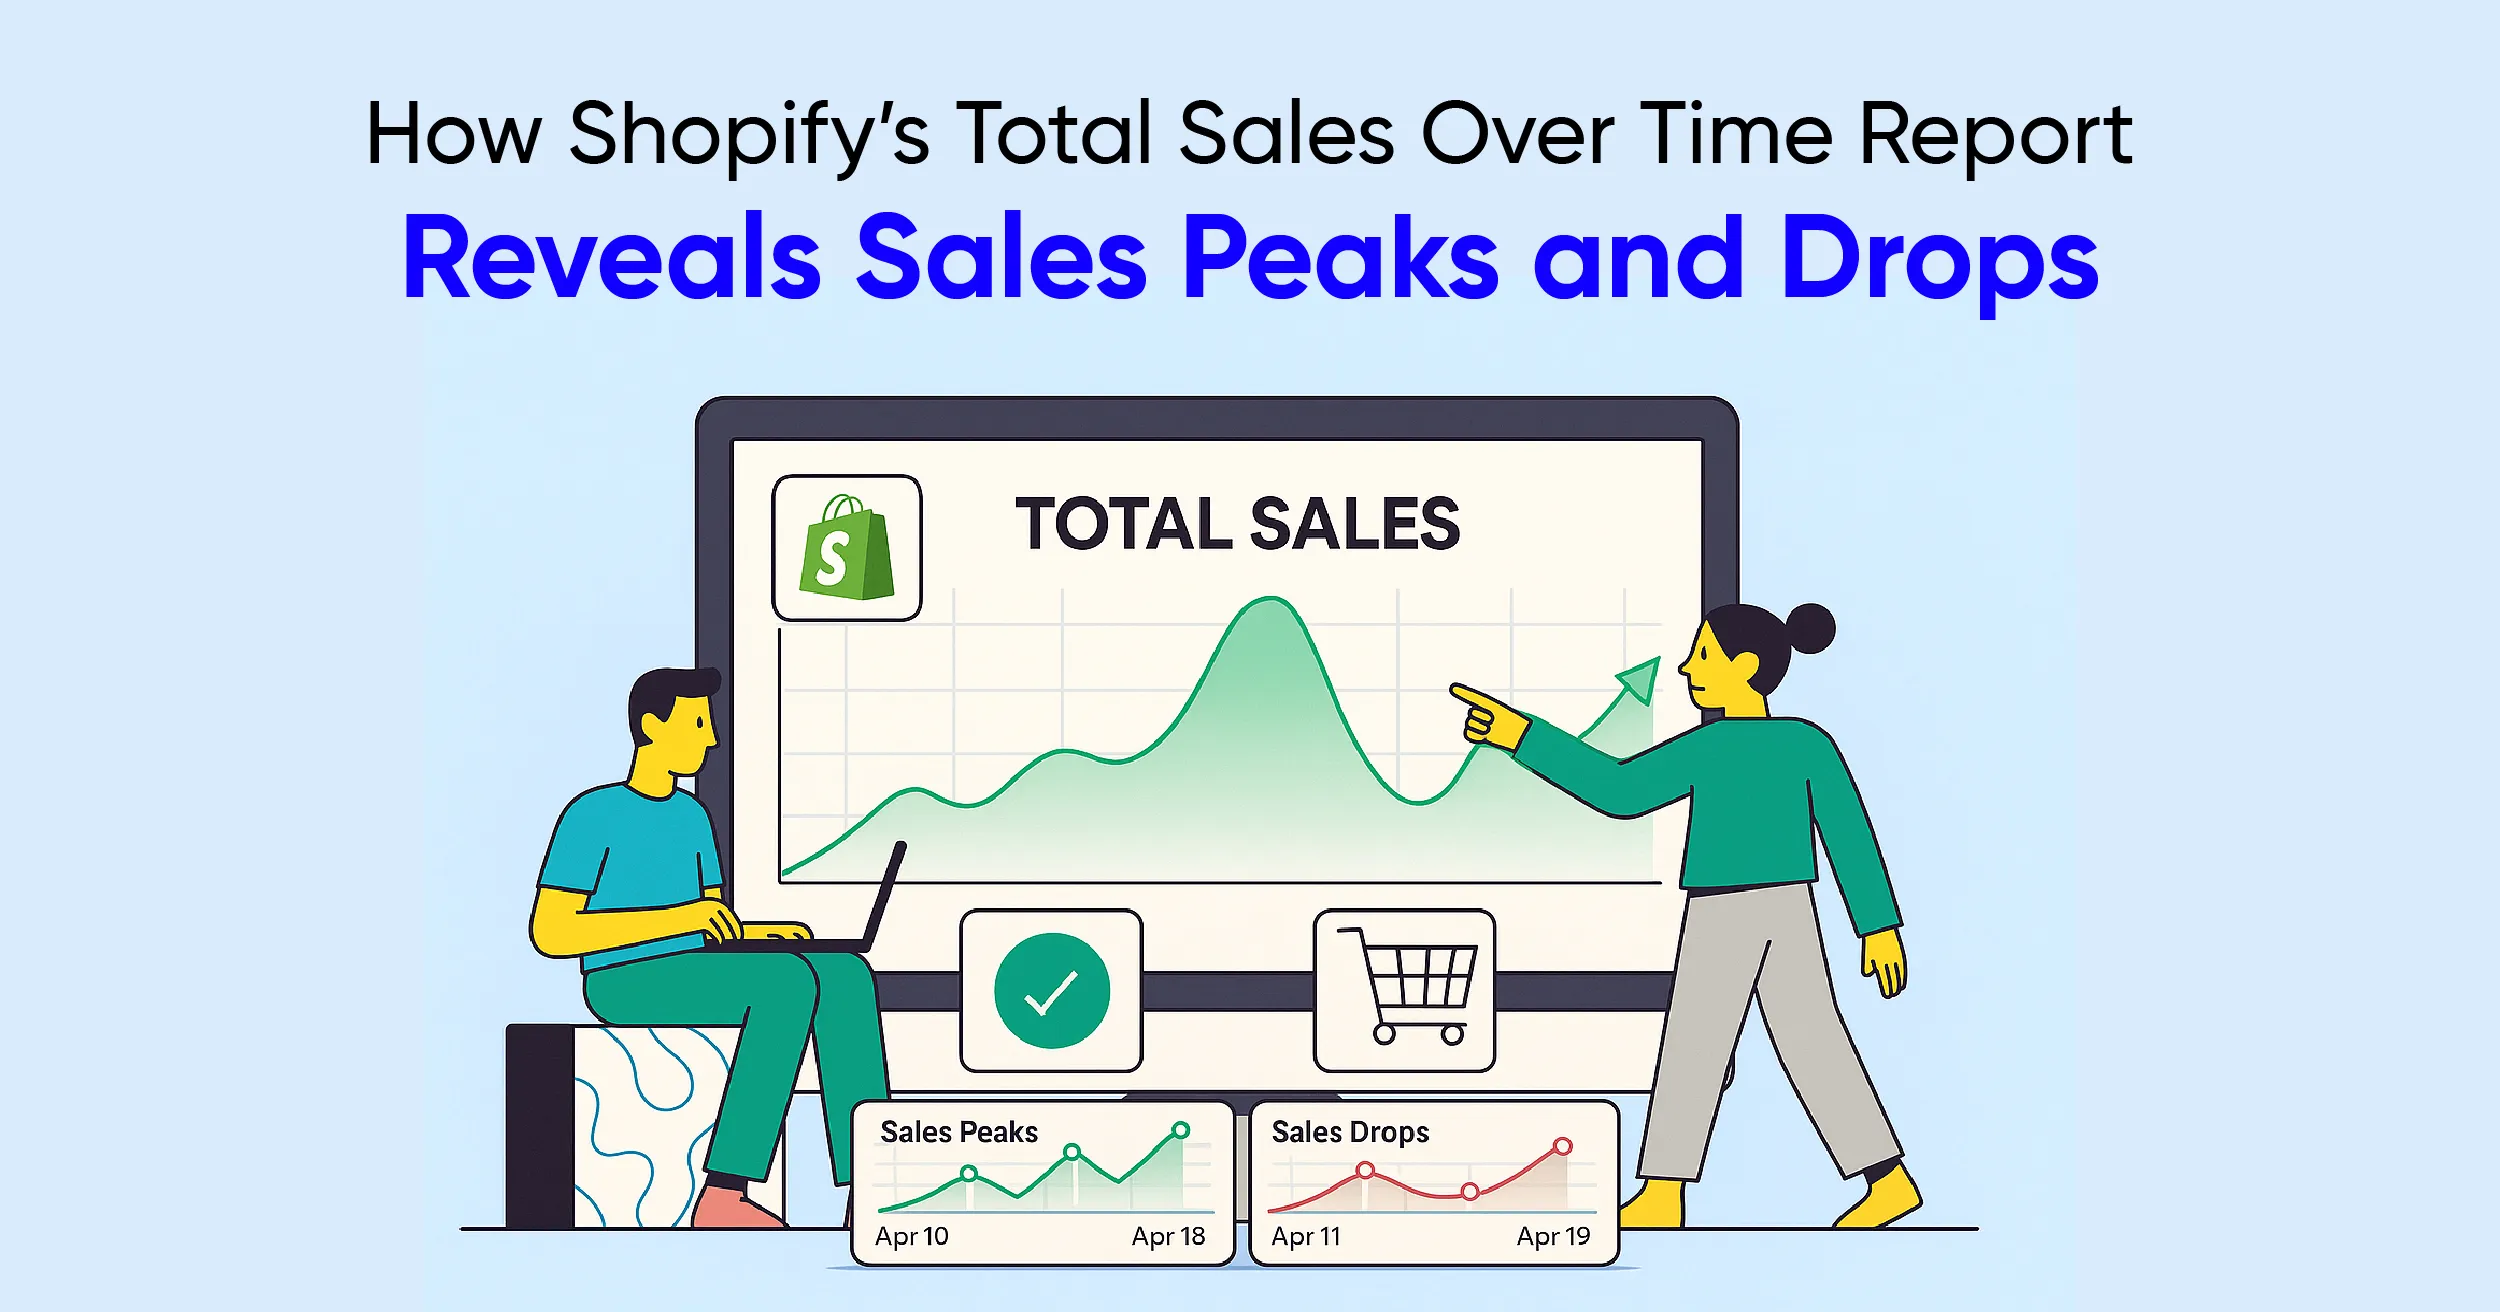
How Shopify’s Total Sales Over Time Report Reveals Sales Peaks and Drops

.svg)
.svg)
.svg)
If you ever come across situations where your Sales report is not reporting, and the totals are mismatched. You checked Shopify and compared the screenshot, and refreshed the data, but still couldn’t understand why the numbers are not matching, especially when it comes to making revenue decisions. For every store owner, it's very crucial to understand the sources of revenue, especially when it comes to Shopify Total Sales Over Time. In this article, we’ll see how you can track your total sales in various time intervals, hourly, daily, weekly, and monthly, to analyze sales trends.
Additionally, this report helps calculate gross revenue generated by your store after deductions like discounts, refunds, and so on. Here we will see how to use this report for the best practice to optimize your revenue.
What is the Total Sales Over Time view, and why should you care
Sales over time is a type of report in Shopify that tracks your store's revenue and order trends across a selected date range. It helps you in analysing how your sales are fluctuating over time.
Total sales = Gross sales - Discounts - Returns + Taxes + Shipping charges + Fees
With the help of the Total Sales Over Time Report:
- You can view peak sales
- Can spot a sales drop
- Can monitor customer buying behaviour
- Allows you to track the effectiveness of discounts or promotions
- Track sales trends
- Fulfillment and Inventory Replenishment
Where do you see this report inside Shopify
To view this Total Sales Over Time report:
- Log in to your Shopify Dashboard
- Go to Analytics in the left side menu
- Click on Reports > Choose Sales category
- Under the Sales category, choose Total Sales Over Time
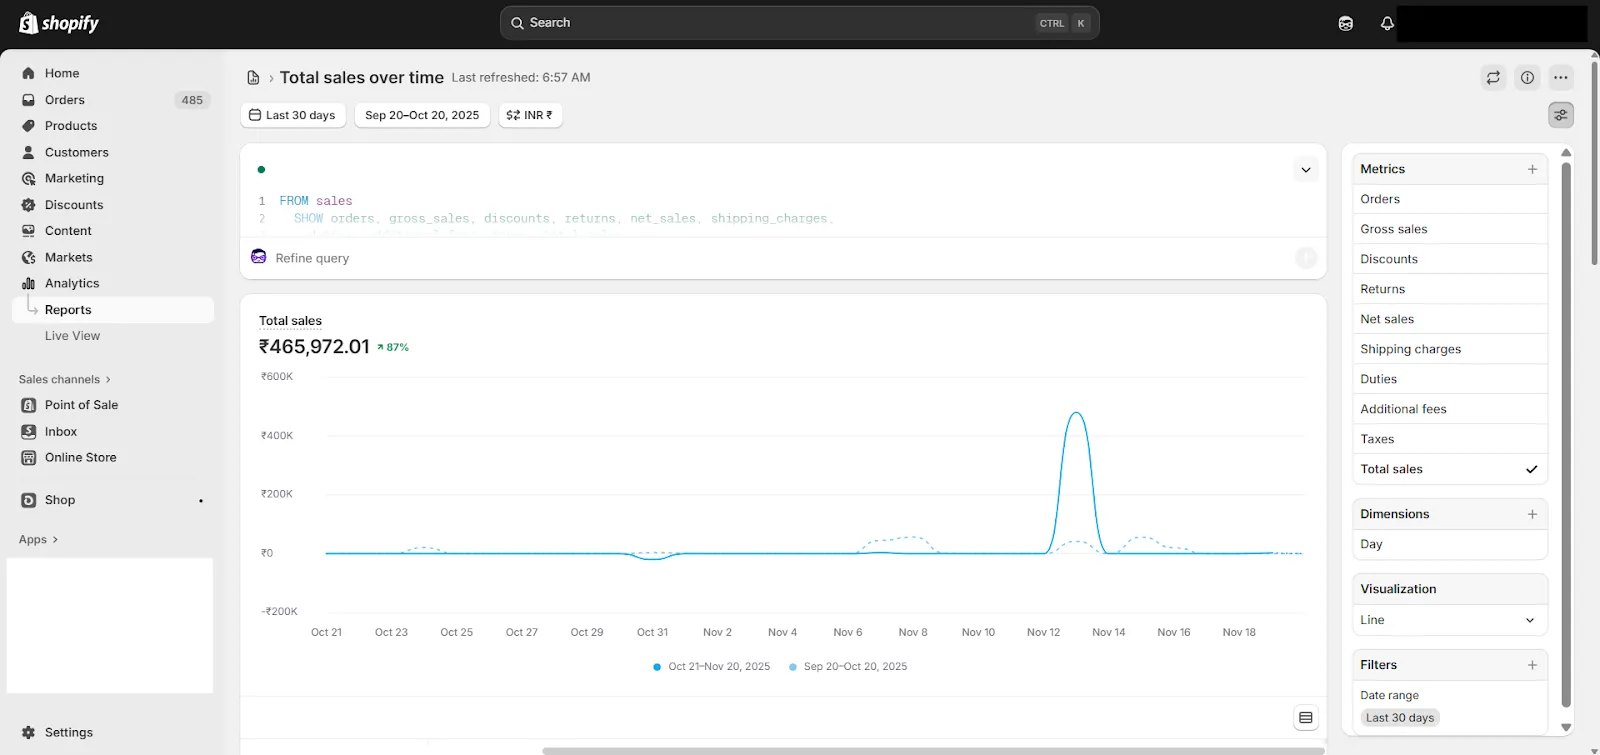
While modifying this report, you can customize the metrics, dimensions, filters, and date range to get exactly what you want.
- Add a date range to select timeframes.
- You can group the report by hour, day, week, month, or year for granular reporting
- You can also add or remove the metrics like
- Gross Sales
- Net Sales
- Returns
- Discounts
- Shipping
- Taxes
Which metric mix tells the real story
Understanding sales performance is not only about dealing with the numbers; but by combining the right metrics, you can find out what your total sales are.
- Pairing Net Sales with Order Count
Using these metrics in your reports will help you identify whether revenue is generated by higher pricing or higher sales volume.
- Comparing AOV with Discounts
Tracking AOV with discounts shows when promotions are cutting into margins
- Including Returns and Refunds
Using returns and refunds metrics in the report helps you plan cash flow and inventory stocks.
What additional metrics and dimensions can you incorporate beyond the defaults
Shopify's pre-built report is suitable for basic reporting, but you can further enhance it by adding extra metrics and dimensions to gain a deeper understanding of your sales performance. You can enhance your sales analysis by adding:
- Breakdown by Order Type and Sales Channel: Using these metrics will help you to differentiate between the order types (canceled, completed, or drafted) and Sales channels (POS, Online) to understand where the revenue is generating more.
- Transaction Fees: Basically, Shopify doesn’t provide to review of transactions for a selected time period for you need to integrate payment gateways or third-party apps to view transactions.
- Order Tag and Customer Tag: Segmenting your sales report using tags compares tag patterns across location, time period, and shipping carriers to organise customers into groups that drive the most sales and engagements.
- Staff Analysis: Analysing order volume or value by staff member to evaluate team performance, especially for POS.
- Estimate Product Margin: You can calculate the product margin by subtracting costs from Net Sales to track profitability when cost data is available.
Which segments change the conclusion
Not all Sales report works the same across your store, and segmenting your report into insightful data is important to understand your store's performance.
- Channel Segments: This shows different behaviour patterns of your customers in POS and online sales channels.
Example: Filter by channel
Filtering the Total Sales Over Time report by sales channel/ location/ product or customer helps you analyze sales performance for each channel separately. It reveals trends and growth opportunities per channel and other dimensions. You can compare channels to optimize your sales strategy. It aids inventory allocation based on channel demand. It also tracks the impact of channel-specific promotions and discounts.
- Location Segment: This segment allows you to identify product demand across warehouse or POS locations.
- Product Segment: The product segment group sales by collection, category, and best-selling or higher margin items to manage inventory and marketing
- Customer Segment: This segment helps you to analyze and categorize your first-time customers, returning customers, and the loyal ones based on VIP, Wholesalers, or Newsletter subscribers.
When is Shopify not enough for deeper analysis
For unique and customized reporting, it is crucial to compare your data, which helps in analyzing the report while scaling the store. And here’s what you can do to automate your reporting in easy ways.
- Products Sold vs. Current Inventory: Shopify's native report does not show "products sold over time" next to "current inventory quantities" in a single view, and you’ll need an external BI tool or app to merge these datasets for stock replenishment.
- Order Creation vs. Fulfillment Date: You cannot compare the order creation date and fulfillment date side-by-side to analyze fulfillment speed or delays natively. You need to export orders and consolidate these dates using Excel or advanced apps.
- Metafields, Line Item Properties, Notes: Shopify default reports do not give additional fields like custom metafields, line item properties, or note attributes, limiting detailed analysis.
- Return Location Analysis: Shopify does not provide easy segmentation of return transactions by location, especially for comparing online vs. POS returns and for which you need additional reports or custom tags.
- Flag Edited Orders: Shopify does not offer an edited order flag natively, and you’d need to track manual adjustments through order notes, apps, or export with edit tags.
- Tax Details (Region/Type): Tax reports are basic, but Shopify lacks breakdowns of Tax by region or tax type. It requires exporting data in a spreadsheet or BI tool for deeper analysis.
- Order Status Segmentation: Although you can filter for paid/unpaid, partially refunded, etc., you may need advanced custom filters or apps for accurate segmentation.
How to keep this report working on its own every week
Automating delivery and formatting to show the Grand Total on top, column grouping, and detailed reports ensures your team receives accurate, updated insights on a consistent schedule without requiring any manual effort.
- Scheduling Reports: Report Pundit will allow you to schedule exports over time to export to (CSV/Excel/Google Sheets/PDF).
- Automated Delivery: It allows you to send scheduled reports via email, Slack, Google Drive, or FTP, ensuring all stakeholders have shared, always-updated data on hand.
- Column Management: It enables freezing columns, rearranging fields, subtotals, and various formatting options (currency format/ decimal format) so that comparisons are clean and consistent over time.
Conclusion
Understanding how your sales change over time is key to running a successful store. It is not just about knowing about revenue but also about understanding the story behind it. The Total Sales Over Time report gives you a clear view of how your store is performing, helping you spot trends, seasonal changes over time. It highlights the results of your marketing efforts, helping you see what’s working and where adjustments may be needed.
With the right filters and metrics added, this report works amazingly, which supports decisions like inventory, promotions, and overall strategy. It’s one of the key reports for tracking growth and improving your business and revenue over time.


Build and automate your
Shopify Reporting
Unlock the full potential of your Shopify store with Report Pundit.
Gain access to over 2000 data fields, automate reports, and make
data-backed decisions to grow your business.