Get Accurate Shopify Inventory Value Across All Your Stores

.svg)
.svg)
.svg)
Managing inventory efficiently is crucial for any e-commerce business. Shopify provides a built-in “Month-end Inventory Value” report under Shopify Analytics, which helps you understand how much your previous inventory is worth.
Here we will see what the Shopify Inventory Value Report does, where it falls short, and how using better reporting tools can help you track your stock, get insights to manage your inventory more easily.
Shopify Inventory Value Report
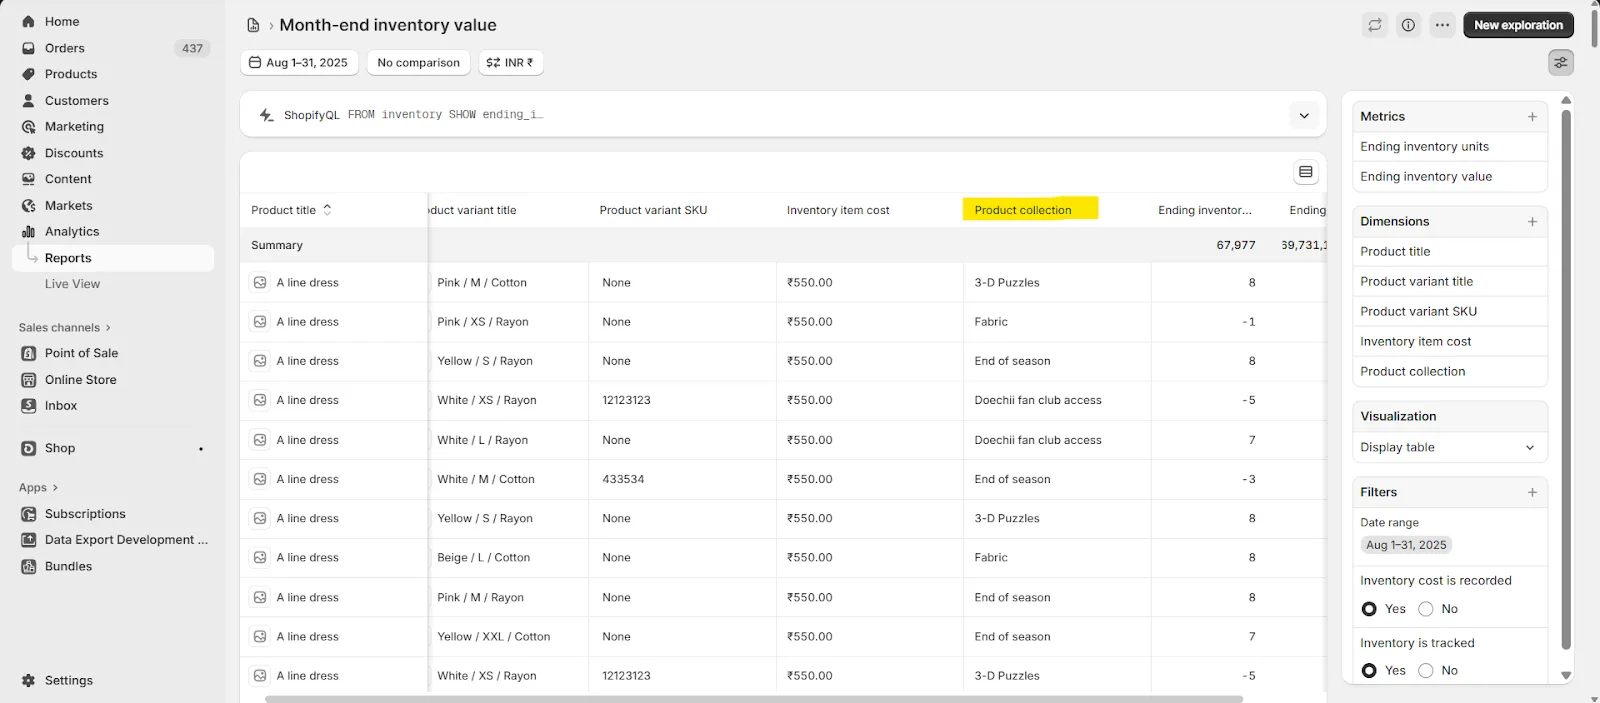
Shopify’s Month-end Inventory Value Report shows the value of your stock at a given point in time. By adjusting the date range, you can view both current and past inventory values.
This report shows product variants that have had changes or sales activity in the last three years. It doesn’t include items that are already reserved for unfulfilled orders or products that are still on the way from suppliers.
For a detailed look at your inventory, you can also check other reports such as the Month-End Inventory Snapshot, Daily Inventory Sold by Product, and ABC Product Analysis.
The Shopify Inventory Value Report helps you to understand the total value of your stock at any given point in time. It provides a clear snapshot of product quantities and costs, essential for accurate financial reporting. The report also includes ending inventory data, which shows the inventory position from the previous day, helping your store to track changes in stock levels and reconcile daily or monthly balances.
- Selecting “Today” in the report date range will show your previous day's ending inventory value, i.e., the total value of all available items in your store.
- By selecting a past date or a specific month, you can view historical inventory data, though this information is limited compared to what advanced tools can offer.
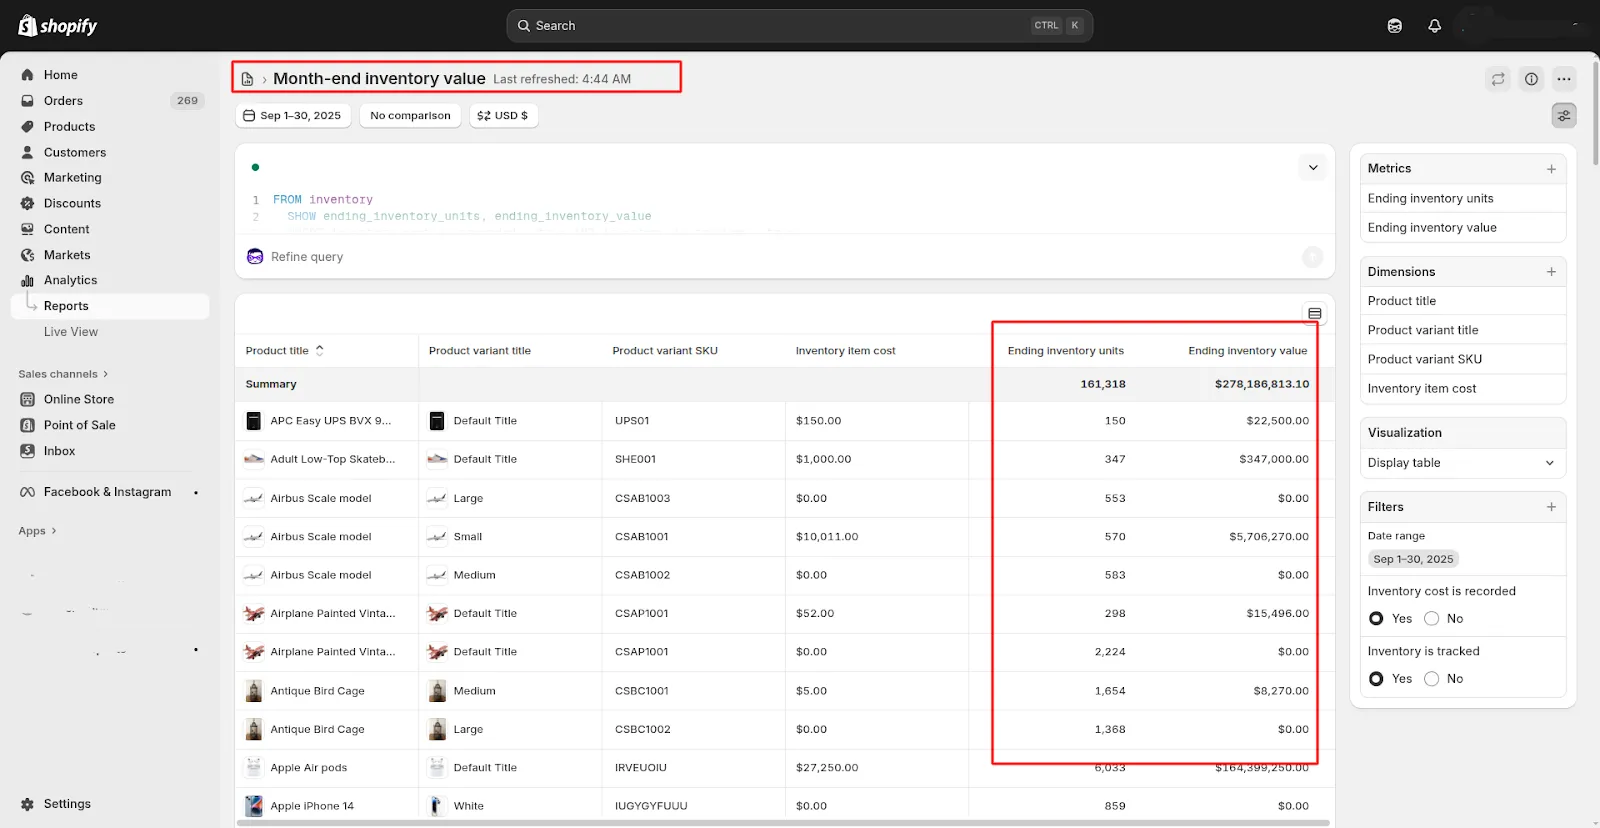
This report is helpful for quick assessments of your store’s stock worth and provides detailed insights that modern e-commerce businesses often need.
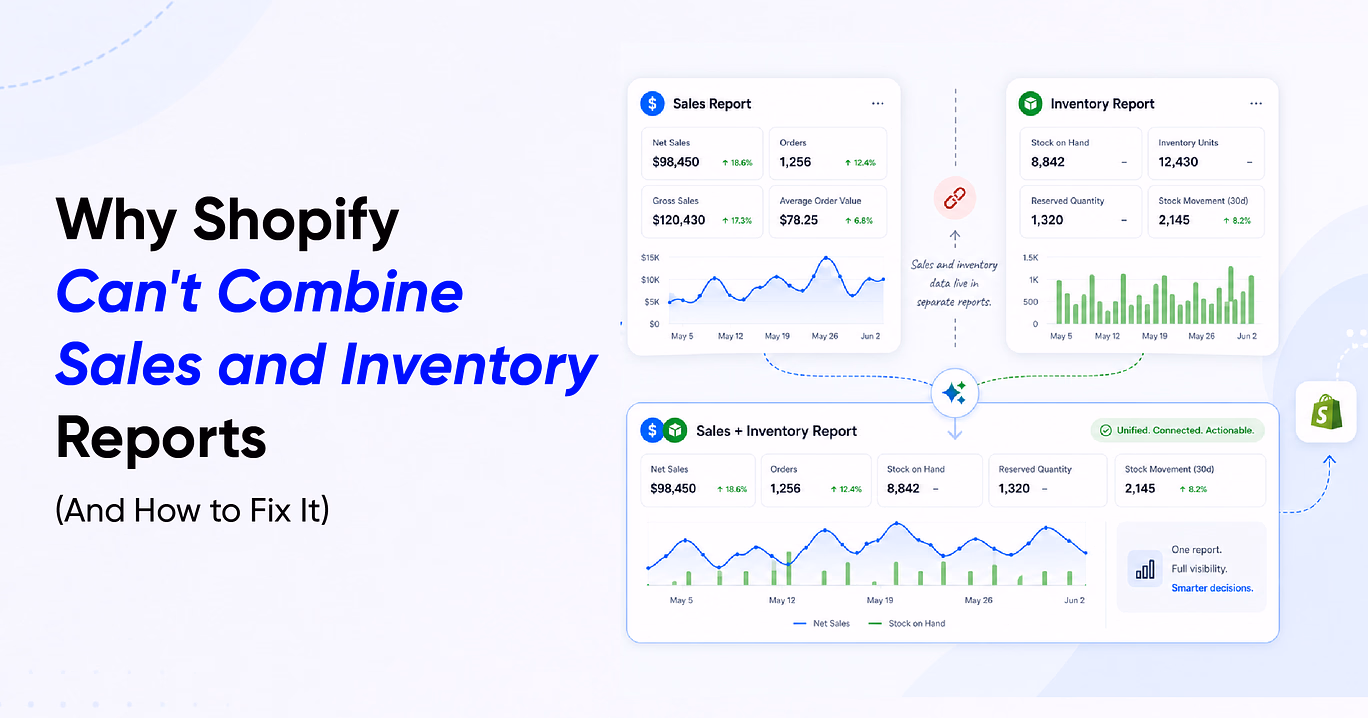
Advanced Analytics Beyond Shopify
With more advanced analytics, you can track inventory performance, spot potential issues before they impact your business, and make smarter decisions about restocking, pricing, and promotions. This deeper view helps you manage your inventory proactively rather than just reacting to current stock levels.
While the Shopify Inventory Value Report gives a surface-level view, several critical insights are missing:
1. No Breakdown by Location
Shopify’s native report doesn’t allow you to view inventory value by published channel or physical location (for example, Online Store vs. POS). Some of the key insights they missed are:
- You can’t filter by warehouse, fulfillment center, or published channel.
- This makes it difficult to understand how inventory is distributed or performing across different parts of your business.
2. No Pricing or Margin Insights
- Product price
- Gross margin = (Net sales / Gross Profit)
Without these insights, it’s impossible to analyze profitability or identify products with high holding costs and low returns.
3. Limited Automation & Export Options
Shopify doesn’t support automation for report delivery. You cannot schedule exports or automatically send reports to Google Sheets, FTP, or Email.
You must manually export the reports every month, which can be time-consuming and prone to human error.
Metrics Used in the Shopify Inventory Value Report
Before going into the metrics, it’s important to understand why the Shopify Inventory Value Report matters. This report helps you track the value of their inventory by monitoring stock levels.
The Shopify Inventory Value Report primarily includes these metrics:
- Product title – The name of the product in your store.
- Product variant title – The specific version of the product, such as size or color.
- Product variant SKU – The unique identifier assigned to each product variant.
- Inventory item cost – The cost of a single unit of the product.
- Ending inventory units – The total quantity of the product currently in stock.
- Ending inventory value – The total value of the remaining inventory (units × cost).
These fields give a quick view of what you have in stock and its total value, but they don’t show more detailed information like stock by location, how fast items are selling, or which products have been sitting in inventory for a long time.
Understanding Your Advanced Inventory Value Report
Report Pundit is an advanced reporting app that works beyond Shopify’s native reports. Let’s explore how it enhances the Inventory Value Report and helps you get insights.
a) Month-End Inventory
This report only shows how much stock you have right now and doesn’t keep a record of what your inventory looked like at the end of previous months. This means you can see current inventory values, but to track changes over time, you can use features like inventory snapshots or set up the report to be sent automatically at the end of each month.
This process allows you to build a consistent month-over-month record of inventory values without manual effort.
Note: Automate your month-end exports in Report Pundit to create a reliable historical inventory record for trend analysis.
b) Total Inventory Value
The report shows the value of your inventory, including product quantities, variants, collections, and total worth based on current sale prices, for better analysis and decision-making. This report shows your Current Total Inventory Value Report, giving you a complete overview of your stock’s worth.
Additionally, this report can be customized to display inventory value based on:
- Location
- Product Type
- Vendor
- Variant Size
- Variant Color
These dimensions help identify which product lines or warehouses carry the highest value, allowing smarter purchasing and stocking decisions.
c) Inventory Value by Location
This report lets you see how much your stock is worth at each location, like different warehouses or fulfillment centers. As this shows only what you have right now, not past inventory. To track changes over time, you will have to turn on Inventory Snapshot, which automatically records your stock levels every day.
How the Inventory Snapshot Enhances the Inventory Value Report
The Inventory Snapshot feature is an amazing feature for inventory tracking in Report Pundit.
- Once you enable the Inventory Snapshot, we automatically records the inventory quantity at a fixed time every day, specifically 12:00 AM in your store’s local time zone.
- This means you don’t have to manually track inventory changes or rely solely on real-time stock levels, which can fluctuate throughout the day.
- You can use these snapshots to generate reports such as:
- Daily inventory value trends
- Inventory movement by product
- Stock aging and turnover reports
- Daily inventory value trends
This feature transforms Shopify’s inventory data into a dynamic, time-based dataset, perfect for trend analysis and replenishment.
Case Study
One of our merchants needed an accurate inventory value report for his toys and gifts store for August 2025 to evaluate stock levels and make data-driven decisions. Without precise reporting, tracking inventory value for financial reconciliation and planning was cumbersome.
Our team provided them with a detailed Inventory Value Report showing product quantities and their values. This allowed them to assess stock value, plan procurement, and manage inventory more effectively. As a result, they could instantly verify stock levels, improve month-end reconciliation accuracy, and identify slow-moving items to optimize purchasing strategies.
The Shopify Inventory Value Report empowered our customers with actionable insights that brought clarity to their inventory data. It enabled them to make smarter business decisions, ensure accurate financial reporting, and manage stock more efficiently. This demonstrates how effective inventory reporting can transform the way eCommerce businesses monitor, plan, and optimize their operations.
Conclusion
In short, a basic Inventory Value Report shows an overview of how much your stock is worth, but it doesn’t give you the detailed insights to automate updates or the flexible reporting to manage your inventory efficiently.
Advance apps address these limitations by providing:
- Customized inventory reporting by location, product type, or vendor
- Automated monthly exports to Google Sheets or Email
- Daily/Month-end inventory snapshots for trend tracking
- Flexible data segmentation for better decision-making
By using advanced apps, you can go beyond static inventory values and get current inventory, actionable data into your inventory, leading to smarter purchasing decisions, reduced overstocking, and improved cash flow.


Build and automate your
Shopify Reporting
Unlock the full potential of your Shopify store with Report Pundit.
Gain access to over 2000 data fields, automate reports, and make
data-backed decisions to grow your business.