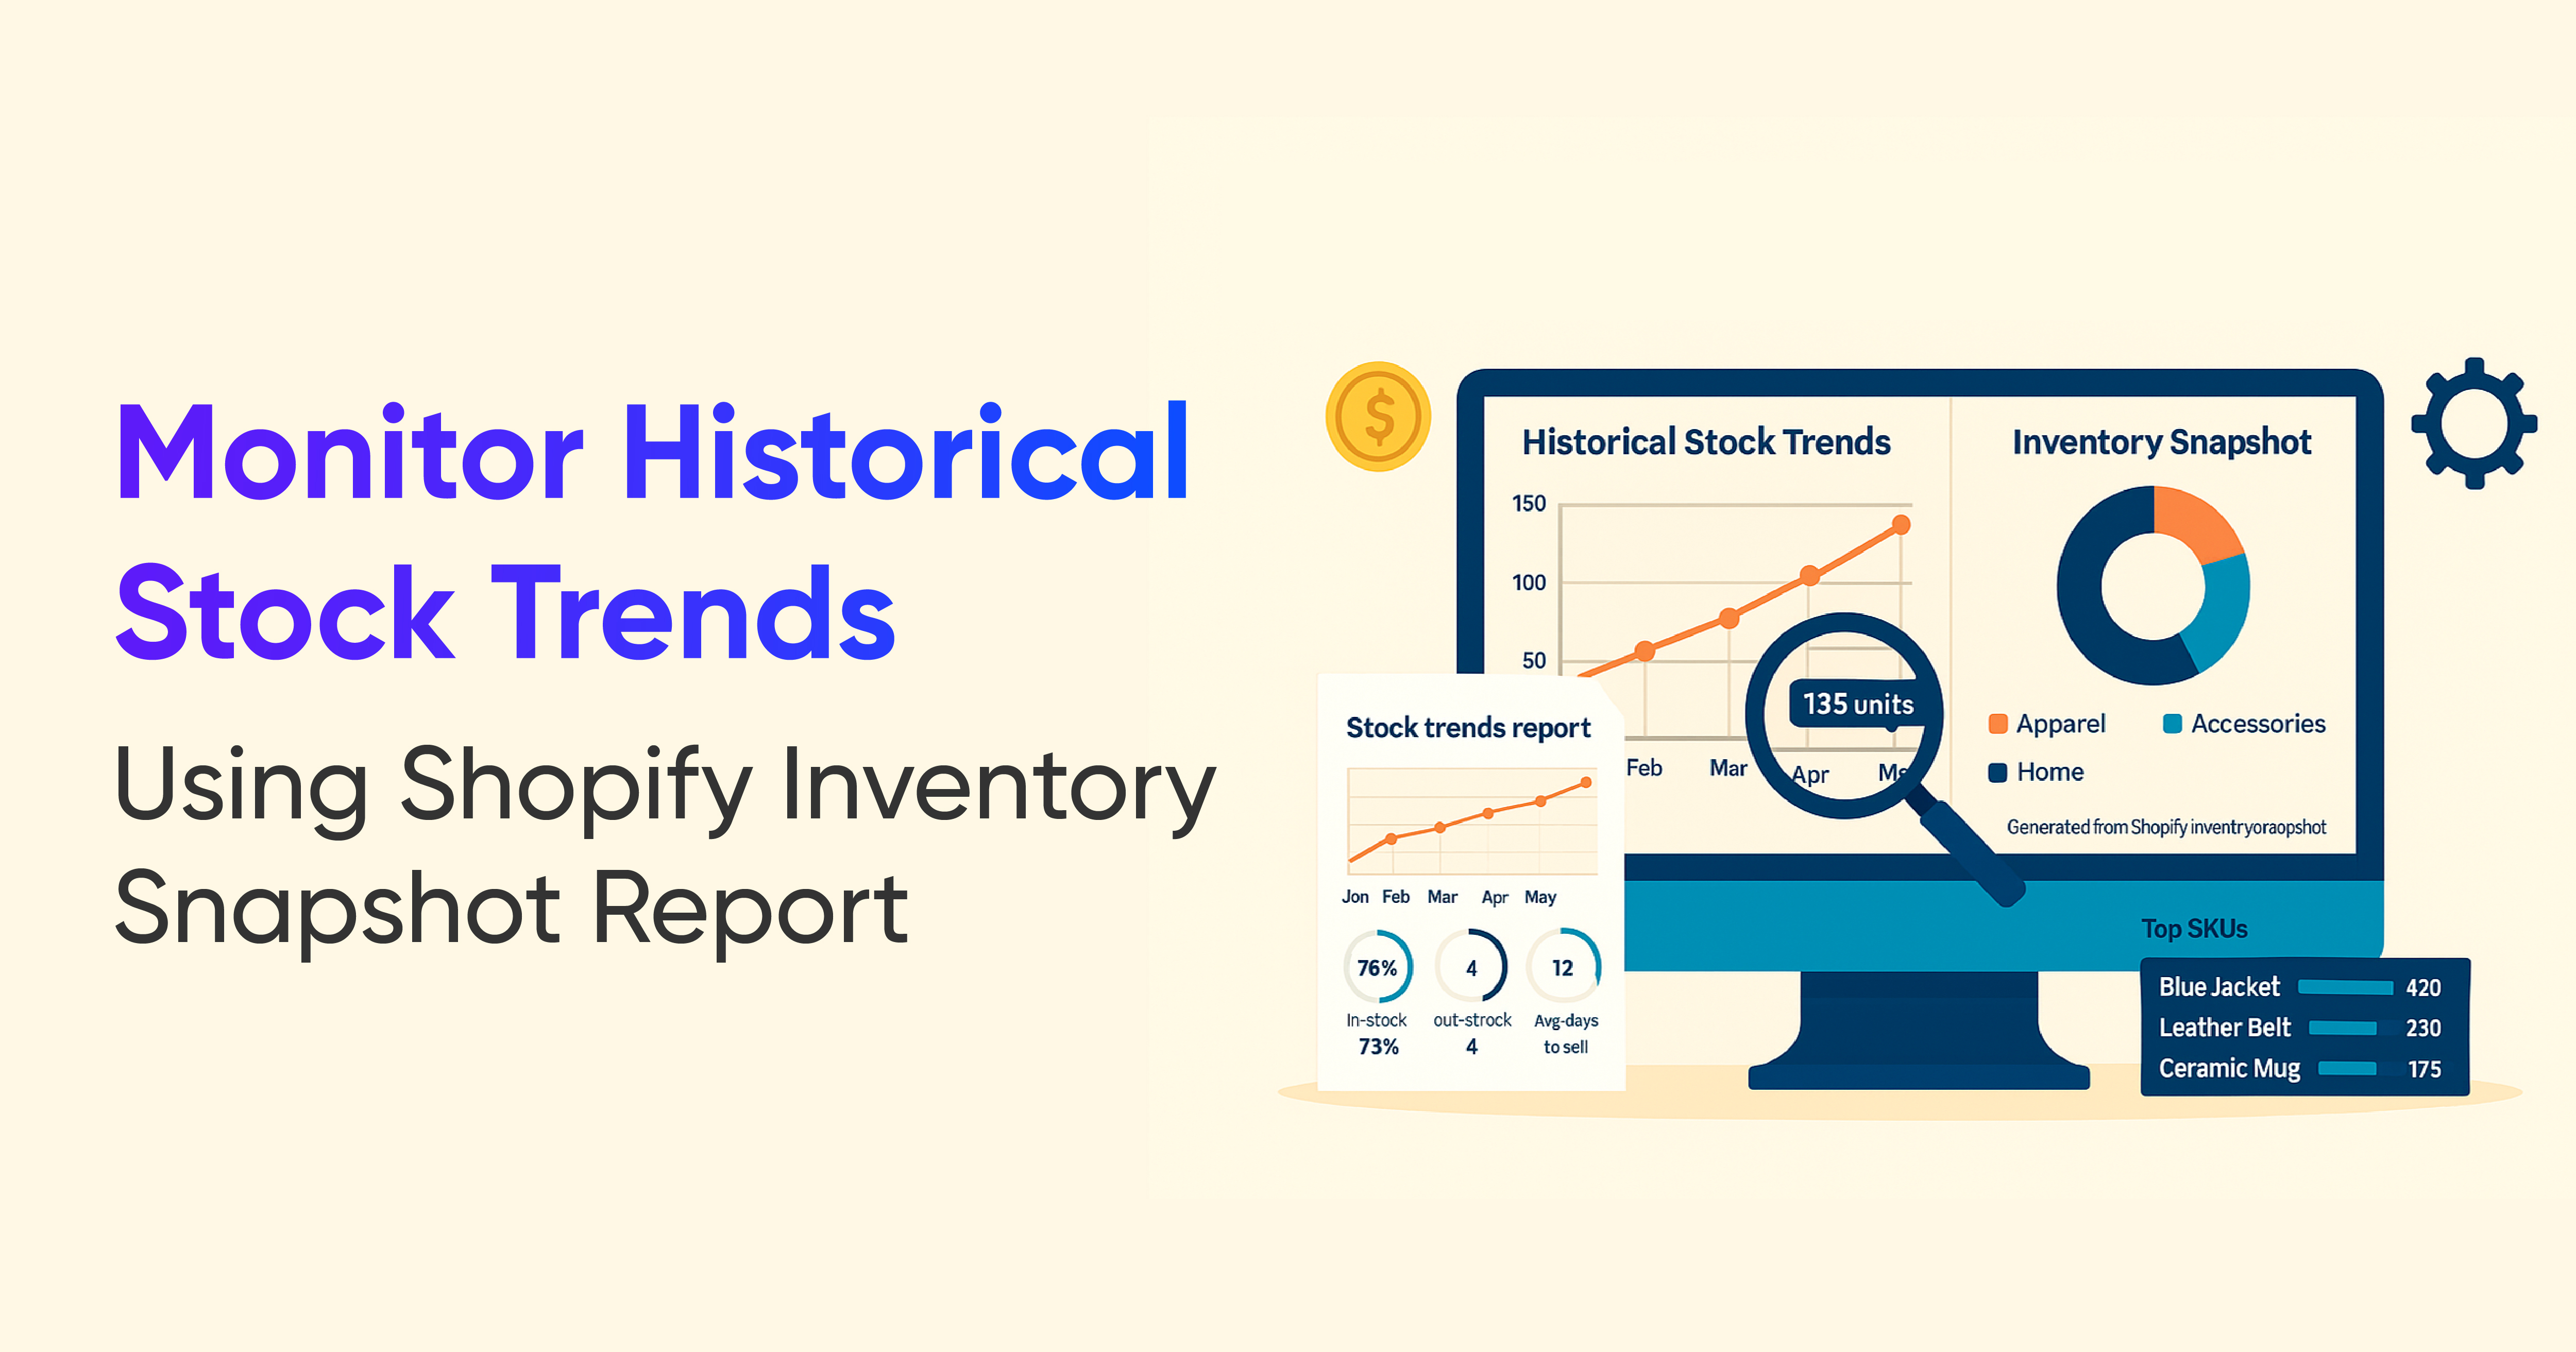
Monitor Historical Stock Trends with Shopify Inventory Snapshot Reports

.svg)
.svg)
.svg)
Understand what Shopify inventory snapshots are, why historical stock data matters, and how to use it for better tracking, audits, and smarter purchasing decisions.
A Shopify inventory snapshot is like taking a daily photograph of your stock. At the end of a day, week, or month, the snapshot locks in the exact quantity of each product and variant you had at that time.
These are not just dry numbers. Over time, snapshots turn into a historical timeline of your inventory. They help you:
- Prove what stock you held on a specific date
- Support financial statements and tax filings
- See how stock levels and product performance change over weeks and months
For example, if an auditor asks for your stock levels on March 31, you can simply pull that day’s snapshot instead of trying to rebuild the picture from scattered reports and spreadsheets.
Past Inventory in Shopify Reporting: Current vs Historical View
Shopify makes it easy to see what you have in stock right now. If you go to Products → Inventory, you can view current quantities, recent adjustments, and available units across locations.
For historical views, Shopify provides month-end inventory data inside reports. These month-end snapshots help you:
- See how much of each SKU you held at the end of a reporting period
- Compare inventory value from month to month
- Support accounting and reconciliation work
However, If you want to know what you had on a specific non month-end date, or watch daily trends across a season, you usually need a dedicated inventory snapshot report from a reporting tool.
When you combine:
- Current inventory (what you have today)
- Month-end views (what you had at closing)
- Daily or weekly snapshots (how stock moved in between),
you finally get a complete picture of how your inventory behaves over time.
Why Historical Inventory Data Is Essential for Accurate Reporting
Without historical inventory data, you are always estimating. You can see what you have today and what you had at the end of last month, but you do not clearly see what happened in between.
Historical inventory snapshots help you:
- Identify slow-moving items
You can spot products that started selling slower weeks ago, not just the ones that look stuck today. - Analyze sales and stock trends correctly
Instead of guessing how inventory changed over time, you see the actual quantities for each day or week. - Reconcile your books with confidence
Many accounting and tax tasks depend on accurate period-end stock values. Snapshots give you exact numbers instead of rough approximations.
With daily, weekly, or monthly snapshots, you can answer questions like:
- How much of this SKU did we have on a specific date?
- When did stock start to pile up on a product that used to sell well?
- At what point did we run out of a key item in a particular warehouse?
That level of detail gives your finance and operations teams the same single source of truth.
Spot Slow-Moving and Unsold Products with Historical Inventory Insights
Looking only at today’s stock can be misleading. A product might look overstocked now, but maybe it just arrived last week. Another product might have had the same quantity sitting for three months without moving at all.
Historical snapshots help you see:
- Which items have barely moved over the last few weeks or months
- When a product’s sales started to slow down
- Which products turned into dead stock and how long they have been stuck
With that insight, you can act early instead of waiting until cash is locked in unsellable inventory. For example, you can:
- Run targeted discounts or bundles on true slow movers
- Swap underperforming variants out of your assortment
- Reduce or stop reordering products that consistently sit too long
The goal is not just to clear shelves, but to prevent slow-moving stock from becoming a recurring pattern.
Make Smarter Inventory Decisions Using Historical Stock Data
Historical inventory data is also critical for proactive planning, not just cleaning up problems.
When you look at product movement across time, you can:
- Understand sell-through rate for each product or category
- See how quickly new shipments sell out
- Track the effect of price changes, promotions, or seasonality on stock levels
A good inventory snapshot report lets you combine metrics like:
- Opening inventory for a period
- Units received
- Units sold
- Ending inventory
From there, you can:
- Forecast how many days of stock you have left on key items
- Plan restocks based on real movement, not guesswork
- Decide which products deserve deeper buys for the next season
Filters for brand, location, product type, or vendor make it easier to zoom into the areas that matter most, like specific warehouses or top suppliers.
Track Where Your Inventory Was and Where It Went
Inventory management gets more complex when you operate multiple locations, warehouses, or receiving points. Products are constantly moving from suppliers to your main warehouse, then to regional stores or third party locations.
Historical inventory snapshots, combined with movement details, make it much easier to see exactly where stock was and where it went.
Common movement types include:
Incoming inventory: Stock successfully received at a new location
Incoming inventory is everything that arrives and is accepted into stock at the destination.
Example:
You order 100 T shirts from a supplier. All 100 arrive in good condition and are booked into your warehouse. Your snapshot for that day shows 100 units added as incoming inventory at that location.
This helps you confirm that:
- Purchase orders were received correctly
- Stock counts at the new location are accurate
- Future sell-through analysis has the right starting point
Rejected inventory: Damaged, incorrect, or unusable stock
Not every unit that arrives can be sold. Some items will be damaged, mis-shipped, or not match your purchase order.
Example:
Out of those 100 T shirts, 10 arrive torn or with printing defects. These 10 units are recorded as rejected inventory instead of being added to available stock.
Tracking rejected inventory over time helps you:
- See which suppliers have quality issues
- Understand how much potential stock never made it into sellable inventory
- Build cleaner claims and conversations with vendors
Restock adjustment: Returns and corrections to keep records accurate
Once you reject or return items, you need to adjust inventory so that both the sending and receiving locations stay accurate.
Example:
- You return the 10 damaged T shirts to the supplier.
- Your system adjusts inventory back at the supplier or removes them from your on hand counts.
- Your location now shows 90 units available, which matches what you can actually sell.
Historical snapshots that include these movements make it easy to reconstruct exactly what happened if there is ever a dispute, audit, or stock discrepancy later.
Conclusion: Use Historical Inventory Report to Improve Stock Control and Audits
Shopify inventory history reports give you more than a static count. They build a historical record of how stock levels change over time, across locations, and around key events like restocks or transfers.
By capturing inventory at regular intervals, you can:
- Reconcile accounting periods with accurate stock values
- Identify slow movers and dead stock before they tie up too much cash
- Plan restocks based on real movement rather than rough estimates
With consistent snapshots in place, your inventory decisions stop being guesswork and start being data driven. That means better cash flow, fewer surprises in your reports, and a much clearer view of how your products really perform over time.


.webp)
.webp)


Build and automate your Shopify Reporting
Unlock the full potential of your Shopify store with Report Pundit. Gain access to over 2000 data fields, automate reports, and make data-backed decisions to grow your business.