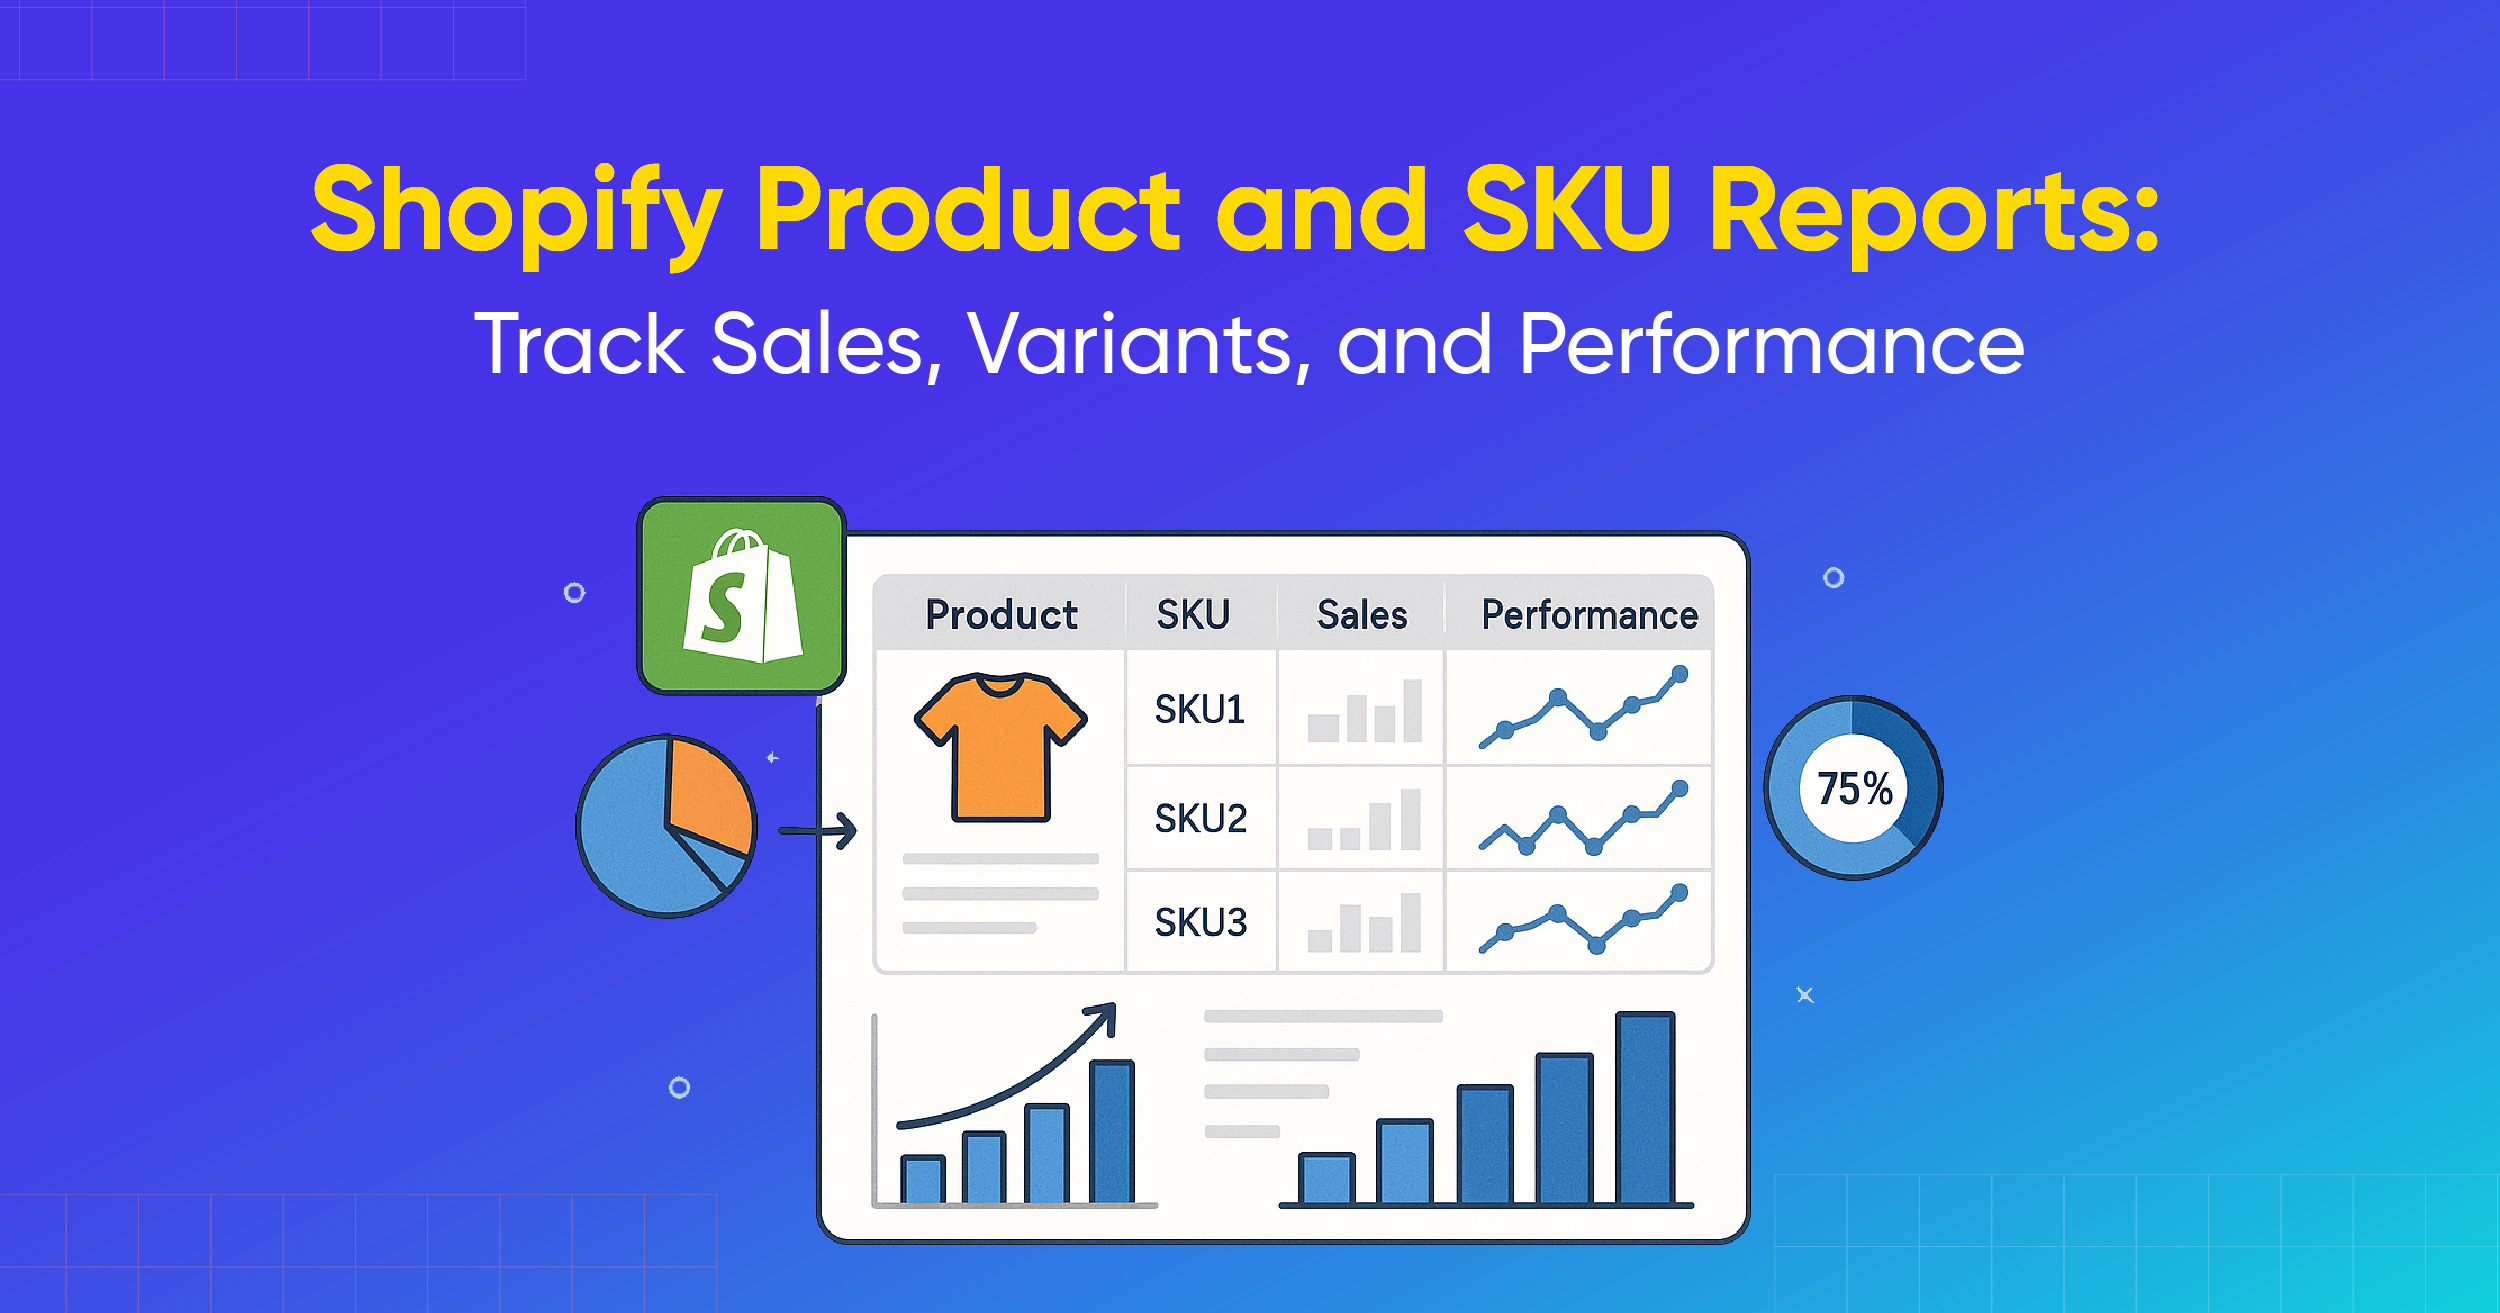
Shopify Product and SKU Reports: Track Sales, Variants, and Performance

.svg)
.svg)
.svg)
When you sell online, every item in your store needs a clear identity. In Shopify, a product is the main item you sell, such as a T-shirt, a pair of shoes, or a bag. Its different versions, like size, color, or material, are treated as variants under that product. To keep everything organized, each item gets its own SKU or Stock Keeping Unit, which is a unique code that helps you manage stock, track sales data, and avoid confusion.
So, basically, a product acts as the umbrella category that contains all its variations and SKUs.
Shopify Product & SKU Reports:
- Show how products are performing in terms of sales.
- Highlight best-selling products, product collections, and customer purchase trends.
- Help merchants identify revenue-driving products, items that may need promotion, and how variants are performing.
- Show sales data, like inventory sold and total stock value.
- Help you see which products sell best, product collections, purchase orders, how fast stock is moving, and the overall value of your inventory.
- SKUs (Stock Keeping Units) are unique codes for tracking product variants.
- Adding SKUs improves inventory accuracy, reporting, and order fulfillment
How to Get Product Report in Shopify
There are two ways to get the Product Report:
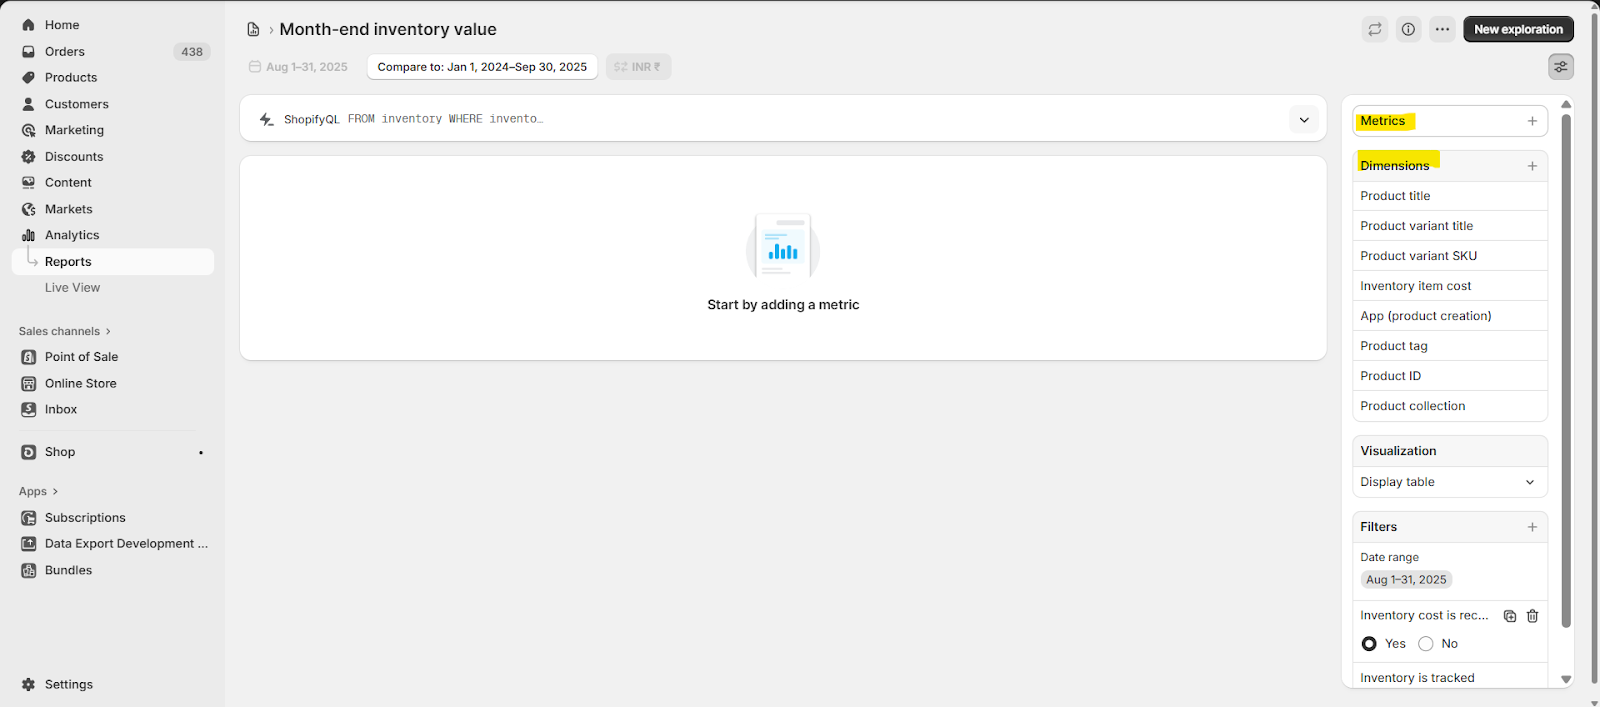
1: Go to the report section> choose inventory> remove all the metrics and add all the possible dimension fields for your report.
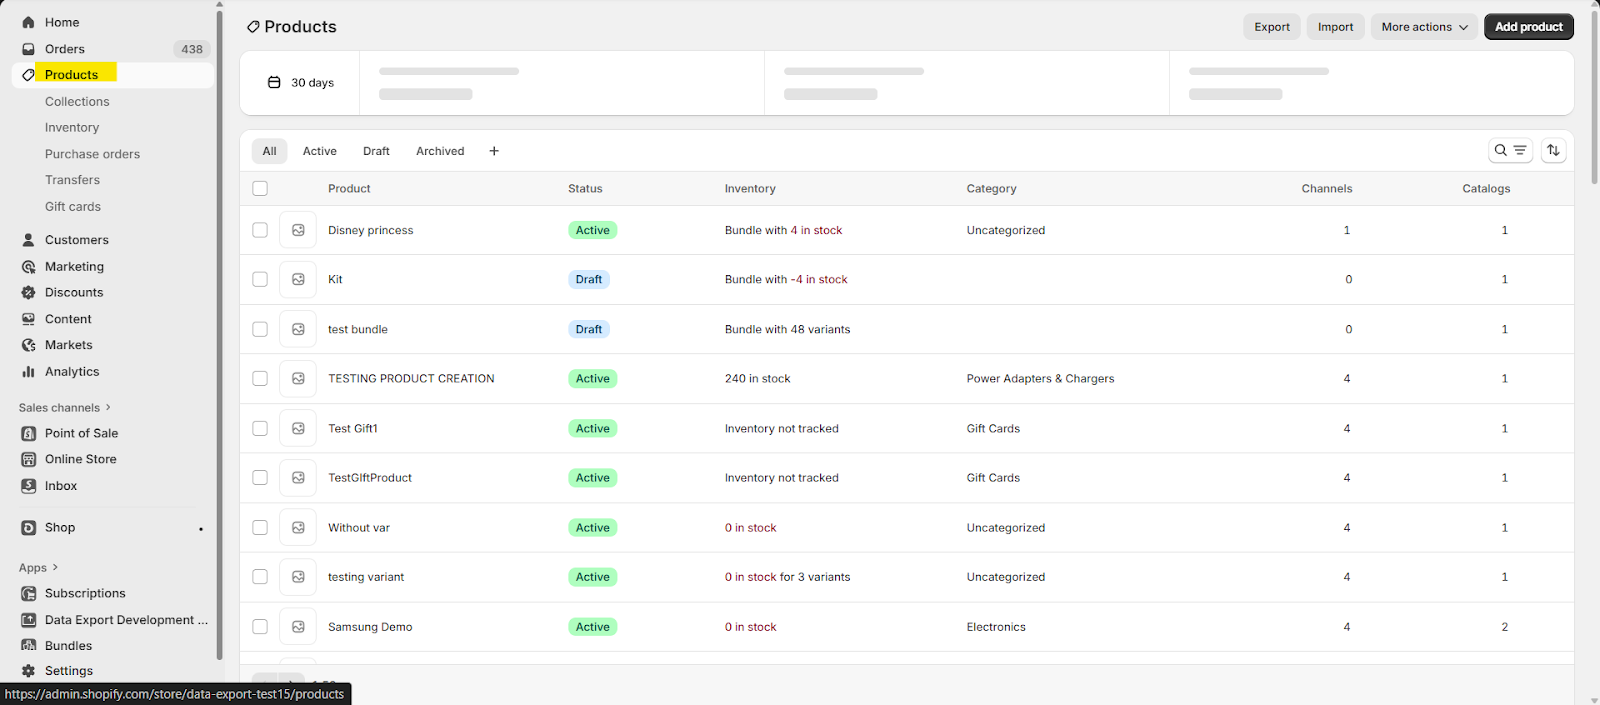
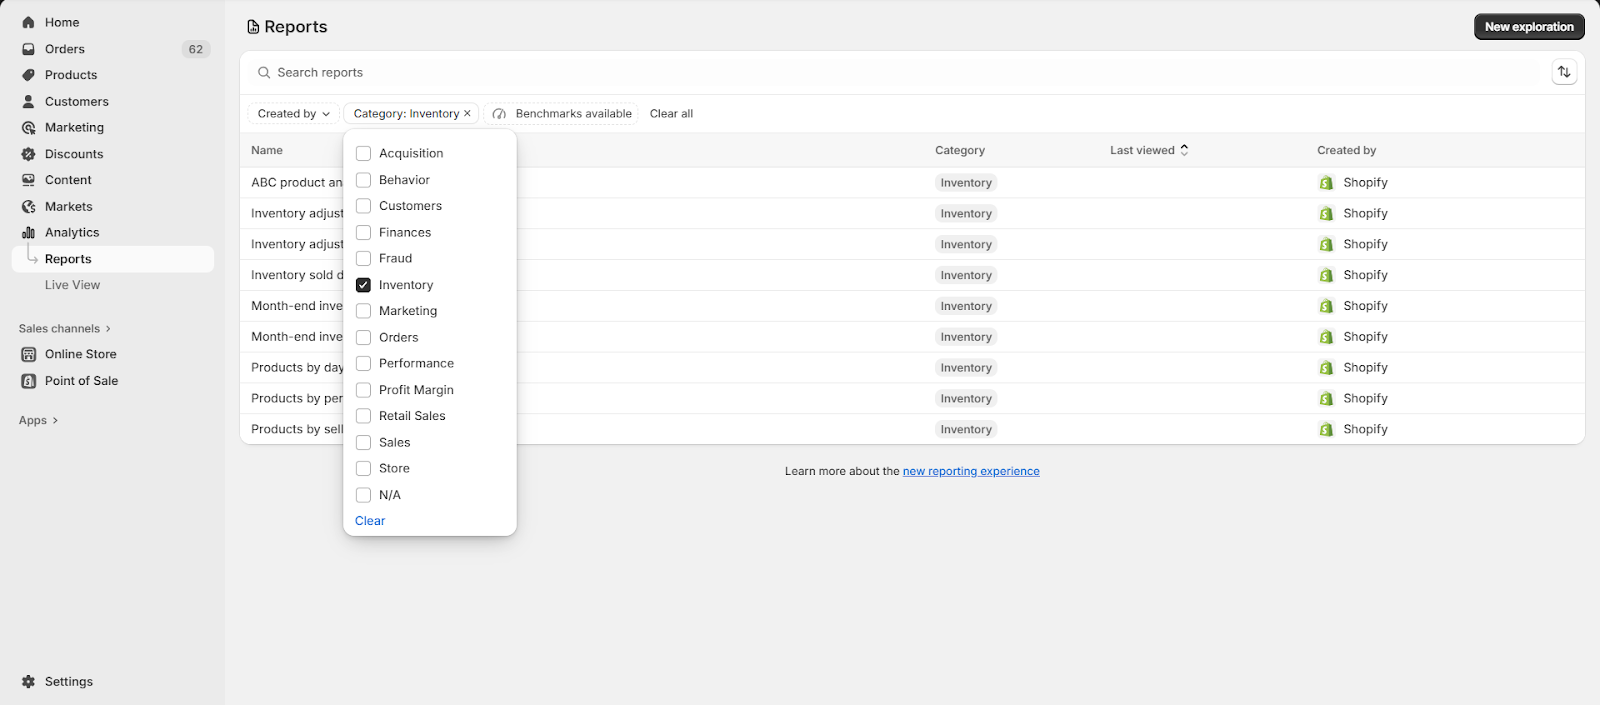
2: Shopify does not provide any pre-built and ready-made Product Report like other categories. Instead, there is a Products section in the sidebar where you can see product details. The challenge is that important information, such as current inventory, collections, purchase orders, transfers, and gift cards, is across different sections of the admin. So, to get overall information, you need to open multiple sections and collect the data manually.
Shopify does not have a ready-made Product Report like other report categories. Instead, you can use “Product Type” data through the Inventory Reports from the Dimensions section.

So, it's important to understand the difference between Shopify Products and Shopify Inventory Reports. Products show the items you sell and their details, while Inventory Reports give data on your stock levels and how they change over time.
Using both Product and Inventory reports together gives you insights into the store’s performance, but let’s take a closer look at the differences between the two.
Report Pundit Product and Variant SKU Reports
- Best Selling Products

As we already understood in the beginning that Shopify doesn’t provide a customizable “Product” report. And that’s where you may need the Best Selling Products Report in Report Pundit. It gives you a clear view of which products are driving sales, how much revenue each product brings in, and which products to restock, promote, or even phase out.
If you want a step-by-step breakdown of how it works, check out this detailed blog on the Shopify Best Selling Products Report.
Whether you manage a few products or thousands, this report makes it easy to spot your top performers and identify underperformers.
- Total Products Sold
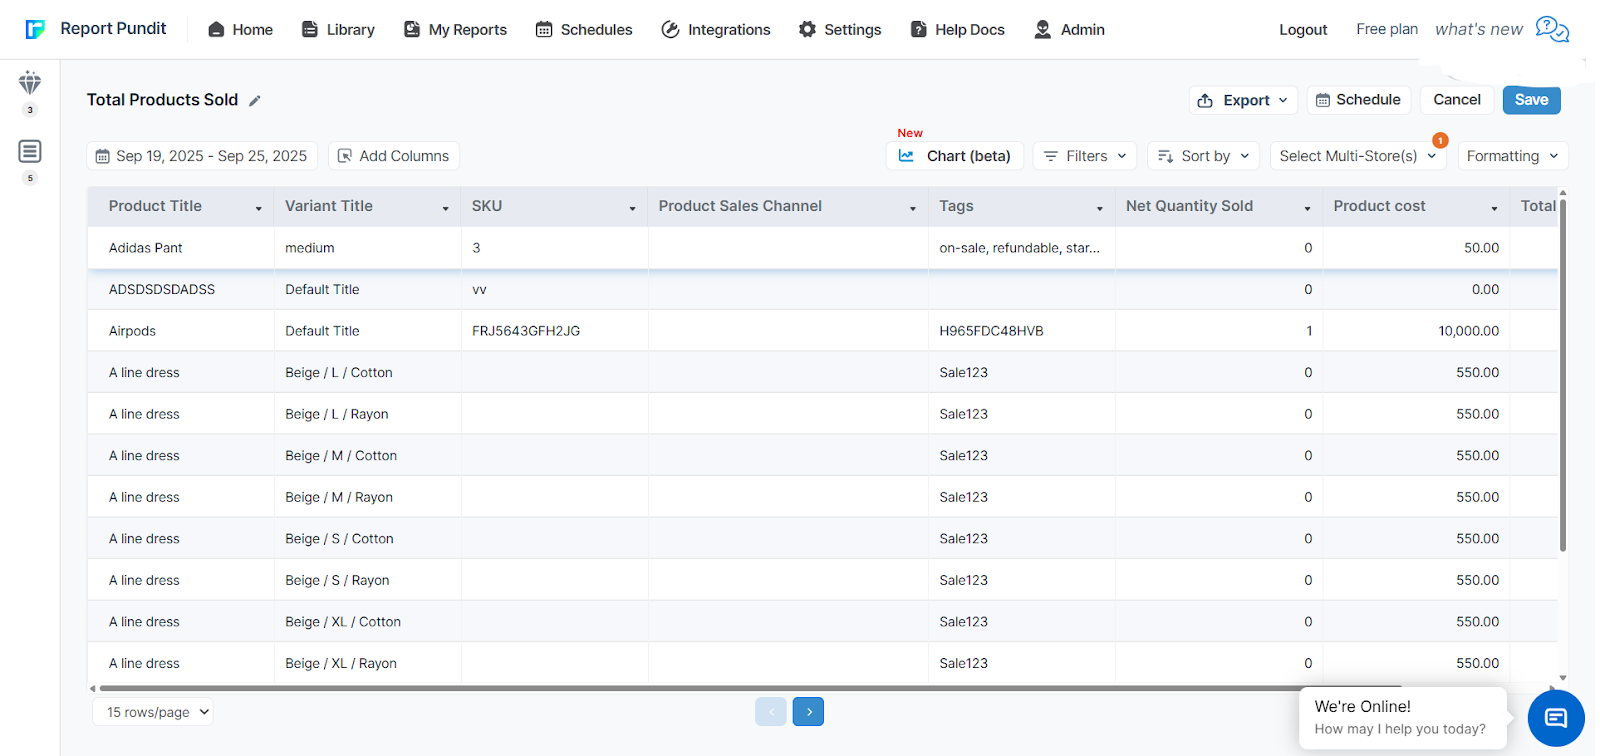
This report shows all the products in your store, whether they have been sold or not. For example, if you have five products and only two have sold, the report will still display all five.
It provides details for each product like Product title, quantity sold, and while the total products sold is calculated for a selected date range, the rest of the data remains static.
- Never Sold Products
This report highlights products in your store that haven’t made a single sale within a chosen time frame. You can look at unsold items over the past month, quarter, or year to understand which products aren’t performing. The Shopify Never Sold Products Report gives you these insights so you can take action.
With this report, you can easily spot products that did not sell in their first year, see which variants, such as sizes or colors, are still unsold, and compare products over different time periods to identify sales trends. This helps you make smarter decisions about inventory, promotions, and product planning.
For instance, you might run the report for the past quarter and find that certain seasonal items never sold. With this information, you could decide to run a clearance sale, bundle them with popular products, or stop restocking them in the future.
- Best Selling Collections
This report helps you to quickly see which collections are performing the best in terms of sales. The report makes it easy for you to spot top and underperformers so you can manage your inventory and marketing more effectively. You can learn more about how to track your collections in the Shopify Collections Report guide.
Key features:
- Sort collections easily – Quickly find your top-selling or lowest-performing collections.
- Sales-based sorting – Organize by Total Units Sold or Total Sales.
- Inventory insights – See current stock levels to ensure popular collections stay in stock.
- All Product
The All Products Report is a real-time dashboard that shows every product variant in your store across all SKUs, collections, vendors, and categories. It gives you a clear view of pricing, stock, metadata, and more for each product and variant. You can learn more about how it works in the Shopify All Products Report guide.
Also, it helps you understand your store’s performance by showing which products are selling the most each month, identifying vendors who consistently perform well, and highlighting any products that are hindering your revenue or profit margins. Overall, it gives you a clear view of what is driving sales and what needs attention to improve overall performance.
With the All Products Report, you can:
- Organize your product catalog – Create custom and smart collections for easier management
- Apply filters and tags – Track SKUs more efficiently
- Monitor inventory – Get insights across categories and collections
- Spot inconsistencies – Identify missing or inconsistent product descriptions
- Product by Collections
The Product by Collection Report gives you a detailed view of all product variants in your store, organized by Custom or Smart Collections, along with their available inventory. This helps you get a complete understanding of your products and stock levels. You can explore more in the Shopify Collections Report guide.
Key features of this report include:
- View all collections – Includes collections even if they haven’t made any sales
- Sales info by variant – See how each product variant within a collection is performing
- Filter unassigned products – Quickly find products not assigned to any collection
- Products by Vendor
This report gives you detailed insights into your Shopify store's products, organized by their vendors (suppliers). This report allows you to analyze product-level inventory and sales performance for different vendors, helping with inventory planning, vendor management, and profitability analysis.
The reports help you to:
- See how much stock is available and track inventory for each vendor.
- Check cost and stock details to plan purchases and reorders efficiently.
- Sort and filter data to focus on important vendors or product types.
- Evaluate vendor performance based on inventory and product availability.
- Make smarter purchasing decisions and negotiate better with suppliers.
- Products by Product Type
This report organizes your products by custom types or categories, giving you a clear view of how many units of each variant are available in your store.
It provides a summary grouped by product type and helps you track inventory at the variant level. You can also see sales, stock levels, and costs for each product type, making it easier to manage inventory and plan your business strategy.
- Sales by Product (existing products)
The Shopify Sales by Product Report is a simple report that shows how much money each product made, how many were sold, what you earned after discounts and returns, and the taxes collected. Using this report, you can see your best-selling products to promote more, spot items that aren’t selling well to fix or remove, and plan your prices, discounts, and stock better. You can learn more about how it works in the Shopify Sales by Product Report guide.
- Sales by Product Variant (existing SKUs)
This report provides a detailed view of your store’s sales for all currently available products. It shows net sales and the quantity sold for each variant, helping you understand how every product contributes to your overall revenue.
You can see how many were sold, how many were returned, any discounts applied, and the taxes collected. This gives you a clear picture of which product options are popular and which ones are not selling as well.
- Product Return Rate
Returns are the basic part of running an online store, but high return rates can signal problems with product descriptions, sizing, or customer expectations. This report helps you track and analyze returns so you can make informed decisions to improve your store.
You can accurately measure return rates for each product using fields like Product Name and Returned Quantity. This helps identify products with high return rates and uncover the root causes, which is crucial for effective Shopify product analytics. For a detailed walkthrough, see the Shopify Product Return Rate Report guide.
Misleading or incomplete product information is a common cause of returns. Fields like Return Reason, combined with customer feedback, often reveal recurring issues such as “Item not as described” or “Wrong size.”
- Product Combination
The Product Combination Report shows how customers group products in a single order, giving merchants real insights instead of guesses. This data helps you create custom product bundles, personalized promotional offers, and smarter product placement in collections or recommendations. You can learn more in the Shopify Product Combination Report guide.
- ABC Analysis
The ABC Analysis Report divides your products into three key categories that help you understand which items generate most of your sales and which ones need optimization. It gives you insights at the variant level by showing your performance of the products, and helps you track inventory across multiple locations. With real-time data, you can respond faster to market changes. For more details, please check out the Shopify ABC Analysis Report guide.
- Products by Tags
The Product Tag Report is a simple report that gives you valuable insights into your product catalog. It gives you the entire product list and captures all the tags you’ve applied, making it easier to organize and optimize your inventory. For a deeper guide on tracking sales by product tags, see how to track Shopify sales by product tags and why it matters.
Product tags not only help organize your store and improve the shopping experience by letting customers filter items by size, color, material, collection, season, and more, but they also provide insights for your business.
- Deleted product list
This report shows any products that have been deleted from your Shopify store. If a product is removed by mistake, you can use this report to get details such as product ID, name, variants, and SKU, making it easier to restore or track the missing item.
Conclusion
In short, Shopify provides basic product information, but you need to export all the data separately to get detailed insights. Report Pundit gets you comprehensive reporting that includes everything from product metrics to inventory details. Tracking products and variants extends beyond SKUs, as it involves understanding sales trends, product performance, and inventory. The report gives you clear data to get product-related insights and sales to optimize offerings and plan inventories accordingly.
Using these metrics allows you to stock up top performers, address slow movers, and make smarter inventory decisions

Build and automate your Shopify Reporting
Unlock the full potential of your Shopify store with Report Pundit. Gain access to over 2000 data fields, automate reports, and make data-backed decisions to grow your business.