Shopify KPIs: What to Track and How to Report on Them

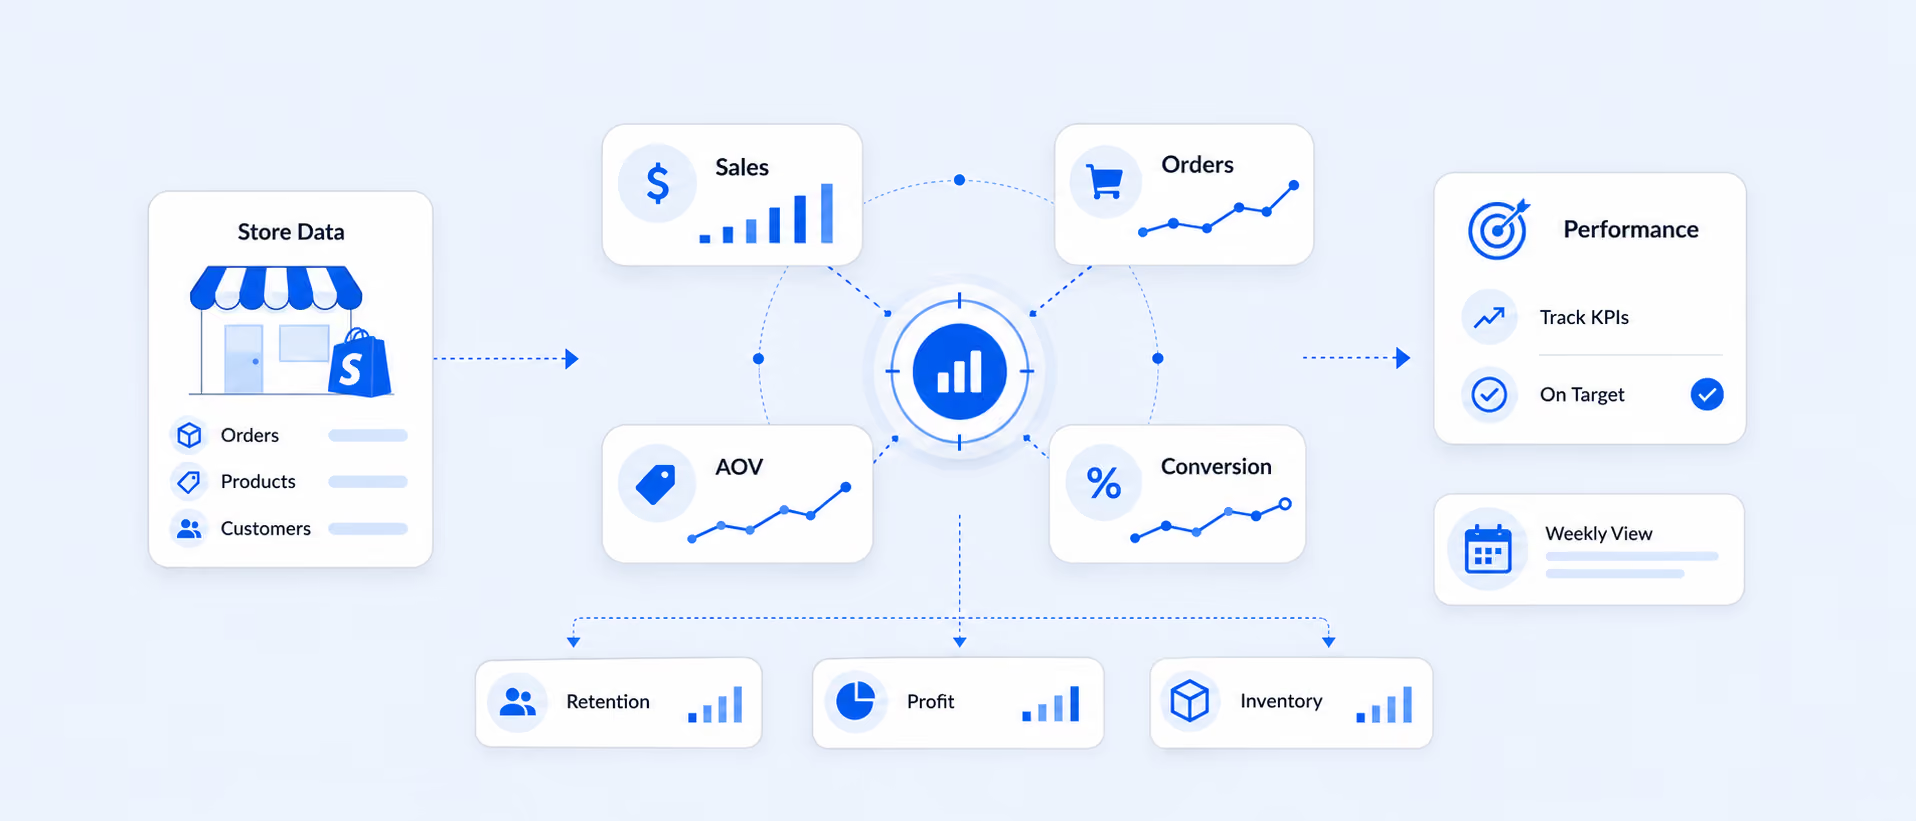
A Shopify KPI (key performance indicator) is a specific, measurable number tied to a business goal, like conversion rate, average order value, or repeat purchase rate, that tells you whether your store is moving toward or away from that goal. Unlike a raw metric, a KPI is chosen deliberately: it's the number leadership actually watches to decide what to do next. Most Shopify stores need somewhere between 5 and 7 core KPI categories to get a full, accurate picture of performance, not dozens of scattered numbers.
The right KPIs show what's working, where the gaps are, and how to protect your margins as you scale. From customer acquisition cost to average order value, they touch marketing, sales, product, and the overall customer experience, and they only matter if you're actually reviewing them on a schedule that fits your store.
What are the main types of Shopify KPIs?
Shopify KPIs generally fall into seven working categories: sales and revenue, marketing and campaigns, product performance, customer behavior, operations and staff, returns and discounts, and inventory. Some guides simplify this into four broader buckets, sales, marketing, customer service, and operations, but for a Shopify store specifically, splitting product and inventory out from sales gives you a clearer view of where problems actually start.
Here's the quick breakdown, with the KPIs most merchants track in each:
- Sales and revenue: sales growth, sales by channel, sales by staff location
- Marketing and campaigns: sales attributed to marketing, UTM-based attribution, ROAS
- Product performance: sales by product, sales by variant, return rate per SKU
- Customer: customer lifetime value (CLV), repeat purchase rate, first-time vs. returning customer split
- Operations and staff: sales per staff member, POS location performance
- Returns and discounts: refund rate, discount impact on margin
- Inventory: stock on hand, low stock alerts, inventory value
Each category answers a different question about your business, and none of them work well in isolation. A high conversion rate means little if your return rate quietly eats the margin.
Sales and revenue KPIs
Sales KPIs measure how well your store is converting traffic into revenue and whether that revenue is growing over time. The average Shopify store converts at around 1.4%, with the top 20% of stores converting above 3.2% and the top 10% above 4.7% (Littledata, 2023). That gap between median and top performers is usually where the real opportunity sits.
Sales over time report
This Sales Over Time report tracks your store's sales and order trends across a chosen period, so you can spot whether revenue is climbing, flat, or sliding. The formula for sales growth is straightforward:
Sales Growth = (Current period sales − Prior period sales) ÷ Prior period sales × 100
With this report, you can catch peak periods, spot early drops, track how promotions move the needle, and plan fulfillment ahead of demand spikes rather than reacting to them.
Sales by channel
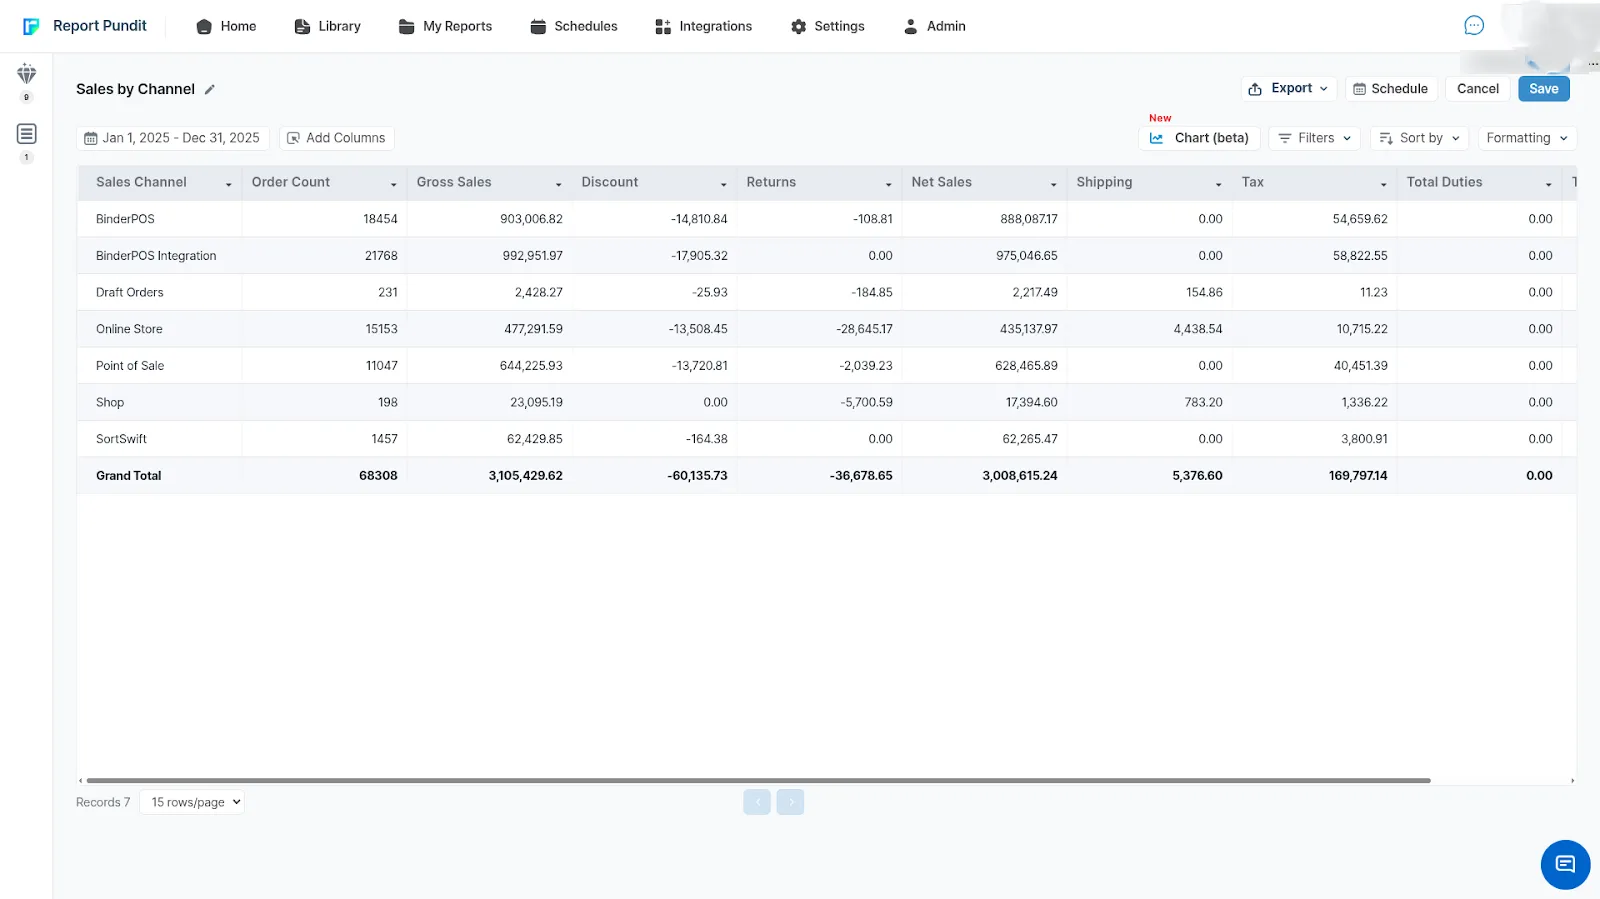
This KPI pulls sales data from every channel, your online store, POS, social integrations, into one view. It's the fastest way to see which platforms actually drive revenue versus which ones just generate traffic. Key things to watch: revenue by channel (gross vs. net), how discounts and returns affect each channel's margin, and whether ad spend on a given channel is actually earning its keep.
In our experience working across Shopify reporting setups, sales-by-channel Report is one of the most underused reports, most merchants default to a single "total sales" number and miss that one channel is quietly subsidizing another.
Marketing and campaign KPIs
Marketing KPIs show which campaigns are actually converting, not just generating clicks. The strongest marketing KPI setups track the full journey from first click to final sale, not a single touchpoint in isolation.
Sales attributed to marketing
When a customer clicks a marketing campaign and later completes a purchase, Shopify credits that sale back to the campaign. This tells you which campaigns generate real revenue rather than just impressions or clicks, and it's the metric that should decide where next month's ad budget goes. Read more about Sales attributed to Marketing Report
UTM report
UTM tracking shows exactly which links, sources, and mediums brought in a paying customer, not just a visitor. This UTM Report separates "our Instagram traffic looks great" from "our Instagram traffic actually converts."
In short, marketing KPIs tell you where to put next month's budget and where to stop. Catching an underperforming campaign two weeks earlier can be the difference between a wasted quarter and a profitable one.
Product performance KPIs
Product KPIs show which items and variants are actually earning their shelf space, both online and in inventory. They matter most right before a reorder decision, when you need to know which categories to double down on for the coming season.
Sales by product
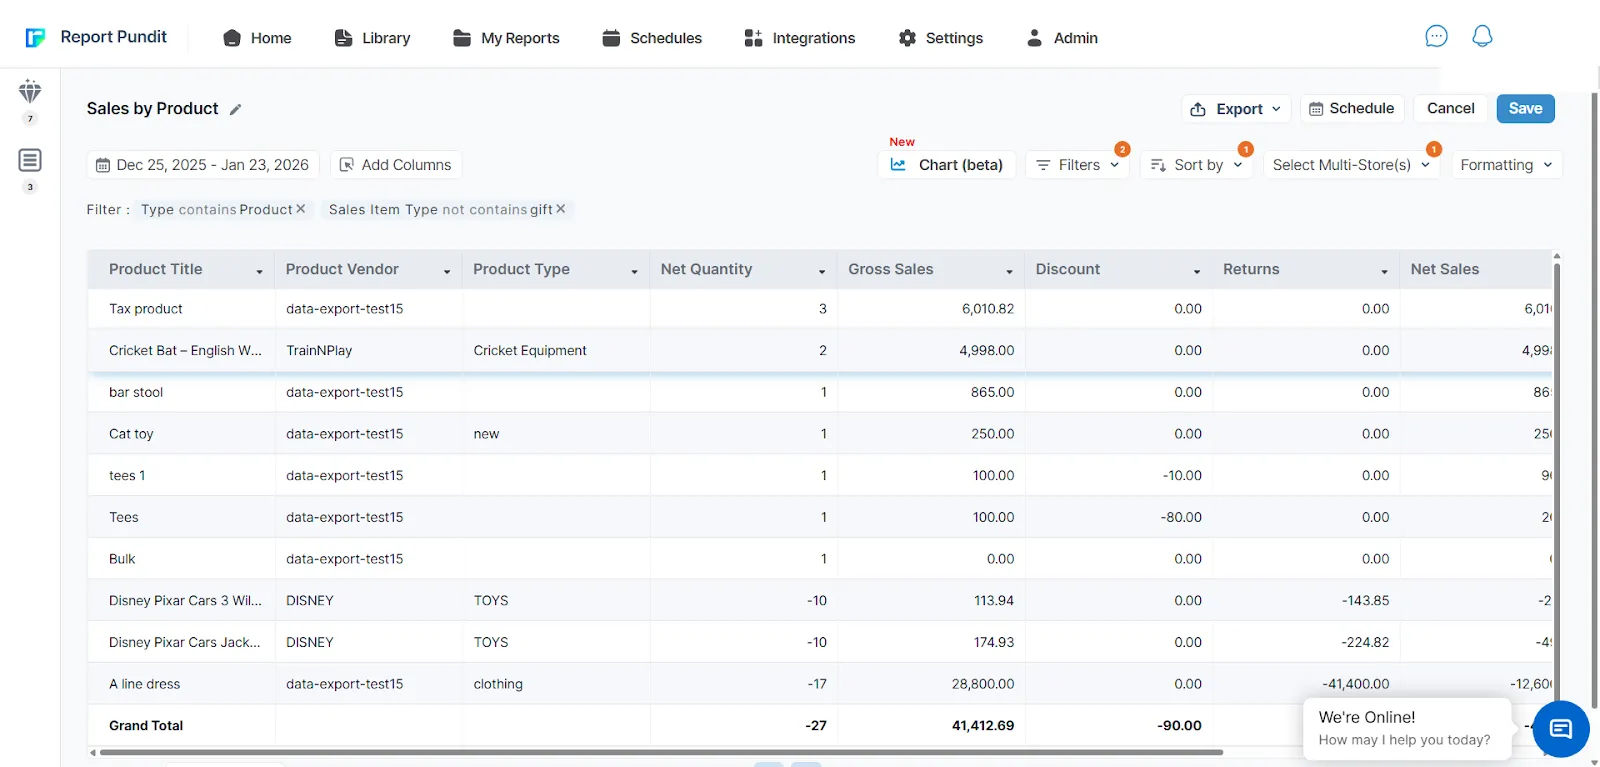
This Sales by Product Report tracks quantity sold, gross sales, discounts, returns, and profitability at the product level. A product with high sales but a high return rate might be worth less than a lower-volume item that customers keep.
Sales by variant
This Sales by Variant tracks Variant-level data (SKU, size, color) shows which specific configurations move fastest. Net Quantity shows demand, Net Sales shows actual earned revenue after discounts and returns, and Total Sales rolls in shipping, tax, and duties for the full billing picture.
Watching these together prevents two expensive mistakes: overstocking a variant nobody wants, and running out of the one that's actually selling.
Customer KPIs
Customer acquisition cost for ecommerce now averages roughly $68 to $87 per new customer as a blended figure across channels (industry benchmarks, Retainful and Eightx, 2025 to 2026), though it varies widely by vertical and channel. Because acquiring a customer costs 5 to 7 times more than keeping one, retention KPIs matter just as much as acquisition ones.
Sales by customer
This Sales by Customer shows total contribution per customer, gross vs. net sales, and customer lifetime value (CLV), which is the clearest signal of who's actually worth prioritizing for loyalty perks or early access.
First-time vs. returning customer sales
The First Time vs Returning Customer Sales Report helps you compare how new and repeat customers contribute to your sales. It shows whether your growth is coming from acquiring new customers or from existing customers making repeat purchases. This insight helps you balance your marketing, retention, and loyalty strategies.
Key indicators you get from the report:
- Customer Type
Separates first-time customers from returning customers, helping you measure retention and loyalty. - Order Count
Displays the number of orders placed by each customer type, showing purchasing frequency. - Total Spent
Shows total revenue generated by first-time and returni
Most valuable customers
This Most Valuable Customers surfaces your highest lifetime spenders by name, order count, and total spent, so retention and loyalty efforts go where they'll actually move revenue.
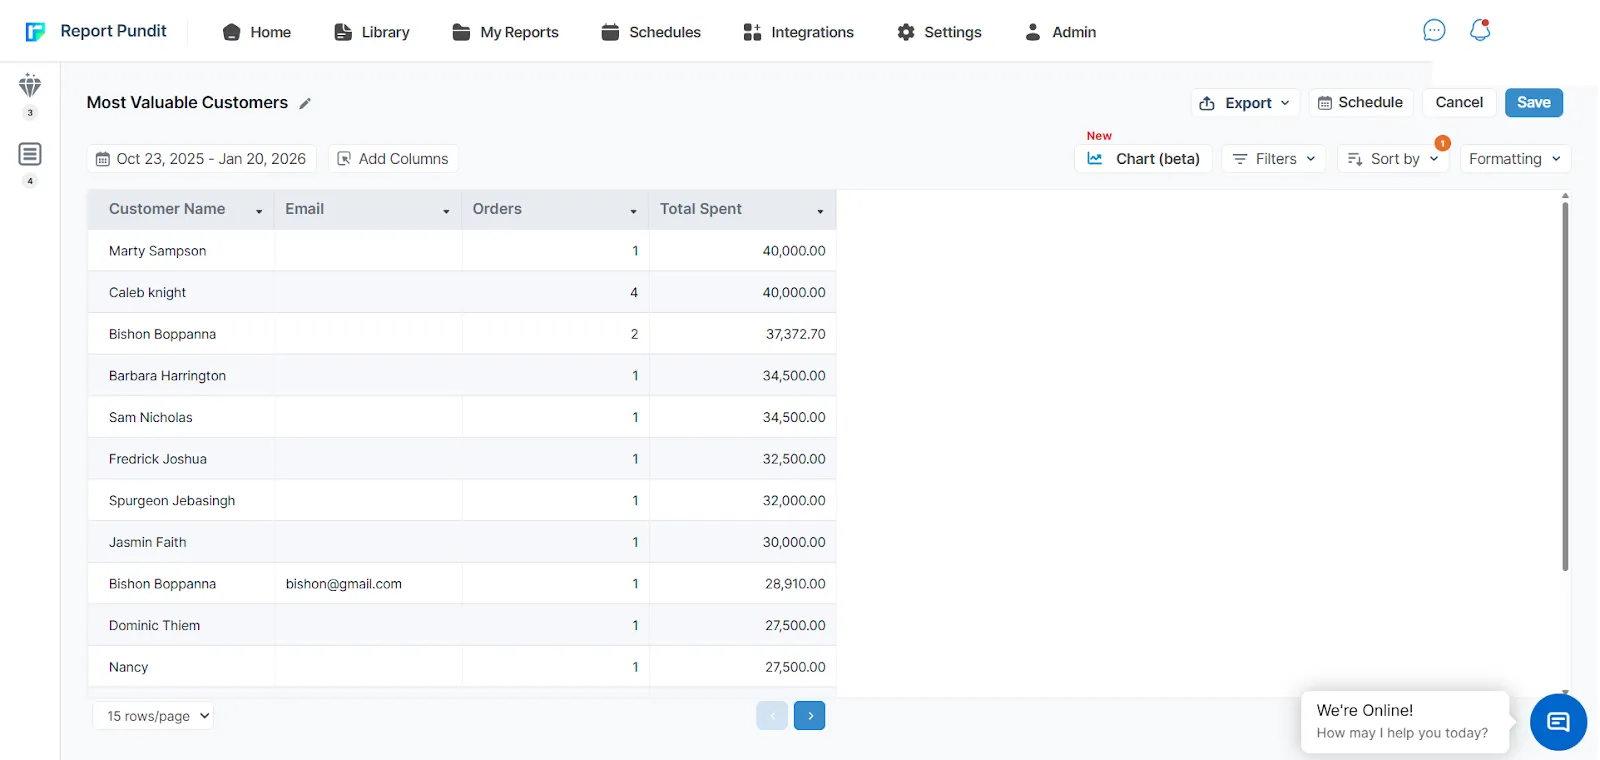
The customer KPIs report shows who your most valuable buyers are, how often they return, and which segments drive the most revenue. These metrics allow you to improve retention to personalize marketing strategy for their loyalty rewards, and grow lifetime value.
Operations and staff KPIs
Operations KPIs connect team performance to sales outcomes, which matters most for Shopify POS retailers running multiple locations. The Retail Sales by Staff at Register report shows order count, gross and net sales, and shipping data per employee, letting you spot your strongest performers across locations rather than guessing from gut feel.
This tends to matter most around scheduling. Once you can see which staff or locations convert best during specific hours, you can staff accordingly instead of spreading coverage evenly and hoping.
Returns and discount KPIs
Return and discount KPIs show how much revenue is quietly leaking out after the sale closes. The average cart abandonment rate across ecommerce sits close to 70%, though it varies by device and industry (Baymard Institute), and refund patterns tell a similar story after checkout.
Refund report
This Refund Report tracks returned quantity, net returns, shipping returns, and tax returns, giving you the full financial impact of a refund, not just the headline number. Watching this weekly tends to catch a shipping or sizing problem before it becomes a pattern across your whole catalog.
A clear, fair refund policy also builds buyer confidence upfront. Customers who know they have a safety net are more likely to complete the purchase in the first place.
Inventory KPIs
Inventory KPIs keep supply matched to demand, which prevents the two costliest inventory mistakes: stockouts on your bestsellers and dead stock on everything else.
Inventory on hand
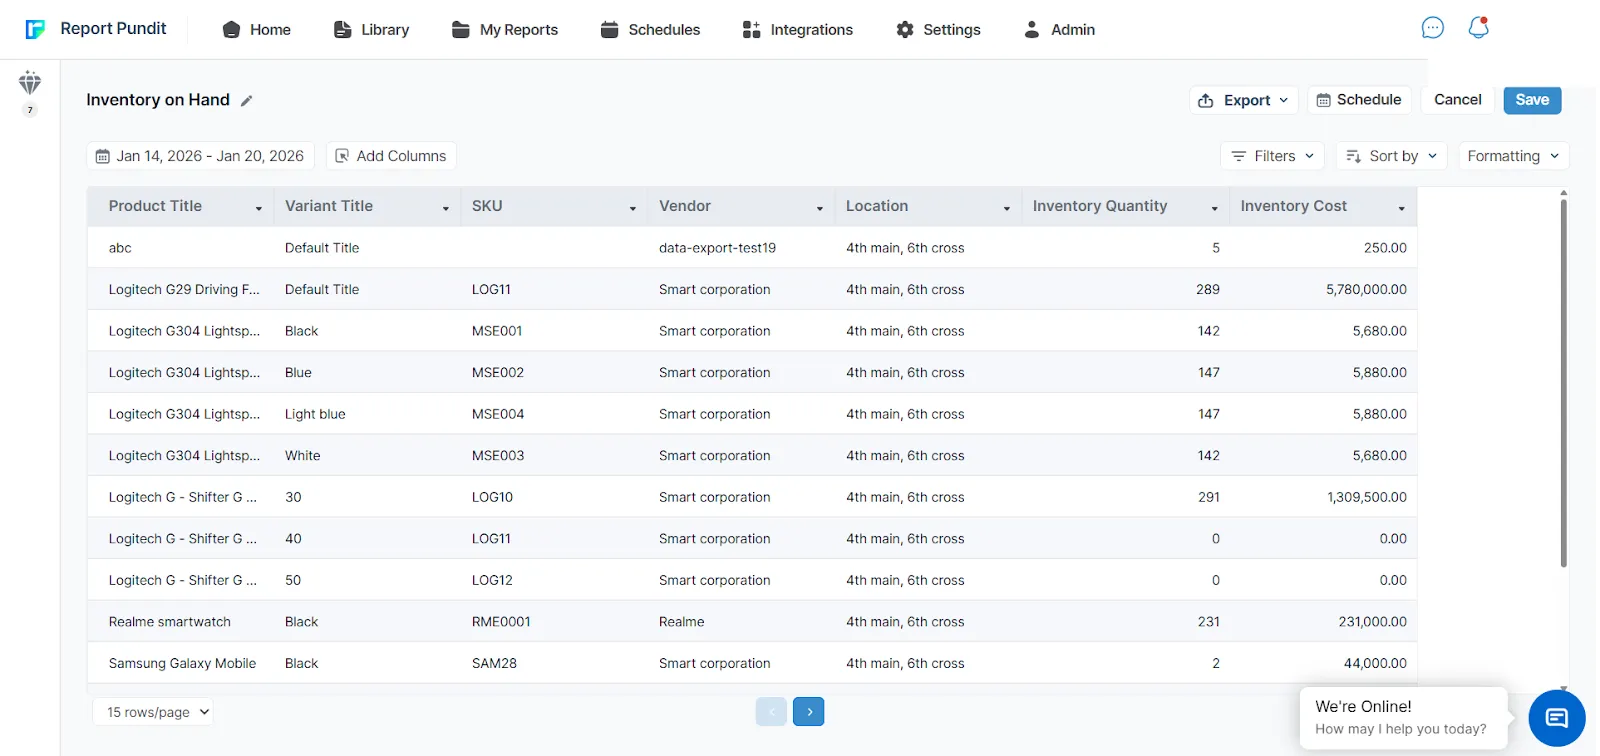
This Inventory on Hand shows exact stock per product and variant across every location, including SKU, vendor, and inventory cost, so purchasing decisions are based on what's actually on the shelf rather than what the last report said three weeks ago.
Low stock product report
This Low Stock Product Report flags products approaching their reorder point before they actually run out, including product status, current price, and inventory value, so restocking happens on your timeline instead of after a sellout.
What are some Shopify KPI examples by store goal?
The right KPIs to track depend entirely on what you're trying to accomplish right now, not a fixed universal list. Here's how that breaks down by common goals:
- Growing revenue 10% this quarter: sales growth rate, conversion rate, average order value
- Improving profitability without more traffic: gross margin, contribution margin, discount impact on margin
- Reducing cart abandonment: cart abandonment rate, checkout completion rate, mobile vs. desktop conversion
- Building repeat business: customer lifetime value, repeat purchase rate, first-time vs. returning customer split
- Fixing inventory issues: stock on hand by location, low stock alerts, sell-through rate
- Scaling a multi-location POS store: sales by staff, sales by location, staff conversion rate
Ten KPIs is usually the ceiling for a single dashboard. Past that point, most merchants stop acting on the data and start just collecting it.
Is there a Shopify KPI template or spreadsheet?
Shopify's native Analytics dashboard offers prebuilt report templates, but it doesn't include a downloadable KPI spreadsheet or a cross-store template out of the box. For a reusable KPI tracking spreadsheet, most merchants either build one manually from exported CSVs or use a reporting app with prebuilt templates that already map to the KPI categories above.
When should you check each KPI report?
Check frequency should match how fast the underlying number moves and how much damage a delay could do. Daily checks make sense for high-volume stores that need to react in real time; weekly and monthly checks suit slower-moving strategic metrics.
Can you build these KPI reports natively in Shopify?
Shopify's built-in Reports section covers the basics well: sales over time, sales by product, and inventory reports are all there by default. What it doesn't include is multi-store consolidation, custom calculated fields, line item property breakdowns, or combined views like staff sales crossed with traffic data.
For KPIs that need custom logic, like a commission formula, a contribution margin calculation, or text extracted from order notes and tags, native Shopify reporting reaches its limit fairly quickly. Our guide on building custom calculation reports in Shopify walks through exactly this: how to build the specific formula your business actually uses, whether that's gross profit, vendor commission, or a custom margin definition.
For UTM tracking, multi-store views, or automated report delivery, most merchants end up reaching for an app that offers 100 or more prebuilt reports on top of Shopify's native data.
Frequently asked questions
What is a KPI in Shopify?
A KPI in Shopify is a specific, measurable metric tied to a business goal, like conversion rate, average order value, or customer lifetime value. It's different from a generic metric because it's chosen deliberately to track progress toward something the business is actively trying to improve.
What are the 4 types of KPI?
A simplified model splits KPIs into four types: sales, marketing, customer service, and operations. For Shopify stores specifically, it's usually more useful to expand this to seven categories, adding product performance, returns and discounts, and inventory as their own tracked areas.
What are the 7 KPIs most Shopify stores need?
The seven core categories are sales and revenue, marketing and campaigns, product performance, customer behavior, operations and staff, returns and discounts, and inventory. Together, these give a full view of a Shopify store's health without requiring dozens of scattered metrics.
What are the 5 most relevant Shopify KPIs to start with?
For most new or growing stores, the highest-impact starting five are conversion rate, average order value, customer acquisition cost, customer lifetime value, and cart abandonment rate. These five balance traffic quality, profitability, and repeat behavior without overwhelming a small team.
Do I need a paid app to track Shopify KPIs, or can I use native reports?
Native Shopify reports cover single-store basics like sales over time and inventory. If you need multi-store views, custom calculated fields (commission, margin), or scheduled delivery to your team, you'll need a reporting app layered on top of Shopify's native data.
Final thoughts
KPI reports aren't just a set of numbers on a dashboard, they're the roadmap for where a Shopify store is actually headed. They show whether sales are growing, which channels and campaigns are earning their spend, what customers actually want, and where inventory and operations need attention before a small issue turns into a lost sale.
Consistently reviewing the right KPIs, on a schedule that matches how fast each one moves, replaces guesswork with a clear read on performance. That's what turns a KPI dashboard from a nice-to-have into the thing that actually drives the next decision.

5.0 ( 2000+ Reviews)

.avif)