Sales by Variant Report for Shopify
Gain detailed insights into each product variant's performance with the Sales by Variant Report. Beyond basic sales data, it shows how each variant impacts your store's success. Use it to fine-tune inventory management and identify popular options, helping you make strategic decisions to boost your bottom line.


5 from 1,800+ merchants
2,000+ data fields
Trusted by 40,000+ Shopify stores
Updated June 2026
.png)
.png)

.svg)
.svg)
.svg)
Why this report matters
Product-level reports hide the decision that actually matters to a buyer: which size and which color. “The jacket sells well” is useless when you’re reordering and Medium is gone while XXL gathers dust.
Shopify’s native variant breakdown is shallow and, in its richer forms, plan-gated and unschedulable. So planners reorder on gut feel for the option split, and dead stock accumulates one variant at a time.
A SKU-level view ties units, average selling price, and return rate to inventory on hand, so you reorder to the actual demand curve. Getting the size curve right is one of the cheapest ways to cut markdowns — the stock you don’t over-buy is margin you keep.
What’s included
Identification
Product & variant
The parent product plus the specific variant (e.g. size/color).
SKU
The stock-keeping unit, your join key to inventory and purchasing.
Example: MC-NVY-M, MC-NVY-L, MC-NVY-XL.
Option values
The variant’s option breakdown (Size = L, Color = Navy) for clean grouping.
Heads up: A variant only appears if it sold at least once in the period; never-sold SKUs won’t show here — use an inventory report for those.
Performance
Units sold
Quantity sold for the variant in the period.
Average selling price
What the variant actually sold for after discounts — not the list price.
Formula: Avg selling price = Net sales ÷ Units sold
Example: Net $1,800 over 40 units = $45 average, below the $50 list — discounting at work.
Gross & net sales
Revenue before and after discounts and returns for the variant.
Formula: Net sales = Gross − Discounts − Returns
% of product sales
The variant’s share within its parent product — the size/color curve.
Formula: Variant share = Variant net sales ÷ Product net sales × 100
Quality & stock
Return rate
Return-proneness of the specific variant, where sizing problems hide.
Formula: Return rate = Returned units ÷ Units sold × 100
Heads up: Returns often concentrate in one or two sizes; a product-level rate masks it, a variant-level rate exposes it.
Inventory on hand
Current stock for the variant, for an at-a-glance demand-vs-supply read.
Heads up: Inventory is a point-in-time snapshot at run time, while sales are period totals — don’t read them as the same window.
Who uses this report
Buyer
Inventory planner
Merchandiser
Quality / ops
How to read the report
- Read the size/color curve, not the total. The split across variants is the buying decision; the product total just tells you the style works.
- Average selling price reveals hidden discounting. When it sits well below list, the variant is moving on markdowns — check whether that’s deliberate.
- Pair units with inventory on hand. High units and low stock means reorder now; low units and high stock means markdown.
- Localize returns to the variant. A product-level return rate hides which size is the problem; the variant view names it.
How to build the report in Report Pundit
- Open Report Pundit in your Shopify admin and choose Create Report (or the pre-built “Sales by Variant” template).
- Set the data source to Sales / Order line items.
- Group the report by Variant (SKU).
- Add columns: Product, Variant, SKU, Option values, Units sold, Gross sales, Net sales.
- Add a calculated Average selling price column (net sales ÷ units sold).
- Add a calculated % of product sales column and a Return rate column.
- Pull in Inventory on hand to sit alongside sales for a demand-vs-supply read.
- Set your date range, sort by units or net sales, and Save.
- Schedule a weekly send to buying and planning, or export to a shared Google Sheet for PO planning.
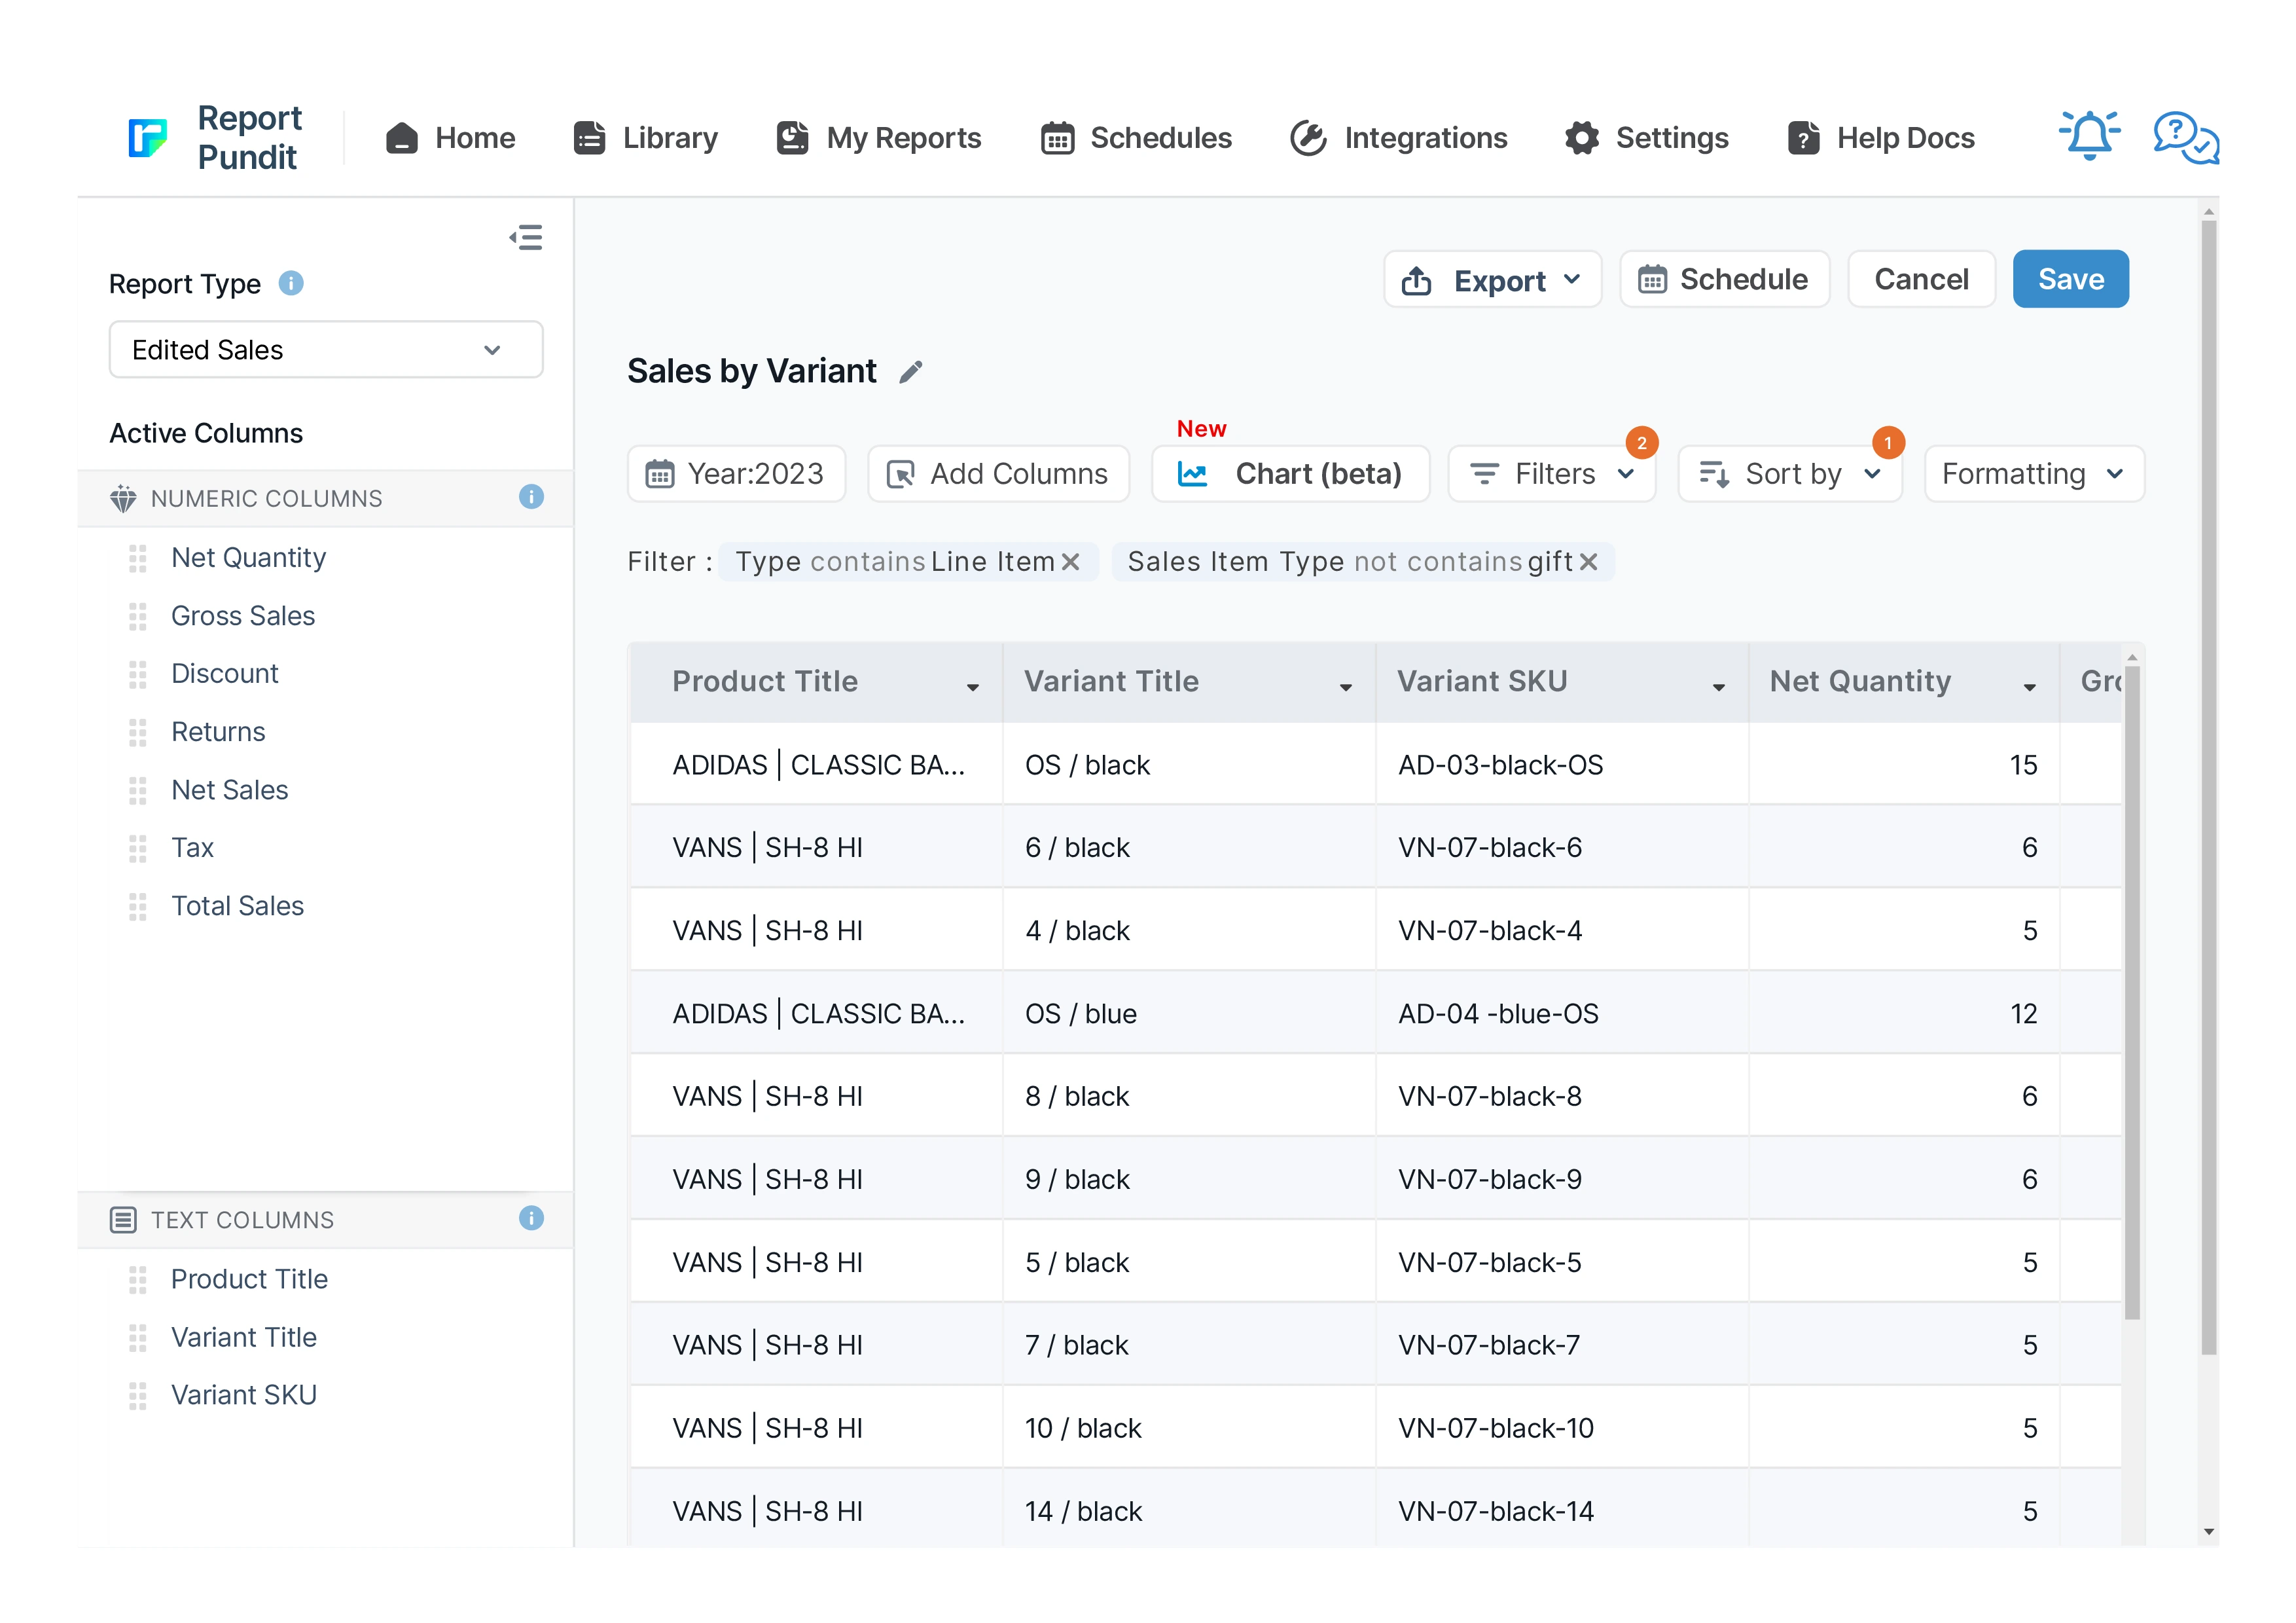
Sample report
Customization & filters
- Group by option (all Mediums across products) to spot store-wide size skew.
- Filter to a single product, collection, vendor, or location.
- Add a sell-through column if you track starting inventory.
- Add a gross-margin column where variant cost is set.
- Roll variants back up to products with the Sales by Product report.
Automate & export
- Schedules — hourly, daily, weekly, monthly, or custom cron
- Delivery formats — Excel, CSV, PDF, or push to Google Sheets in real time
- Group by month or week — trends instead of a static snapshot
- Destinations — email (multiple recipients), Google Sheets, Google Drive, FTP/SFTP, Looker Studio, BigQuery
- Conditional alerts — get notified only if a channel's net sales drop more than X% week-over-week
Report Pundit vs Shopify's native Sales by Channel report
Frequently Asked Questions
Net sales divided by units sold for the variant, so it reflects what the SKU actually sold for after discounts — not its list price. A gap between the two signals discounting.
Variants only appear if they sold at least once in the period. For SKUs that never sold, use an inventory report instead — this one is sales-driven.
Yes. Group by option value (e.g. Size) to see store-wide skew — useful if you consistently over- or under-buy a particular size.
Benefits

Granular Sales Insights
Uncover Hidden Opportunities
Smart Inventory Control
Related Reports
Last 24 Hours Orders
Use the Last 24 Hours Orders report to stay updated on all orders placed within the past day. It provides critical insights into sales trends, customer transactions, and order statuses, allowing you to monitor your store's recent activity and make informed business decisions.
Sales Over Time
Leverage historical data with the Sales Over Time Report. This report covers costs, order details, sales channels, and payment methods, helping you track trends, manage sales tax returns, and assess the effectiveness of each sales channel.
Sales by Customer
The Sales by Customer Report provides Shopify merchants with valuable insights into customer purchasing behavior. This report breaks down sales by individual customers, highlighting the most valuable and active customers.
Order Tags and Line Item Properties
A detailed report built to include order tags and line items added to each placed order, along with essential sales and product details for thorough analysis and processing.
Sales by Device ID
The report displays sales data segmented by device type, such as mobile, desktop, or tablet, allowing merchants to analyze performance based on customer device usage.
Sales by Product
The Sales by Product report offers details about each product’s sales performance over a given time frame. It provides valuable insights into which of your products are and aren’t selling well. These insights will enable you to make informed decisions about inventory management and marketing and improve your business.
Sales by Fulfillment Location
Data reported to analyze sales based on order fulfillment locations for any specified date range, including product quantity sold and corresponding sales value.
Sales by Staff
A report designed for quick analysis of sales attributed to each staff member across all POS locations, with details from gross sales to net sales calculations.
Last 30 days Sales Summary
A report that provides a comprehensive overview of sales performance over the past 30 days, including total revenue, order count, average order value, and product-specific sales trends for detailed analysis.
Completed Draft Order
This report provides insights into finalized draft orders, displaying detailed information on converted orders, including product details, pricing, and customer data for analysis.
Commission
The Commission Report is the key to rewarding store staff and affiliates for sales they generate. It provides an overview of their sales performance along with calculated commissions share.
Sales by Channel
The Sales by Channel report displays sales data based on the source of each sale. It's a valuable report offering insights into multichannel Shopify selling.
Sales by Vendor
The Sales by Vendor report analyzes how each vendor's products contribute to your store's success. By examining sales, purchase costs, and profitability, this report provides insights to make strategic decisions, maximize profits, and optimize inventory management based on vendor performance.
Sales by Discount Code
Sales by Discount Code report in Report Pundit provides a detailed analysis of sales generated through specific discount codes over a defined period.
Refund
Report Pundit’s Refund Report records the details of money returned by a Shopify merchant to unsatisfied customers when they return the product/service. These reports help the merchant keep track of the refunds issued, monitor customer satisfaction and have a proper record of financial transactions for filing taxes.
Sales by Billing Location
The Sales by Billing Location report in Shopify provides a detailed breakdown of sales based on the billing addresses of your customers. This report categorizes sales data of your customer base by country, region, or city.
Sales by POS
The report provides detailed sales figures and net product counts, accounting for refunds, at each POS location, offering a clear view of actual sales performance and inventory movement.
Finance Summary
The Finance Summary Report provides an overview of your store’s financial performance by aggregating key revenue, expense, and tax data. This report helps store owners understand their overall profitability, cash flow, and key cost drivers, making it essential for budgeting and financial planning
Order vs Return (Monthly)
A report interpreting monthly returns by comparing the total sales value with the sales value of returned orders, including percentage calculations for both return orders and return value.

Build and automate your Shopify Reporting
Unlock the full potential of your Shopify store with Report Pundit. Gain access to over 2000 data fields, automate reports, and make data-backed decisions to grow your business.