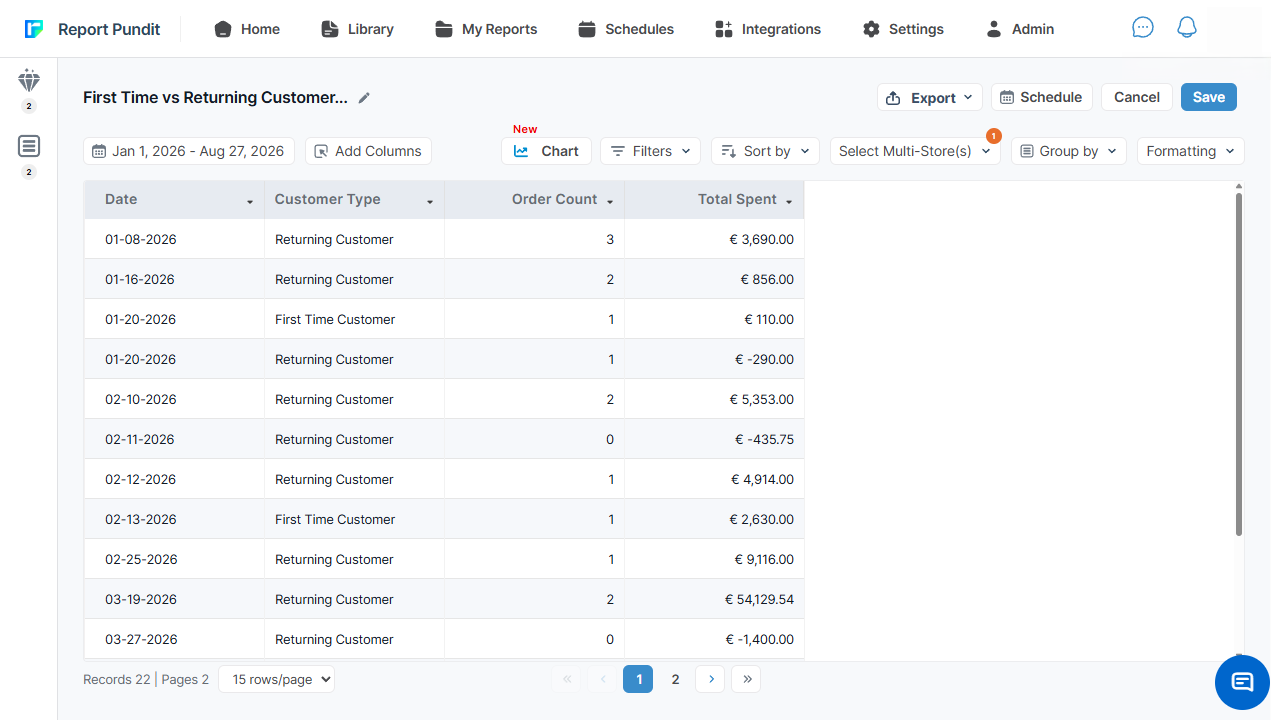
What Is the First Time vs Returning Customers Sales Report?
This report splits every order in a chosen period into two buckets, first-time customers and returning customers, and totals the orders and revenue for each. Instead of listing individual buyers, it answers a single balance question: how much of your recent business comes from people buying for the first time versus people coming back.
The distinction that trips merchants up is what each bucket counts. A first-time row reflects orders from customers making their very first purchase in the period. A returning row reflects orders from customers who had already bought before. Because the report is driven by a Date field, you can watch that mix move over time rather than seeing a single frozen snapshot.
Merchants use this report to decide where the next dollar of effort should go. If returning customers already carry most of the revenue, retention spending pays off; if first-time buyers dominate but rarely come back, the store is leaning on acquisition and the retention gap is the thing to fix.
Which Fields Are Included in the First Time vs Returning Customers Sales Report?
These four fields let you read the acquisition-versus-retention balance and how it shifts across the period
You can customize the pre-made report by adding, removing, or rearranging fields, and by grouping the Date field into the time interval that matches how you review sales.
Important Insights You Can Find in This Report
Which group is funding the store right now, and is the balance changing?
Compare Total Spent between the first-time and returning rows across the Date column. A store that has quietly become dependent on repeat buyers looks very different from one still living on new customers, and the point where returning revenue overtakes first-time revenue is a meaningful milestone. If that crossover reverses in later periods, it is worth checking whether retention slipped or a recent acquisition push simply flooded the first-time bucket.
Is repeat revenue growing from more orders or bigger orders?
Read Order Count against Total Spent within the returning rows over time. Returning revenue can climb two very different ways: the same repeat buyers ordering more often, or a stable number of repeat orders getting larger. Watching both columns move together tells you whether frequency or basket size is doing the work, which changes whether you push reorder reminders or higher-value bundles.
Does a surge in new orders actually turn into new revenue?
Look at periods where first-time Order Count jumps. If Total Spent for that same first-time row stays low, the new customers are placing small, trial-sized first orders. That pattern is common right after a discount-led campaign and signals that the real test is the second purchase, not the first.
THE ANALYST'S READ: The Signal Most Merchants Miss
Most people read this report by asking which bucket is bigger. The sharper signal is the gap between each type's share of orders and its share of revenue in the same period.
If returning customers are a minority of Order Count but the majority of Total Spent, a small group of repeat buyers is quietly carrying the store, and losing even a few of them hurts more than the order numbers suggest. The opposite gap, where first-time customers dominate orders but contribute a thin slice of revenue, points to a store that is busy acquiring but not yet converting those buyers into value. Compare those two shares period by period rather than looking at a single total, and treat a widening or narrowing gap as the thing to investigate next.
How Can You Automate the First Time vs Returning Customers Sales Report?
Open the pre-made report in Report Pundit, and the columns are already set, so you can save it as-is or adjust the Date grouping first. Once saved, schedule it to email automatically on a daily, weekly, or monthly cycle so the acquisition-versus-retention split lands in your inbox without rebuilding it. You can send the same schedule to teammates, a VA, or your accountant, and export any run as Excel, CSV, or PDF, or push it to Google Sheets or Google Drive.
Frequently Asked Questions
How is this report different from the Returning Customers report?
This report aggregates orders and revenue into two customer-type buckets across a period, so it answers a balance question. The Returning Customers report instead lists individual repeat buyers with their contact and order details. Use this one to see the split; use Returning Customers when you need the actual people.
How does the report decide whether a customer is first-time or returning?
The Customer Type field classifies each order by the buyer's history. An order counts toward first-time when it is that customer's initial purchase, and toward returning once the customer has bought before. The report then totals orders and spend for each type.
Can I see the split by day, week, or month?
Yes. The Date field can be grouped into intervals such as day, week, month, or quarter, which changes how finely you can track the mix over time. Choose a wider interval to spot seasonal trends and a narrower one to isolate the effect of a specific campaign.
Can I change the fields in this report?
Yes. You can add, remove, or rearrange columns to match how you review customer performance, then save your version so it opens the same way each time.
Can I export or schedule this report?
Yes. Export any run as Excel, CSV, or PDF, or automate delivery to your email, Google Sheets, or Google Drive on a daily, weekly, or monthly schedule.