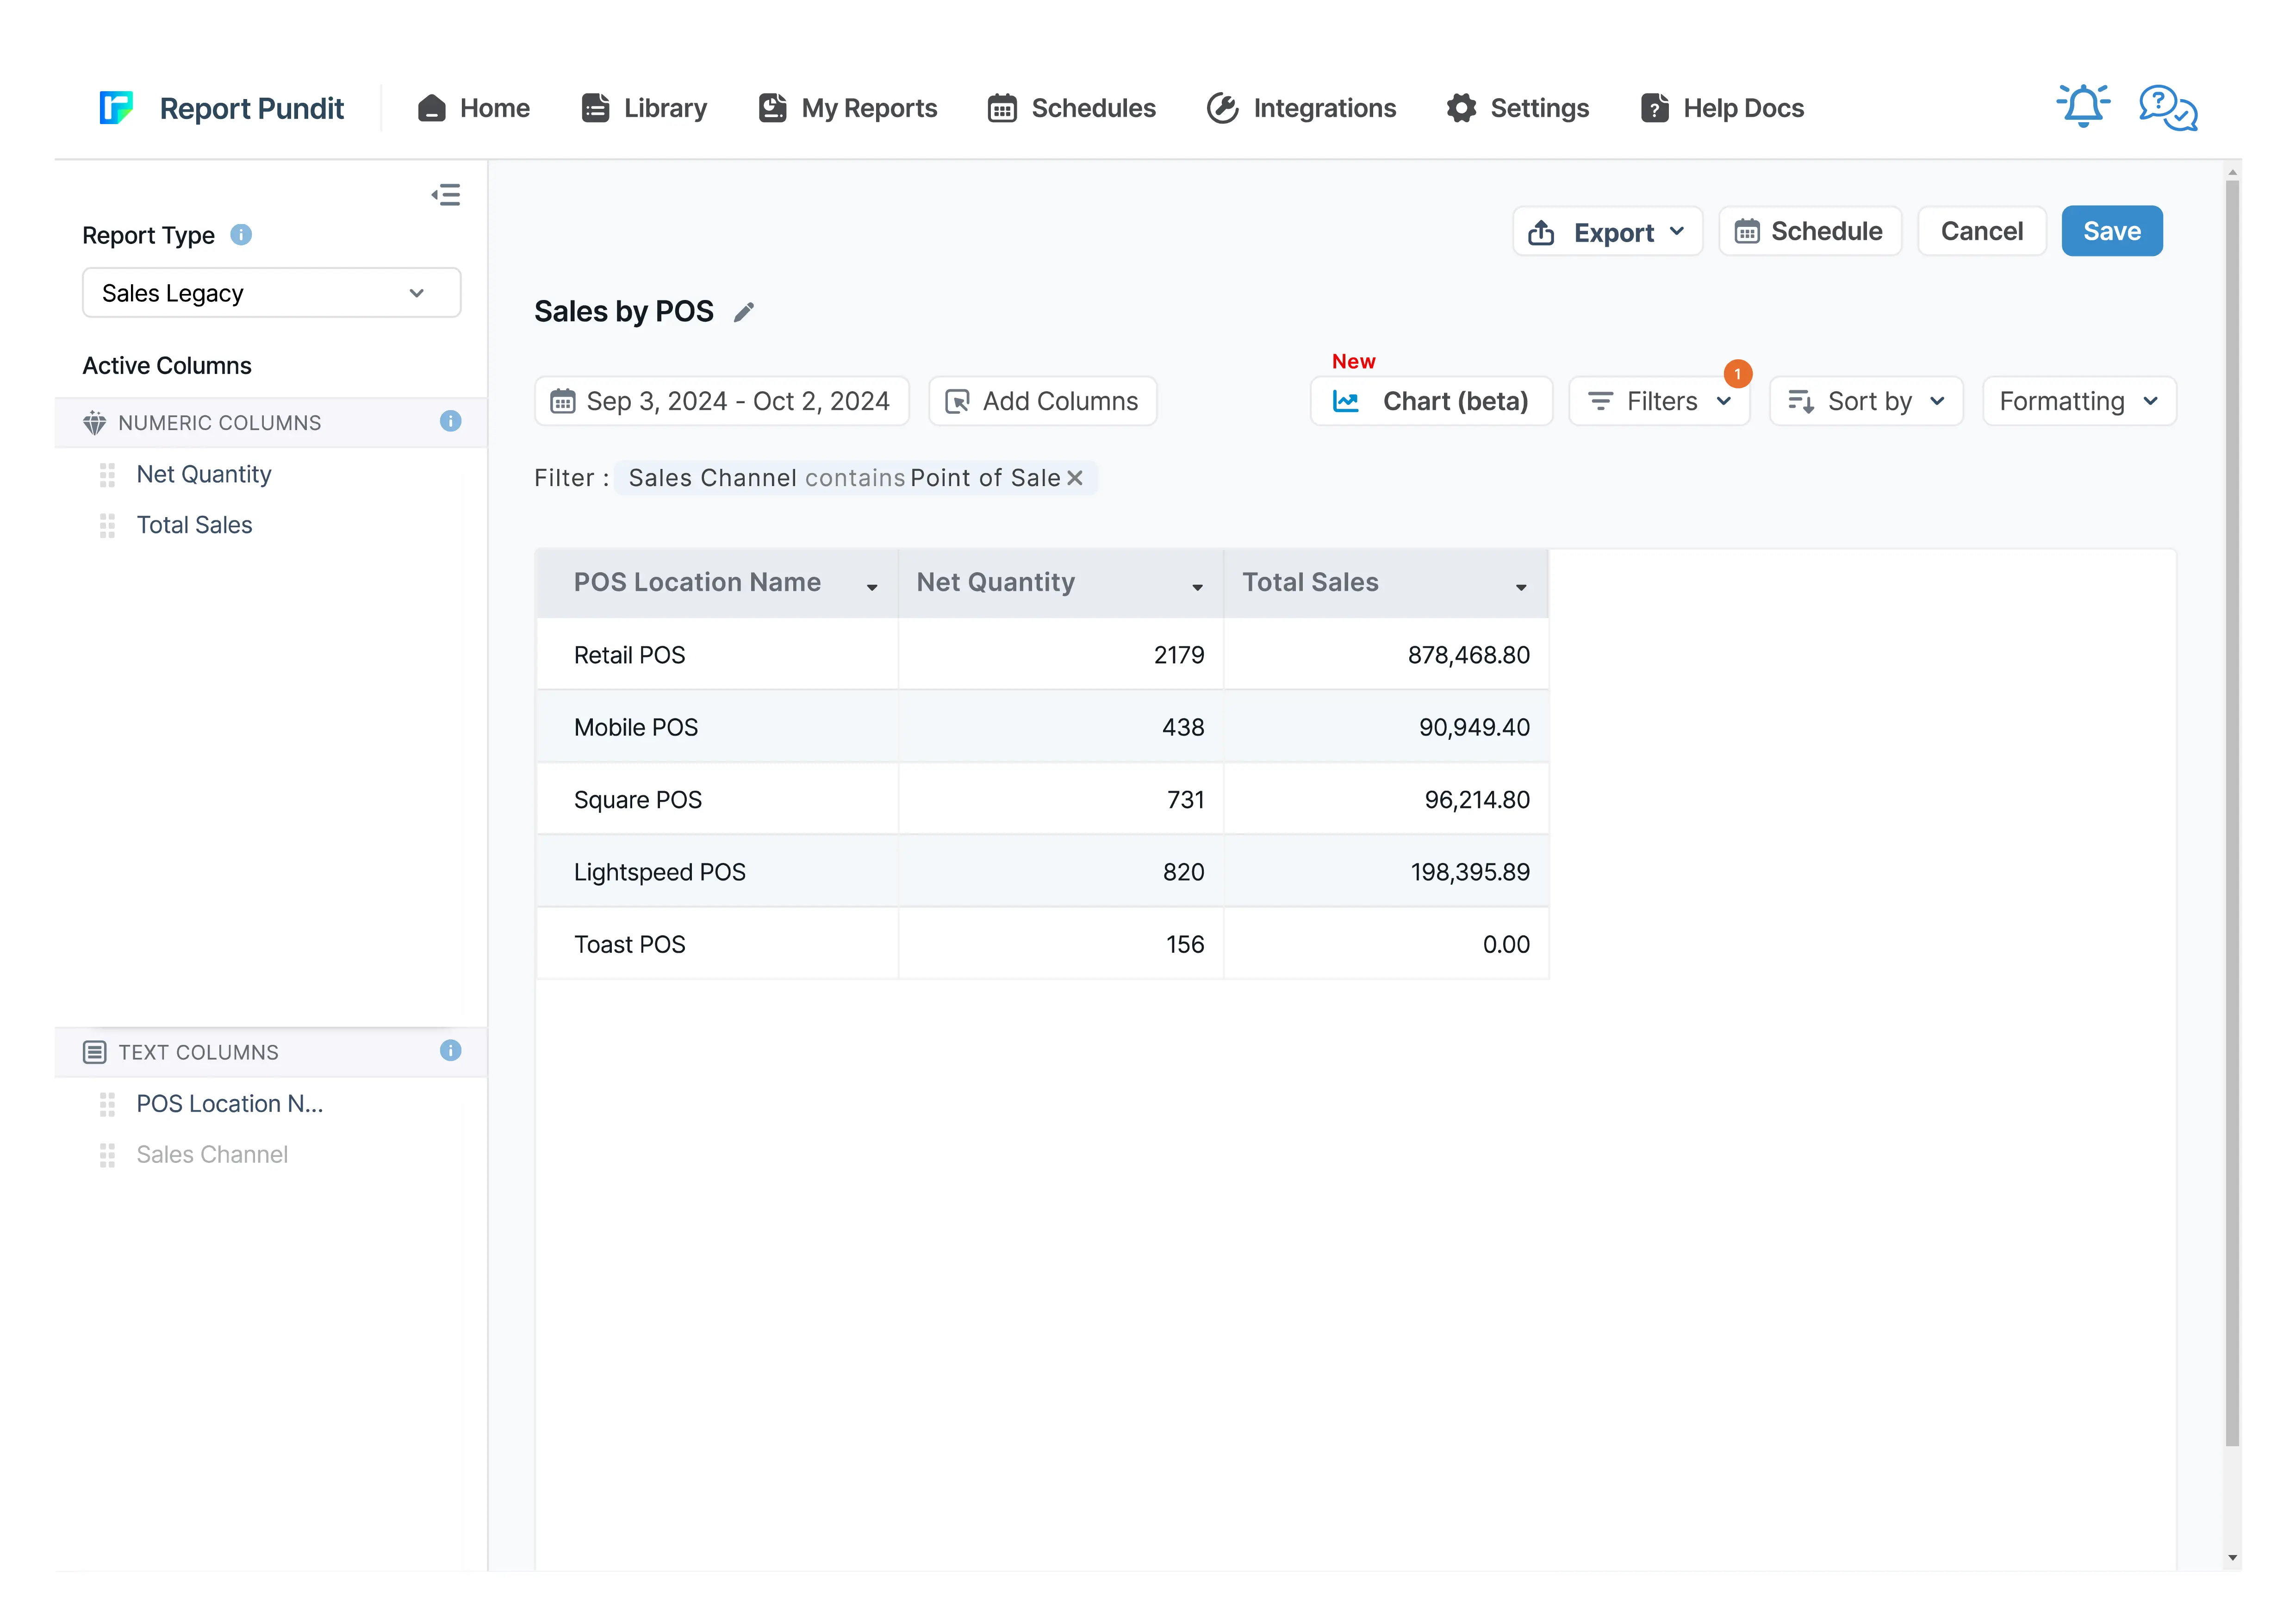
Sales by POS Report for Shopify
The report provides detailed sales figures and net product counts, accounting for refunds, at each POS location, offering a clear view of actual sales performance and inventory movement.


5 from 1,800+ merchants
2,000+ data fields
Trusted by 40,000+ Shopify stores
Updated June 2026
.png)
.png)

.svg)
.svg)
.svg)
Why this report matters
Retail and online live in the same Shopify store but rarely in the same report. Owners running both end up with a clear online dashboard and a foggy retail one — no clean read on which store, register, or shift actually performed.
Shopify’s retail sales reporting depends on plan and POS tier, and the detailed, exportable cuts by staff and register aren’t something you can schedule for a daily close-out. Store managers reconcile the till by hand.
A proper POS report puts location, register, staff, and hour in one view, beside the POS-vs-online split. Since staffing to peak hours is one of the highest-leverage retail decisions, knowing your real trading curve — not the one you assume — pays for itself in scheduling.
What’s included
Where & who
Location
The physical store/location the sale was rung at.
Example: Flagship · Mall kiosk · Pop-up.
Register / device
The POS device or register that processed the sale, for till-level reconciliation.
Heads up: Device/register detail depends on your Shopify POS setup and tier; thinner POS plans expose less of it. [verify]
Staff
The staff member attributed to the sale — the basis for any commission or performance view.
Heads up: Attribution reflects who was signed in at the register; shared logins will muddy per-staff numbers.
Performance
Orders & units
Transaction count and units sold for the slice (location, register, or staff).
Gross & net sales
Retail revenue before and after discounts and returns.
Formula: Net sales = Gross − Discounts − Returns
Average order value
Average basket size for the slice — a clean staff and store comparison.
Formula: AOV = Net sales ÷ Orders
Example: Register 2 averages $62 vs Register 1 at $44 — worth understanding why.
POS vs online split
Retail sales beside online sales, so you see the true channel mix.
Formula: POS share = POS net sales ÷ Total net sales × 100
Timing & returns
Peak hours / days
Sales grouped by hour and weekday — the staffing curve.
Example: Saturday 12–2pm consistently doubles the weekday average.
POS refunds & exchanges
Returns and exchanges processed in-store, separated from online.
Heads up: Exchanges can net to a small dollar figure while moving real units — read unit movement, not just the net amount.
Who uses this report
Retail manager
Multi-store owner
Operations
Owner / HR
How to read the report
- Read the trading curve before staffing. Your assumed peak and your real peak are often an hour apart; the hour grouping settles it.
- Compare stores on AOV, not just totals. A smaller store with a higher basket may be your best operator — totals alone would hide it.
- Separate POS refunds from exchanges. An exchange nets to near zero in dollars but still moves stock; track units to see real activity.
- Sanity-check staff attribution. Shared register logins blur per-staff numbers; if one “staff” looks superhuman, check the sign-in discipline first.
How to build the report in Report Pundit
- Open Report Pundit in your Shopify admin and choose Create Report (or the pre-built “Sales by POS” template).
- Set the data source to Sales / Orders and filter Sales channel to Point of Sale (plus Online Store if you want the split).
- Add columns: Location, Device/Register, Staff, Orders, Units, Gross sales, Net sales.
- Add a calculated AOV column (net sales ÷ orders).
- Group by Location, then by Staff or Register depending on the view you need.
- Add an hour/weekday grouping of order time for the peak-hours view.
- Add POS refunds/exchanges, and a POS-vs-online share column for the channel mix.
- Set your date range, run, and confirm POS orders are coming through with location and staff populated.
- Save and schedule a daily close-out send to store managers, or export to a shared Google Sheet.
Sample report
Customization & filters
- Group by location, register, staff, hour, or weekday — or nest them.
- Filter to a single store, register, or staff member.
- Add a commission calculation as a calculated column on staff sales.
- Compare POS against online for the same products or period.
- Normalize sales per open hour for a fair multi-store comparison.
Automate & export
- Schedules — hourly, daily, weekly, monthly, or custom cron
- Delivery formats — Excel, CSV, PDF, or push to Google Sheets in real time
- Group by month or week — trends instead of a static snapshot
- Destinations — email (multiple recipients), Google Sheets, Google Drive, FTP/SFTP, Looker Studio, BigQuery
- Conditional alerts — get notified only if a channel's net sales drop more than X% week-over-week
Report Pundit vs Shopify's native Sales by Channel report
Frequently Asked Questions
Yes — the POS-specific columns (location, register, staff) populate from Shopify POS activity. Without POS in use, you’ll still get online sales but no retail breakdown.
Yes, based on who was signed in at the register. Shared logins blur the numbers, so consistent sign-ins are worth enforcing for accurate per-staff data.
Yes. Filter or group by sales channel to see the POS-vs-online split and each channel’s share of net sales in one view.
Benefits

POS Net Sales
Improved Stocking
POS Sales Performance
Related Reports
Sales by Product
The Sales by Product report offers details about each product’s sales performance over a given time frame. It provides valuable insights into which of your products are and aren’t selling well. These insights will enable you to make informed decisions about inventory management and marketing and improve your business.
Last 24 Hours Orders
Use the Last 24 Hours Orders report to stay updated on all orders placed within the past day. It provides critical insights into sales trends, customer transactions, and order statuses, allowing you to monitor your store's recent activity and make informed business decisions.
Order vs Return (Monthly)
A report interpreting monthly returns by comparing the total sales value with the sales value of returned orders, including percentage calculations for both return orders and return value.
Sales by Variant
Gain detailed insights into each product variant's performance with the Sales by Variant Report. Beyond basic sales data, it shows how each variant impacts your store's success. Use it to fine-tune inventory management and identify popular options, helping you make strategic decisions to boost your bottom line.
Order Tags and Line Item Properties
A detailed report built to include order tags and line items added to each placed order, along with essential sales and product details for thorough analysis and processing.
Sales by Collections
The Sales by Collections report provides a detailed view of your product sales, inventory costs, and profitability by collection, helping you see which collections drive revenue and how they resonate with your audience, allowing you to tailor your product strategies accordingly.
Completed Draft Order
This report provides insights into finalized draft orders, displaying detailed information on converted orders, including product details, pricing, and customer data for analysis.
Sales by Customer
The Sales by Customer Report provides Shopify merchants with valuable insights into customer purchasing behavior. This report breaks down sales by individual customers, highlighting the most valuable and active customers.
Commission
The Commission Report is the key to rewarding store staff and affiliates for sales they generate. It provides an overview of their sales performance along with calculated commissions share.
Last 30 days Sales Summary
A report that provides a comprehensive overview of sales performance over the past 30 days, including total revenue, order count, average order value, and product-specific sales trends for detailed analysis.
Refund
Report Pundit’s Refund Report records the details of money returned by a Shopify merchant to unsatisfied customers when they return the product/service. These reports help the merchant keep track of the refunds issued, monitor customer satisfaction and have a proper record of financial transactions for filing taxes.
Sales by Vendor
The Sales by Vendor report analyzes how each vendor's products contribute to your store's success. By examining sales, purchase costs, and profitability, this report provides insights to make strategic decisions, maximize profits, and optimize inventory management based on vendor performance.
Sales by Billing Location
The Sales by Billing Location report in Shopify provides a detailed breakdown of sales based on the billing addresses of your customers. This report categorizes sales data of your customer base by country, region, or city.
Sales by Channel
The Sales by Channel report displays sales data based on the source of each sale. It's a valuable report offering insights into multichannel Shopify selling.
Sales by Checkout Currency
This report displays the breakdown of your sales by customer currency used at the checkout with the total sales value also being displayed in your local currency.
Sales Over Time
Leverage historical data with the Sales Over Time Report. This report covers costs, order details, sales channels, and payment methods, helping you track trends, manage sales tax returns, and assess the effectiveness of each sales channel.
Sales by Discount Code
Sales by Discount Code report in Report Pundit provides a detailed analysis of sales generated through specific discount codes over a defined period.
Sales by Fulfillment Location
Data reported to analyze sales based on order fulfillment locations for any specified date range, including product quantity sold and corresponding sales value.
Finance Summary
The Finance Summary Report provides an overview of your store’s financial performance by aggregating key revenue, expense, and tax data. This report helps store owners understand their overall profitability, cash flow, and key cost drivers, making it essential for budgeting and financial planning

Build and automate your Shopify Reporting
Unlock the full potential of your Shopify store with Report Pundit. Gain access to over 2000 data fields, automate reports, and make data-backed decisions to grow your business.