Sales by Discount Code Report for Shopify
Sales by Discount Code report in Report Pundit provides a detailed analysis of sales generated through specific discount codes over a defined period.


5 from 1,800+ merchants
2,000+ data fields
Trusted by 40,000+ Shopify stores
Updated June 2026
.png)
.png)

.svg)
.svg)
.svg)
Why this report matters
A discount code is a marketing spend you can measure precisely — yet most stores judge codes by redemptions alone. A code used 800 times looks like a hit until you see it gave away $9,000 and pulled mostly buyers who’d have purchased anyway.
Shopify has a native Sales by discount codes report, but it sits behind the Shopify/Grow plan and up, can’t be scheduled, and can lag 12–72 hours behind live sales. For a time-boxed campaign, a two-day reporting delay is the difference between adjusting mid-flight and finding out too late.
Grouping sales by code with gross, discount given, net, and AOV shows the real return on each promotion. With promotions a leading cause of silent margin erosion, the codes that quietly lose money are exactly the ones worth catching early.
What’s included
Identification
Discount code / name
The code entered at checkout, or the automatic discount’s name.
Example: SPRING15, WELCOME10, or an automatic “Buy 2 get 1”.
Discount type
Manual code vs automatic discount, and the mechanic (percentage, fixed, shipping).
Heads up: Manual and automatic discounts behave differently; keep them separated so a sitewide auto-discount doesn’t swamp your code-level read.
Usage & revenue
Redemptions / orders
How many orders used the code in the period.
Gross sales
Product revenue on those orders before the discount and returns.
Formula: Gross sales = Σ (unit price × quantity)
Discount given
Total value handed back through the code — the cost side of the promotion.
Example: 800 redemptions × $11.25 average = $9,000 given away.
Net sales
What the code actually earned after the discount and returns.
Formula: Net sales = Gross sales − Discount given − Returns
Effect
AOV impact
Average order value on coded orders vs the store average — did the code lift baskets or shrink them?
Formula: Coded AOV = Net sales on coded orders ÷ Coded orders
Heads up: A code that boosts redemptions but lowers AOV may just be discounting demand you already had.
Customer segment
New vs returning split on coded orders, where you have the customer data.
Heads up: Codes that mostly reward returning customers are often margin leaks, not acquisition wins.
Who uses this report
Marketing manager
Growth lead
Finance
Campaign owner
How to read the report
- Read net, not redemptions. A heavily used code can still be your worst performer once you subtract what it gave away.
- Compare coded AOV to store AOV. If coded baskets are smaller, the discount may be shrinking orders rather than growing them.
- Separate manual from automatic. An always-on automatic discount and a one-week code aren’t comparable; split them before judging.
- Watch the new-customer share. Acquisition codes earn their keep on new buyers; if returning customers dominate, it’s a loyalty cost, not growth.
How to build the report in Report Pundit
- Open Report Pundit in your Shopify admin and choose Create Report (or the pre-built “Sales by Discount Code” template).
- Set the data source to Sales / Orders with discount detail enabled.
- Group the report by Discount code / name.
- Add columns: Redemptions (orders), Gross sales, Discount given, Returns, Net sales.
- Add a calculated coded-AOV column (net sales ÷ coded orders).
- Add a Discount type column and, optionally, split manual vs automatic with a filter.
- Set your campaign date range and sort by Net sales descending.
- Run, confirm a known code’s totals look right, and Save.
- Schedule a daily send during live campaigns to marketing via email, Slack, or a shared Google Sheet.
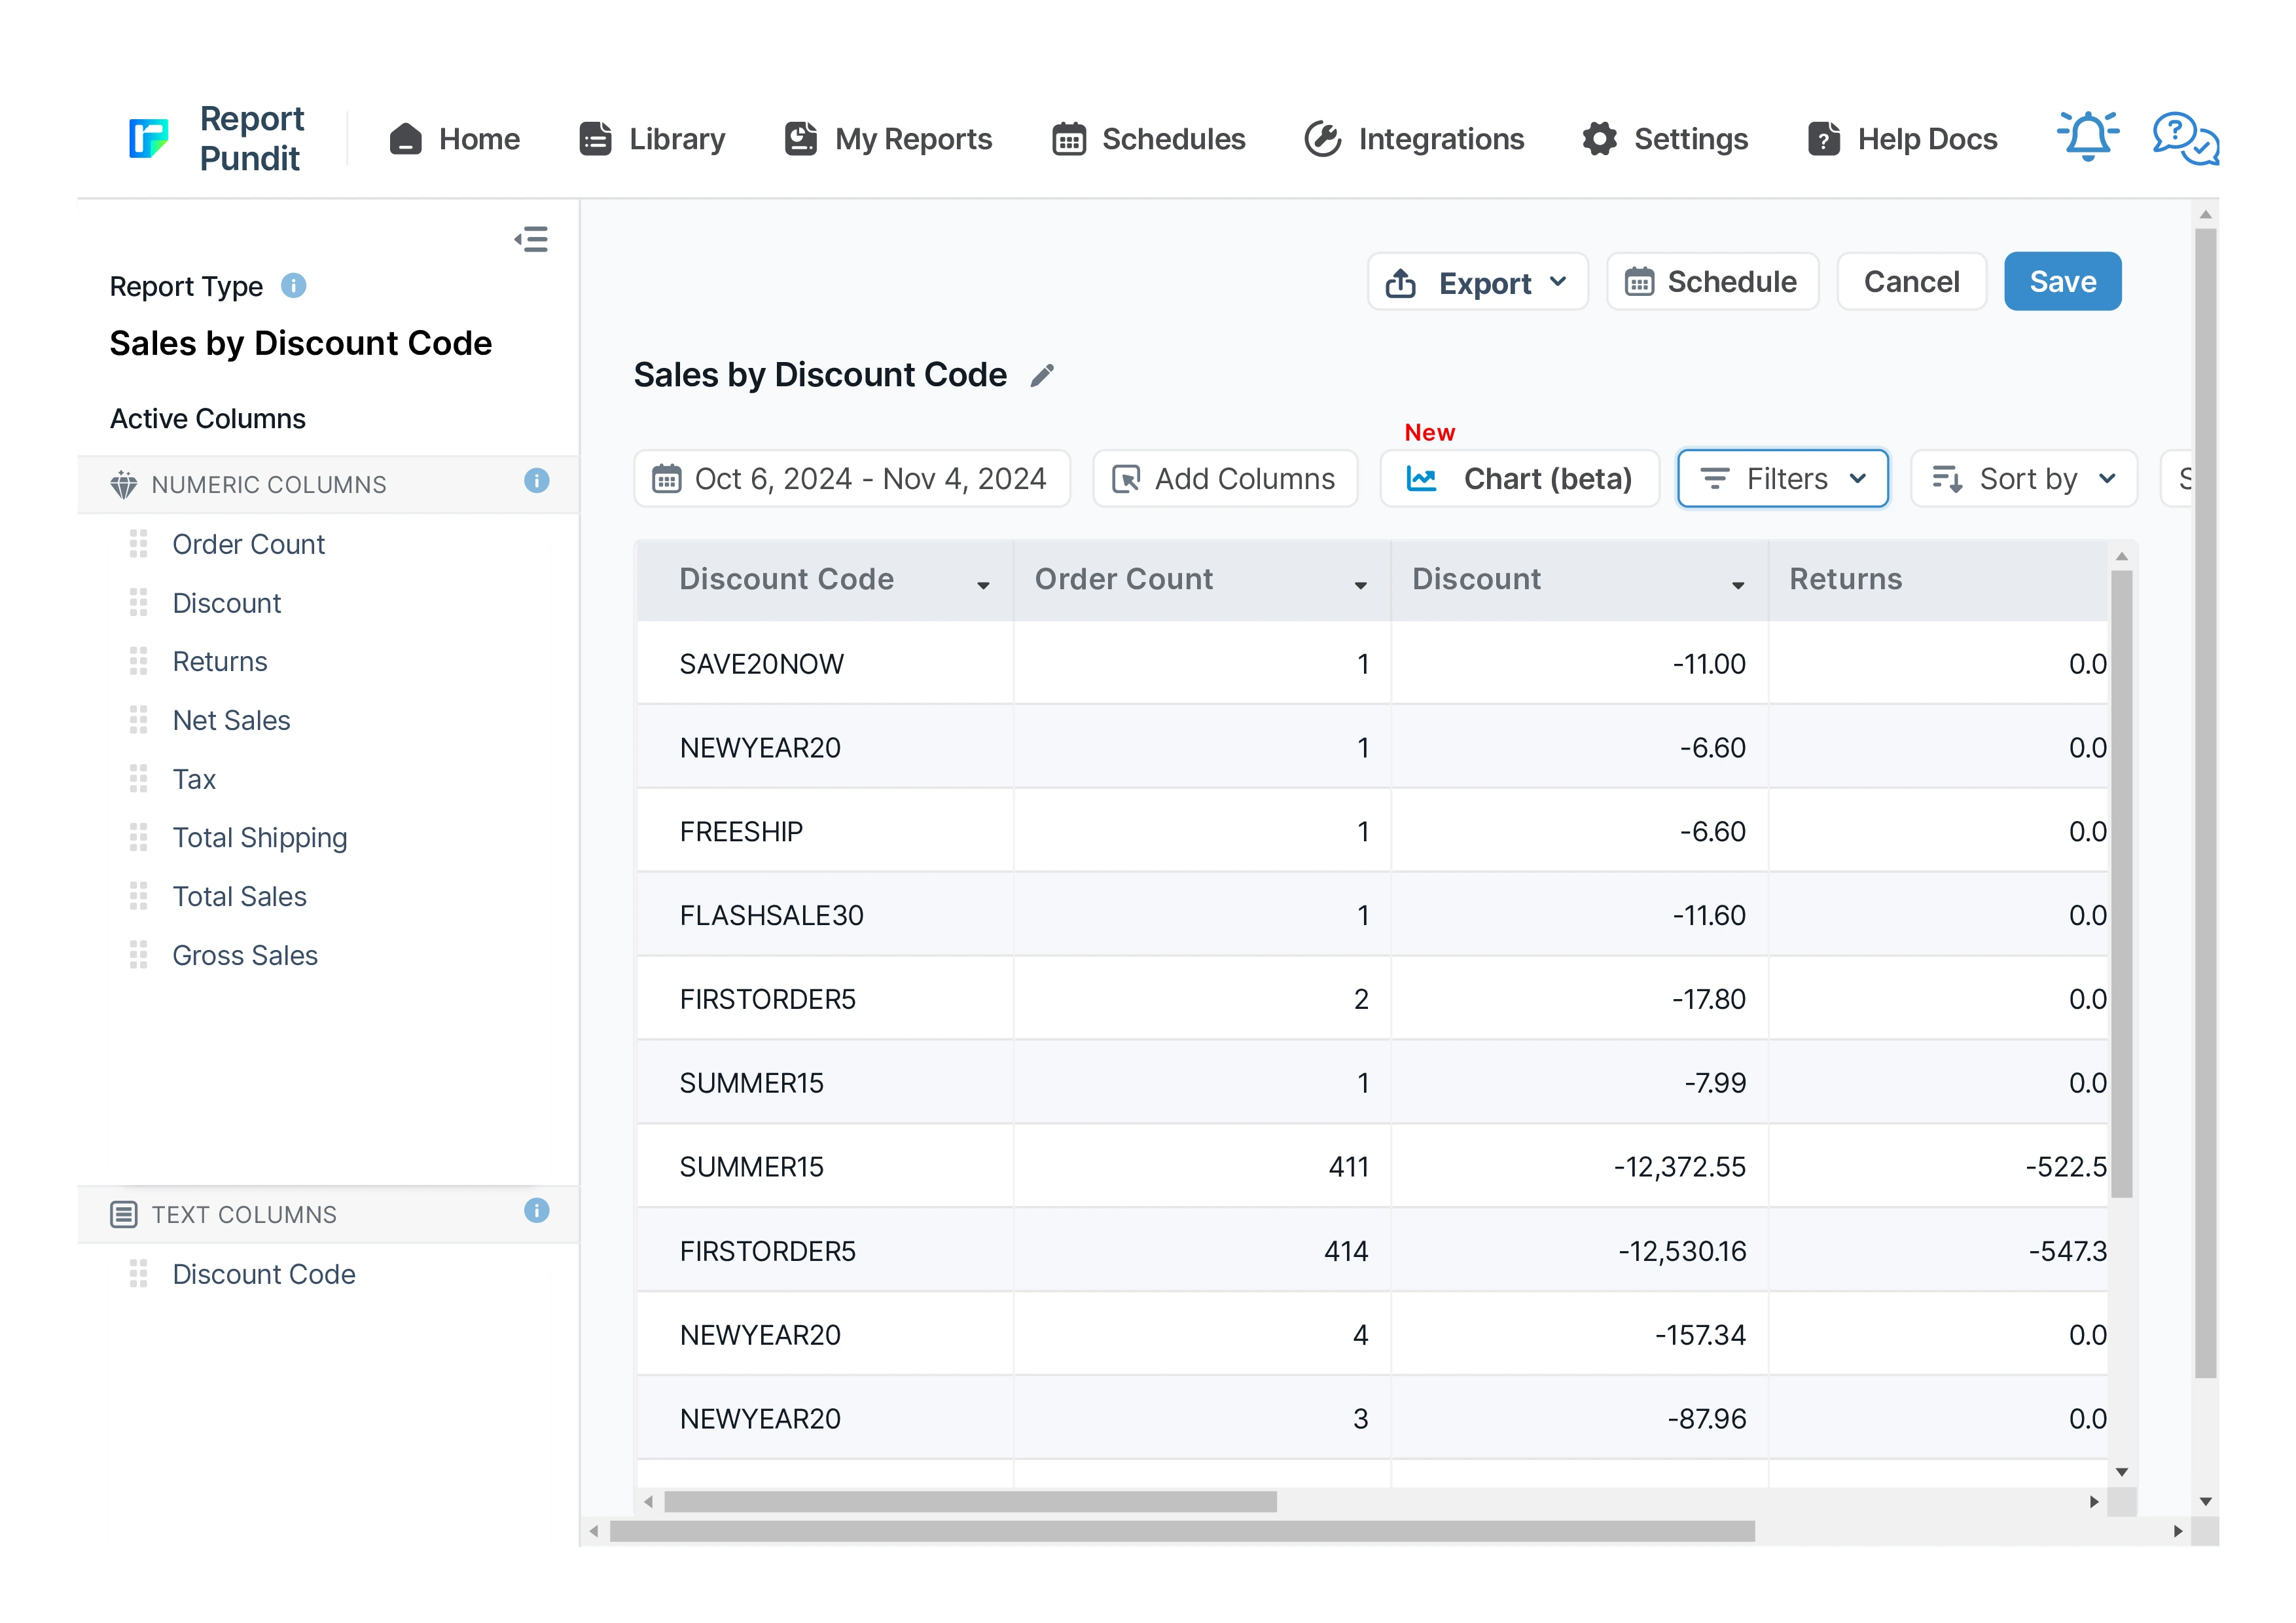
Sample report
Customization & filters
- Filter to a single code, campaign, or date window.
- Split manual codes from automatic discounts.
- Add new-vs-returning customer segmentation per code.
- Group by sales channel to see where each code performs.
- Add a calculated margin column where product cost is set.
Automate & export
- Schedules — hourly, daily, weekly, monthly, or custom cron
- Delivery formats — Excel, CSV, PDF, or push to Google Sheets in real time
- Group by month or week — trends instead of a static snapshot
- Destinations — email (multiple recipients), Google Sheets, Google Drive, FTP/SFTP, Looker Studio, BigQuery
- Conditional alerts — get notified only if a channel's net sales drop more than X% week-over-week
Report Pundit vs Shopify's native Sales by Channel report
Frequently Asked Questions
Yes. The report distinguishes manual codes from automatic discounts so a sitewide promotion doesn’t drown out your code-level analysis. Filter or group by type as needed.
Shopify’s Sales by discount codes report can take 12–72 hours to reflect new sales. Report Pundit re-pulls data on each run or scheduled send, so a live campaign view stays current. [verify exact behaviour on your plan]
Yes, where customer data is available — add a new-vs-returning split per code to tell acquisition wins from loyalty give-aways.
Benefits

Popular Discounts
Discount Code Analysis
Profitability Impact
Related Reports
Sales by Checkout Currency
This report displays the breakdown of your sales by customer currency used at the checkout with the total sales value also being displayed in your local currency.
Refund
Report Pundit’s Refund Report records the details of money returned by a Shopify merchant to unsatisfied customers when they return the product/service. These reports help the merchant keep track of the refunds issued, monitor customer satisfaction and have a proper record of financial transactions for filing taxes.
Completed Draft Order
This report provides insights into finalized draft orders, displaying detailed information on converted orders, including product details, pricing, and customer data for analysis.
Sales by POS
The report provides detailed sales figures and net product counts, accounting for refunds, at each POS location, offering a clear view of actual sales performance and inventory movement.
Order Tags and Line Item Properties
A detailed report built to include order tags and line items added to each placed order, along with essential sales and product details for thorough analysis and processing.
Sales Over Time
Leverage historical data with the Sales Over Time Report. This report covers costs, order details, sales channels, and payment methods, helping you track trends, manage sales tax returns, and assess the effectiveness of each sales channel.
Commission
The Commission Report is the key to rewarding store staff and affiliates for sales they generate. It provides an overview of their sales performance along with calculated commissions share.
Order vs Return (Monthly)
A report interpreting monthly returns by comparing the total sales value with the sales value of returned orders, including percentage calculations for both return orders and return value.
Sales by Collections
The Sales by Collections report provides a detailed view of your product sales, inventory costs, and profitability by collection, helping you see which collections drive revenue and how they resonate with your audience, allowing you to tailor your product strategies accordingly.
Sales by Channel
The Sales by Channel report displays sales data based on the source of each sale. It's a valuable report offering insights into multichannel Shopify selling.
Sales by Billing Location
The Sales by Billing Location report in Shopify provides a detailed breakdown of sales based on the billing addresses of your customers. This report categorizes sales data of your customer base by country, region, or city.
Sales by Device ID
The report displays sales data segmented by device type, such as mobile, desktop, or tablet, allowing merchants to analyze performance based on customer device usage.
Finance Summary
The Finance Summary Report provides an overview of your store’s financial performance by aggregating key revenue, expense, and tax data. This report helps store owners understand their overall profitability, cash flow, and key cost drivers, making it essential for budgeting and financial planning
Sales by Fulfillment Location
Data reported to analyze sales based on order fulfillment locations for any specified date range, including product quantity sold and corresponding sales value.
Last 24 Hours Orders
Use the Last 24 Hours Orders report to stay updated on all orders placed within the past day. It provides critical insights into sales trends, customer transactions, and order statuses, allowing you to monitor your store's recent activity and make informed business decisions.
Last 30 days Sales Summary
A report that provides a comprehensive overview of sales performance over the past 30 days, including total revenue, order count, average order value, and product-specific sales trends for detailed analysis.
Sales by Customer
The Sales by Customer Report provides Shopify merchants with valuable insights into customer purchasing behavior. This report breaks down sales by individual customers, highlighting the most valuable and active customers.
Sales by Variant
Gain detailed insights into each product variant's performance with the Sales by Variant Report. Beyond basic sales data, it shows how each variant impacts your store's success. Use it to fine-tune inventory management and identify popular options, helping you make strategic decisions to boost your bottom line.
Sales by Vendor
The Sales by Vendor report analyzes how each vendor's products contribute to your store's success. By examining sales, purchase costs, and profitability, this report provides insights to make strategic decisions, maximize profits, and optimize inventory management based on vendor performance.
Sales by Staff
A report designed for quick analysis of sales attributed to each staff member across all POS locations, with details from gross sales to net sales calculations.
Sales by Product
The Sales by Product report offers details about each product’s sales performance over a given time frame. It provides valuable insights into which of your products are and aren’t selling well. These insights will enable you to make informed decisions about inventory management and marketing and improve your business.

Build and automate your Shopify Reporting
Unlock the full potential of your Shopify store with Report Pundit. Gain access to over 2000 data fields, automate reports, and make data-backed decisions to grow your business.