Order Tags and Line Item Properties Report for Shopify
A detailed report built to include order tags and line items added to each placed order, along with essential sales and product details for thorough analysis and processing.


5 from 1,800+ merchants
2,000+ data fields
Trusted by 40,000+ Shopify stores
Updated June 2026
.png)
.png)

.svg)
.svg)
.svg)
Why this report matters
If you sell anything customized — engraving, monograms, gift notes, build-to-order options — the most important detail of the order lives in line-item properties. And Shopify’s native reports can’t see them.
The same goes for order tags. Teams tag orders for everything — fraud review, VIP, pre-order, subscription, fulfillment routing — then can’t report on those tags natively. The taxonomy you built to run the business is invisible at analysis time.
This report pulls tags, line-item properties, and note attributes into a structured, filterable table beside the sales data. That’s how a custom-products store fulfills accurately, spots demand trends in personalization, and finally reports on the categories it actually uses.
What’s included
Order tags
The tags applied to each order, for whatever taxonomy you run.
Example: fraud-review, vip, pre-order, subscription, ship-monday.
Heads up: An order can carry several tags; decide whether to split them into separate rows or keep them comma-joined for filtering.
Order note
The free-text note on the order — special instructions a customer or rep left.
Line-item properties
Property name & value
Custom fields attached to an individual item — the personalization or option captured at checkout.
Example: Engraving = “Happy Birthday”; Size = “Custom 42”; Allergy = “nut-free.”
Heads up: Properties are stored as an array, so each distinct property usually needs its own column — set up the ones you actually use.
Note attributes
Additional checkout/cart attributes (e.g. delivery date, gift toggle) carried on the order.
Sales context
Product / variant / SKU
The item the properties belong to, so personalization ties to the actual line.
Quantity, price & order total
Standard sales figures so the custom data sits in commercial context.
Formula: Line total = Unit price × Quantity
Who uses this report
Fulfillment / production
Operations
Merchandiser
Risk / CX
How to read the report
- Set up the properties you use. Because properties are an array, decide which named fields matter and give each its own column — a generic dump is unreadable.
- Choose how tags expand. Multi-tag orders can be split per tag or kept joined; pick based on whether you’re counting tags or filtering orders.
- Tie properties to the line, not the order. Personalization belongs to a specific item; read it at the line level so a two-item order doesn’t blur.
- Trend the values. Counting property values over time turns custom options into a demand signal you can stock against.
How to build the report in Report Pundit
- Open Report Pundit in your Shopify admin and choose Create Report (or the pre-built “Order Tags & Line Item Properties” template).
- Set the data source to Orders with line-item detail enabled.
- Add standard columns: Order name, Date, Customer, Product, Variant, SKU, Quantity, Price, Order total.
- Add Order tags and Order note columns.
- Add a column for each line-item property you use (e.g. Engraving, Gift message, Custom size).
- Add Note attributes if you capture cart-level attributes.
- Decide whether to split multi-tag orders into rows or keep tags joined, and set your date range.
- Run, confirm a known personalized order shows its property values, and Save.
- Schedule a daily send to fulfillment/production, or export to Google Sheets as a live production sheet.
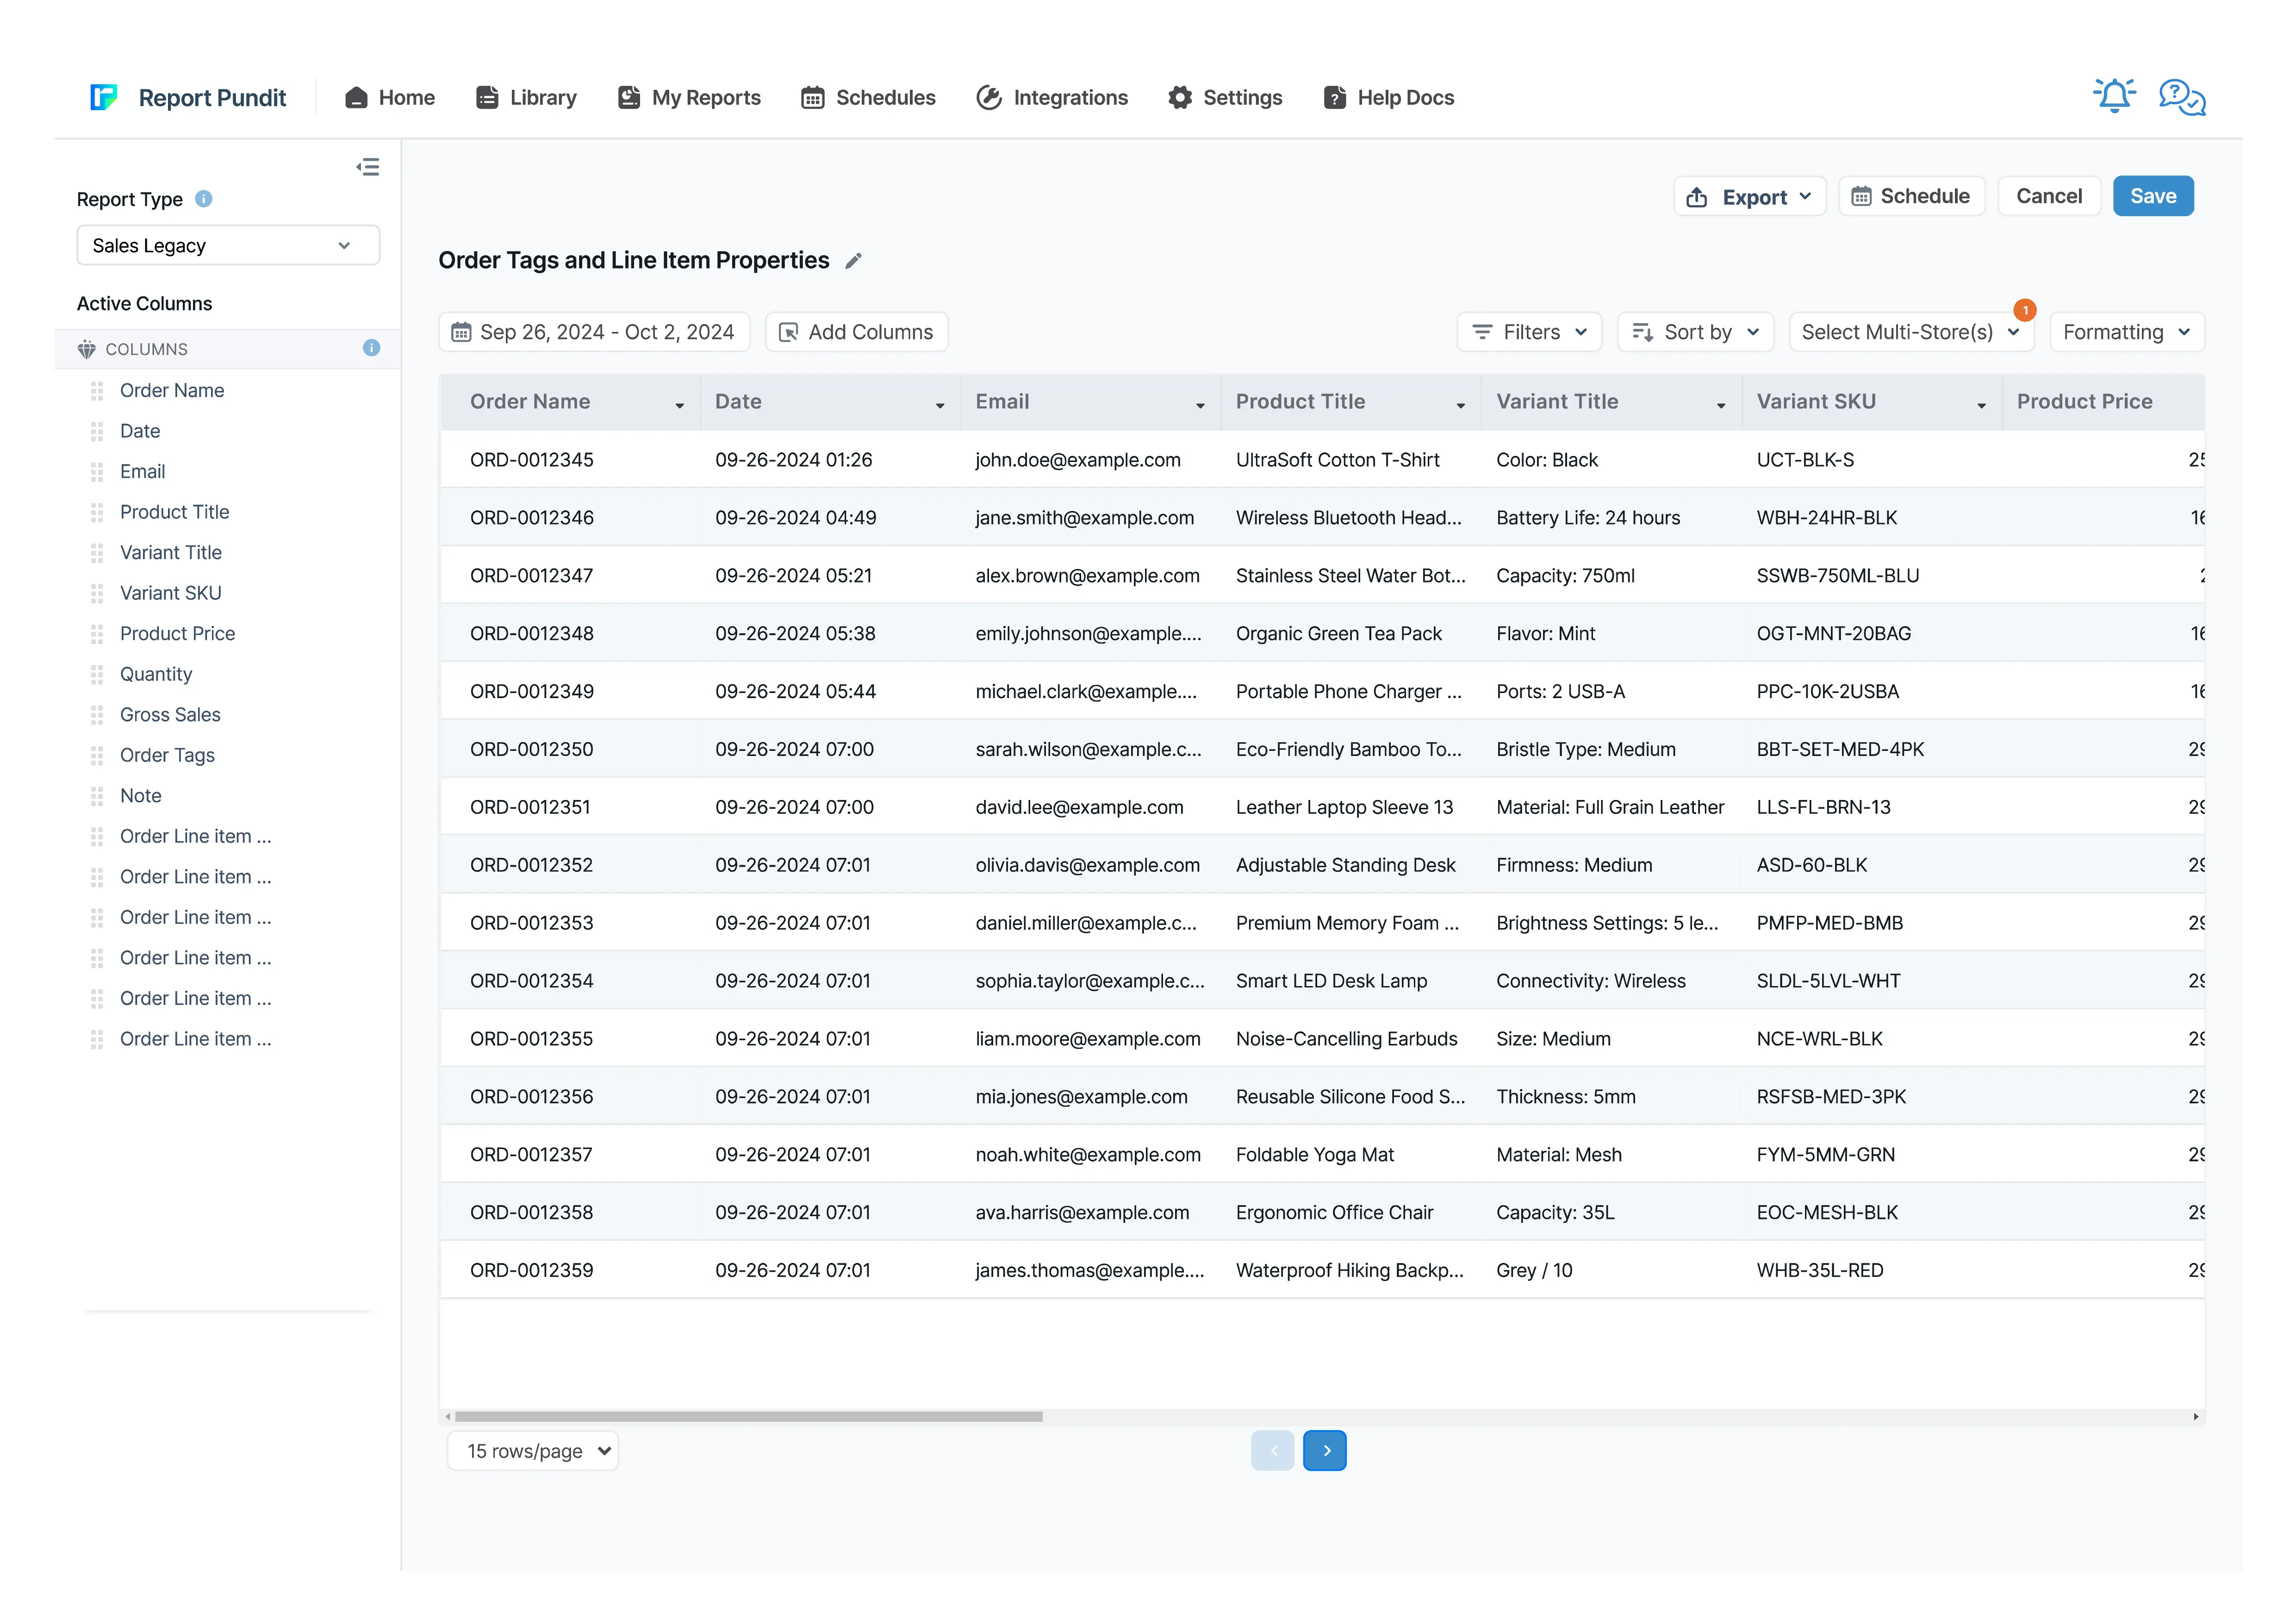
Sample report
Customization & filters
- Add a dedicated column per line-item property you use.
- Split multi-tag orders into rows or keep tags comma-joined.
- Filter by a specific tag, property value, or note attribute.
- Group by property value to trend popular options.
- Combine with metafields for an even richer custom view.
Automate & export
- Schedules — hourly, daily, weekly, monthly, or custom cron
- Delivery formats — Excel, CSV, PDF, or push to Google Sheets in real time
- Group by month or week — trends instead of a static snapshot
- Destinations — email (multiple recipients), Google Sheets, Google Drive, FTP/SFTP, Looker Studio, BigQuery
- Conditional alerts — get notified only if a channel's net sales drop more than X% week-over-week
Report Pundit vs Shopify's native Sales by Channel report
Frequently Asked Questions
Properties are custom fields stored as an array on each line item, and native reports don’t expose them. Report Pundit extracts each property into its own column so you can read and filter it.
Yes. Order tags become a column you can filter and group by — so the taxonomy you use to run the business (fraud-review, VIP, pre-order) is finally analyzable.
Your choice: split each tag onto its own row for counting, or keep tags comma-joined for straightforward filtering. Pick based on the question you’re answering.
Benefits

Product Specific Customization
Enhanced Trendspotting
Order-Specific Properties
Related Reports
Sales by Collections
The Sales by Collections report provides a detailed view of your product sales, inventory costs, and profitability by collection, helping you see which collections drive revenue and how they resonate with your audience, allowing you to tailor your product strategies accordingly.
Sales by Checkout Currency
This report displays the breakdown of your sales by customer currency used at the checkout with the total sales value also being displayed in your local currency.
Order vs Return (Monthly)
A report interpreting monthly returns by comparing the total sales value with the sales value of returned orders, including percentage calculations for both return orders and return value.
Last 24 Hours Orders
Use the Last 24 Hours Orders report to stay updated on all orders placed within the past day. It provides critical insights into sales trends, customer transactions, and order statuses, allowing you to monitor your store's recent activity and make informed business decisions.
Commission
The Commission Report is the key to rewarding store staff and affiliates for sales they generate. It provides an overview of their sales performance along with calculated commissions share.
Finance Summary
The Finance Summary Report provides an overview of your store’s financial performance by aggregating key revenue, expense, and tax data. This report helps store owners understand their overall profitability, cash flow, and key cost drivers, making it essential for budgeting and financial planning
Sales by Device ID
The report displays sales data segmented by device type, such as mobile, desktop, or tablet, allowing merchants to analyze performance based on customer device usage.
Refund
Report Pundit’s Refund Report records the details of money returned by a Shopify merchant to unsatisfied customers when they return the product/service. These reports help the merchant keep track of the refunds issued, monitor customer satisfaction and have a proper record of financial transactions for filing taxes.
Sales by POS
The report provides detailed sales figures and net product counts, accounting for refunds, at each POS location, offering a clear view of actual sales performance and inventory movement.
Sales by Channel
The Sales by Channel report displays sales data based on the source of each sale. It's a valuable report offering insights into multichannel Shopify selling.
Sales by Variant
Gain detailed insights into each product variant's performance with the Sales by Variant Report. Beyond basic sales data, it shows how each variant impacts your store's success. Use it to fine-tune inventory management and identify popular options, helping you make strategic decisions to boost your bottom line.
Sales by Vendor
The Sales by Vendor report analyzes how each vendor's products contribute to your store's success. By examining sales, purchase costs, and profitability, this report provides insights to make strategic decisions, maximize profits, and optimize inventory management based on vendor performance.
Sales by Staff
A report designed for quick analysis of sales attributed to each staff member across all POS locations, with details from gross sales to net sales calculations.
Sales by Product
The Sales by Product report offers details about each product’s sales performance over a given time frame. It provides valuable insights into which of your products are and aren’t selling well. These insights will enable you to make informed decisions about inventory management and marketing and improve your business.
Sales Over Time
Leverage historical data with the Sales Over Time Report. This report covers costs, order details, sales channels, and payment methods, helping you track trends, manage sales tax returns, and assess the effectiveness of each sales channel.
Last 30 days Sales Summary
A report that provides a comprehensive overview of sales performance over the past 30 days, including total revenue, order count, average order value, and product-specific sales trends for detailed analysis.
Sales by Customer
The Sales by Customer Report provides Shopify merchants with valuable insights into customer purchasing behavior. This report breaks down sales by individual customers, highlighting the most valuable and active customers.
Completed Draft Order
This report provides insights into finalized draft orders, displaying detailed information on converted orders, including product details, pricing, and customer data for analysis.
Sales by Discount Code
Sales by Discount Code report in Report Pundit provides a detailed analysis of sales generated through specific discount codes over a defined period.

Build and automate your Shopify Reporting
Unlock the full potential of your Shopify store with Report Pundit. Gain access to over 2000 data fields, automate reports, and make data-backed decisions to grow your business.