How Shopify Inventory Signals Work Together: Stock Levels, Movement, Locations, and Value

.svg)
.svg)
.svg)
Most inventory problems do not come from a lack of data. They come from having too much data that does not connect. You can see your stock levels, track product movement, check where your inventory is stored, and know its total value. But when you look at these numbers separately, they often create confusion instead of clarity.
A warehouse full of stock can look organized until nothing is moving. High inventory value can feel like growth until it starts hurting your cash flow. Even strong sales can hide problems when products are sitting in the wrong locations.
The real issue is not visibility but understanding how everything fits together. When you connect stock levels, movement, locations, and value, your inventory data starts to make sense and leads to better decisions.
Understanding Inventory Data Beyond the Numbers
Inventory numbers give you a quick view, but they do not explain the full picture. What really matters is how stock behaves over time, not just how much you have. To understand true performance, you need to look beyond the numbers and focus on movement and efficiency.
Why Raw Inventory Numbers Don’t Reveal Real Performance
Inventory numbers on their own can feel clear, but they can be misleading. You might see 5,000 units in stock and assume everything is fine. But that number does not answer the real questions. Is the stock actually selling? Is it sitting too long? Is it in the right place?
These numbers are just snapshots. They show what you have, but not what is really going on. Without more context, they miss things like demand changes, slow operations, or cash tied up in stock. As raw inventory is just a snapshot of liability, not profitability. It shows what is sitting on your shelves, not how that stock is impacting your cash flow.
Without context, important signals are missed. You cannot see shifts in demand, delays in operations, or how much capital is locked in products that are not generating revenue. Two businesses can have the same stock levels but completely different performance depending on how fast their inventory moves.
Real inventory performance is always changing. It depends on how your stock moves, where it is stored, and how long it stays there.
When inventory sits unsold, it stops being an asset and becomes a liability. It quietly drains profits through storage costs and ties up cash that could be used for marketing or better-selling products. Raw stock numbers also miss important details like how old the inventory is or how much profit it generates, which means slow-moving items can lose value without being noticed.
To understand true business performance, merchants need to look beyond stock counts and focus on metrics like sell-through rate, inventory age, and return on investment to see how their inventory is actually performing.
The Gap Between Inventory Data and Business Decisions
There is often a gap between inventory data and the decisions a business needs to make. Most inventory data exists in separate pieces, but good decisions depend on how those pieces connect.
For example, a purchasing decision is not just about how much stock you have right now. It also depends on:
- How fast are items selling
- Where the stock is located
- How much money is tied up in slow-moving products
When these signals are not connected, decisions become reactive instead of planned. Merchants may overstock to avoid running out, or understock because they do not see the full picture. Either way, it impacts profitability by tying up cash or missing potential sales.
Why Merchants Misinterpret Inventory Signals
Misinterpretation usually happens when merchants rely too much on just one number.
- High stock levels may look like overstocking, but the inventory could be spread across different locations to meet demand
- Higher inventory value may look like growth, but it can also mean products are sitting too long.
- Looking at only one metric makes it easy to miss the full picture
- When data is not connected, decisions are often based on incomplete information.
There is often a gap between having access to inventory data and actually using it to make profitable decisions. While Shopify dashboards show what stock is available, they do not clearly tell merchants what to do next. Raw data alone cannot answer important questions like when to reorder fast-selling products, which items should be cleared out, or how much capital can safely be reinvested.
When this gap is not addressed, merchants rely on guesswork or incomplete information, which can lead to overstocking or missed sales opportunities. To grow efficiently, inventory data needs to be turned into actionable insights that guide the next business decision.
- Raw inventory data shows numbers but not next steps
- It does not indicate when to restock or reduce inventory
- Slow-moving and high-performing products are not clearly identified
- Decisions often rely on assumptions instead of data
- Converting data into insights helps improve profitability and planning
The Four Inventory Signals Every Shopify Merchant Should Understand
Stock Levels: What Inventory You Actually Have
Stock levels form the foundation of inventory visibility. They answer the most basic question: how much inventory is available at any given moment.
But this number alone does not provide clarity. High stock levels could mean you are well prepared, or they could indicate overstocking. Low stock might reflect efficiency, or it could signal a risk of running out.
On their own, stock levels are neutral. Their real meaning depends on how they connect with movement, location, and value.
Inventory Movement: How Stock Is Changing
Inventory movement shows how stock flows over time. It reflects sales, returns, adjustments, and transfers.
This is where inventory starts to tell a story. Movement reveals patterns that static numbers cannot show. It highlights demand trends, operational inconsistencies, and corrections in stock.
A stable stock level with strong movement often indicates healthy sales and replenishment. The same stock level with little movement may point to stagnation.
Movement turns inventory from a static number into a dynamic signal.
Location Distribution: Where Inventory Sits
Inventory is not just about how much you have, but also where it is placed. Location distribution shows how stock is spread across warehouses, stores, or fulfillment centers. Poor distribution can create imbalances where one location runs out of stock while another holds excess.
This affects delivery speed, shipping costs, and customer experience. Even with sufficient total inventory, poor placement can lead to missed opportunities.
This is why many merchants rely on reports that break down inventory by product and location to get a clearer picture of distribution.
Inventory Value: How Much Capital Is Tied Up
Inventory value connects stock to its financial impact. It shows the amount of money currently invested in inventory.
This signal directly affects cash flow. A high inventory value may look positive, but if products are not moving, it represents capital that is not generating returns.
On the other hand, lower inventory value combined with steady movement can indicate efficient operations and better cash utilization.
If you are managing multiple stores, getting an accurate view of inventory value becomes even more important, especially when tracking it across all locations.
Why Looking at Only One Inventory Metric Creates Blind Spots
Looking at just one inventory metric can create blind spots in your decision-making. It may give a quick answer, but it often hides important details about what is really happening.
Stock on hand, for example, shows how much inventory you have, but it does not tell you if that stock is selling, sitting too long, or placed in the right locations.
Why Stock on Hand Alone Is Misleading
- Stock on hand shows how much inventory you have, but not how it is performing
- High stock may look safe, but it can hide slow or unsold products
- Low stock may seem efficient, but it can lead to missed sales
- Without movement or sales data, this number gives only a surface-level view
How Adjustments and Transfers Reveal Operational Issues
- Inventory adjustments and transfers can highlight hidden problems
- Frequent adjustments may indicate incorrect records, damaged or lost stock, or inefficient processes.
- Transfers between locations may show poor planning or uneven demand
- When combined with movement data, they reveal operational gaps
Tracking these inventory adjustments properly helps identify gaps and maintain accurate inventory records over time.
Why Inventory Value Needs Movement Context
- Inventory value alone does not show true performance
- High value may seem positive, but it can mean cash is stuck in unsold stock
- Lower value with fast-moving products often indicates better efficiency
- Value becomes meaningful only when you know how quickly stock turns into sales
How Shopify Reports Help Reveal Inventory Signals
While Shopify provides multiple reports that surface inventory data, each one typically focuses on a single dimension of inventory. This makes it necessary to interpret them collectively rather than individually.
Comparison of Inventory Signals Across Reports:
Which Reports Reveal Stock Levels
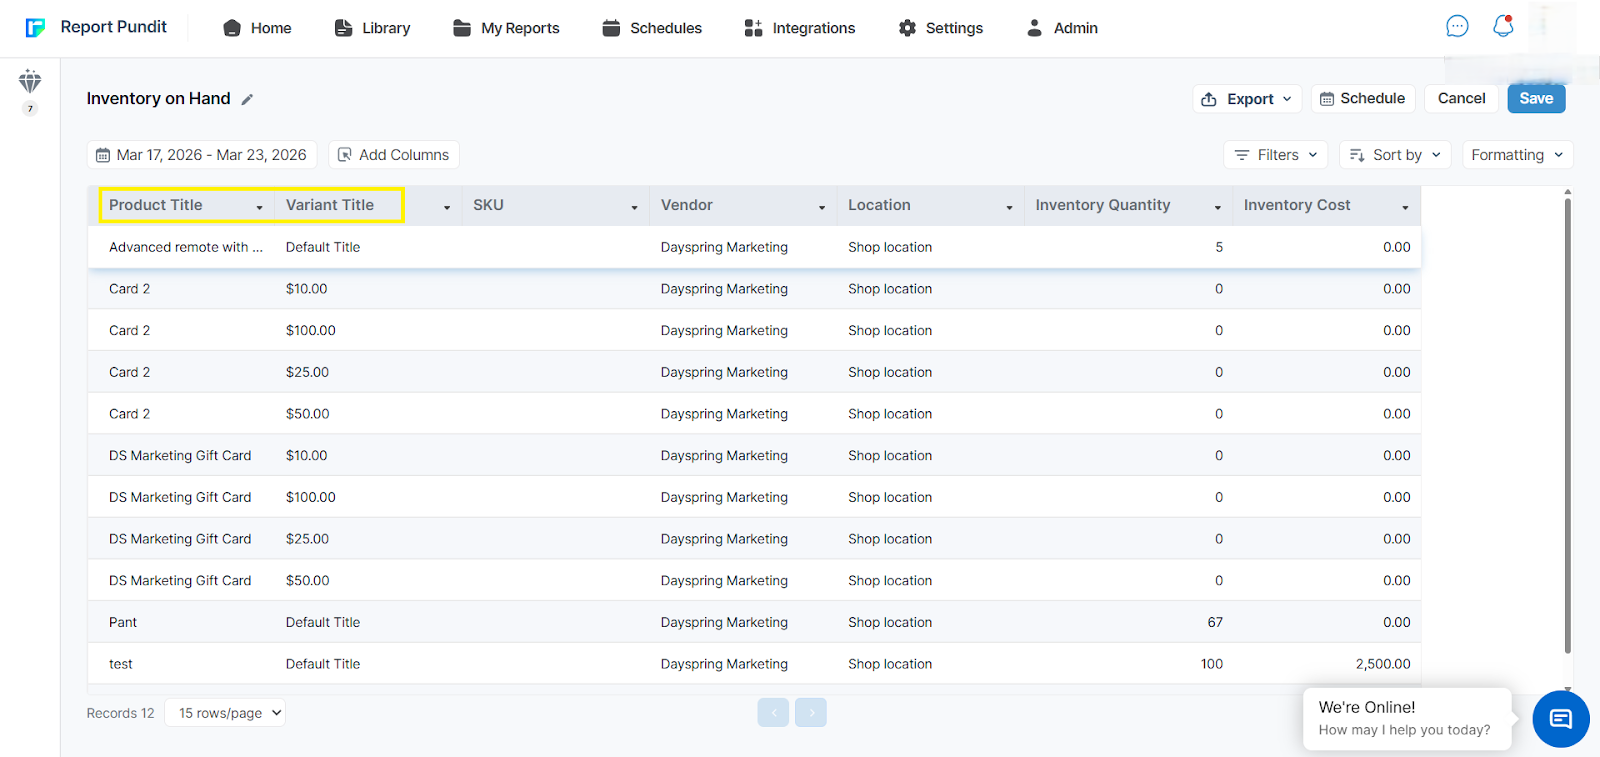
Stock level insights typically center around current availability. They provide visibility into the current inventory level, but do not explain how that inventory arrived or how it will change. For example, the Inventory on Hand Report provides a real-time snapshot of available quantities across products.
Which Reports Reveal Movement and Adjustments
Movement-related insights highlight activity. They show what is being sold, returned, adjusted, or transferred, with reports like the Products by Sell-through rate and Sales by Product report reflect selling patterns and the Stock Adjustment Report capturing manual or system-driven inventory changes. These signals are essential for understanding trends and operational patterns, not just the current state.
Which Reports Show Inventory Value and Financial Exposure
Value-focused insights translate inventory into monetary terms, helping merchants understand how much capital is invested in stock and where financial risks may exist, with the month-end inventory value report providing a clear snapshot of total stock worth at a specific point in time.
The Real Challenge: Inventory Signals Are Scattered Across Reports
Inventory data is often spread across multiple reports, making it hard to see the full picture in one place. Merchants may have access to all the information they need, but it is not organized in a way that helps them connect the dots. This makes it difficult to turn data into clear and confident decisions.
Advanced third-party inventory apps help bring stock levels, demand, and purchasing insights into a single view, making it easier to plan restocks, respond to demand changes, and prevent overstocking.
Why Merchants Struggle to Connect Inventory Insights
Merchants struggle to connect inventory insights because their data is spread across different reports instead of being in one clear view. Even when all the information is available, it is not easy to piece together and turn it into meaningful decisions.
For example, current inventory for a product variant can be checked in the Products section, but inventory reports in Shopify typically reflect data captured at a fixed time, such as 12 AM midnight. This means merchants either have to manually verify stock from the Products section or wait for the next report update, often switching back and forth between views just to understand the current situation.
- Merchants have to manually connect the information
- This process takes time and increases the chances of errors
- As the business grows, managing scattered data becomes harder
- Without a complete view, insights stay partial, and decisions become reactive
How Fragmented Reports Slow Operational Decisions
Fragmented reports slow down operational decisions because important data is spread across multiple places instead of being available in one clear view. Even simple decisions take more time when information is not connected.
- Merchants need to check multiple sources to make a decision
- For example, evaluating overstock requires checking stock levels, movement, and value separately
- Combining this information takes time and delays action
How Report Pundit Brings Inventory Data into One View
Instead of switching between multiple reports, tools like Report Pundit allow merchants to combine stock levels, inventory movement, location data, and inventory value into a single, unified report.
This means you no longer have to manually connect data from different sources. You can view:
- Current stock levels across products and variants
- Sales and movement trends over time
- Inventory distribution across locations
- Total inventory value and financial exposure
Turning Inventory Reports Into Inventory Intelligence
To truly manage inventory well, you need connected insights that bring data together and show how different factors relate to each other. This is what turns basic reports into meaningful intelligence.
Why Merchants Need Connected Inventory Insights
Inventory intelligence comes from connection, not collection. When stock levels, movement, location, and value are analyzed together, patterns emerge:
- Slow-moving high-value stock
- Fast-selling products with uneven distribution
- Locations with recurring imbalances
Bringing Stock Levels, Movement, and Value into One View
A unified view of inventory signals transforms how merchants operate. Instead of switching between disconnected data points, merchants can:
- Identify inefficiencies faster
- Align inventory with demand
- Optimize cash flow and stock allocation
Conclusion
Inventory data in Shopify is only useful when it is connected and viewed together. Looking at stock levels, movement, locations, and inventory value separately can create confusion and lead to incomplete decisions. These numbers may show what you have in your store, but they do not explain how your inventory is actually performing or where the problems are.
To make better decisions, you need to go beyond basic reports and understand how inventory changes over time. This includes how fast products are selling, where they are stored across locations, and how much money is tied up in stock. When these signals are not connected, decisions become reactive and can lead to overstocking, stockouts, or cash flow issues.
The key is to bring all inventory data into one clear view. When stock levels, movement, locations, and value are analyzed together, it becomes easier to spot patterns and take action. This helps merchants reduce inefficiencies, plan better, and manage inventory in a more profitable and controlled way.

Build and automate your Shopify Reporting
Unlock the full potential of your Shopify store with Report Pundit. Gain access to over 2000 data fields, automate reports, and make data-backed decisions to grow your business.