How to Use Shopify Reports for Growth, Retention, and ROI

.svg)
.svg)
.svg)
Customer retention plays a crucial role in sustainable growth and achieving long-term ROI for Shopify stores. For store owners and marketers like you, understanding what customers do after their first purchase is essential to evaluating performance beyond basic sales numbers.
Retention-focused reports highlight insights that basic metrics often overlook, including repeat purchase behavior, customer lifetime value, and the impact of marketing efforts on revenue over time. With the right Shopify reports, it becomes easier to track growth, improve retention and ROI strategies, and measure return on investment accurately.
Identify Your Fastest-Growing Products and Channels
Growth-oriented reports provide a clear view of behind-the-scenes performance. By analyzing these reports, you can identify opportunities, address risks early, and align strategies with measurable outcomes.
1. Total Sales Over Time
This report shows how your orders and revenue change over a selected time period, such as daily, weekly, monthly, or a custom date range. It helps you track overall sales performance and identify patterns in revenue movement. By analyzing trends over time, you can spot seasonality, measure growth rate, and quickly identify spikes or drops in sales.
Key Insights You Can Get From These Reports
- Identify peak sales periods to plan inventory, detect revenue declines early, and investigate causes such as traffic drops or conversion issues.
- Compare performance before and after marketing campaigns or product launches
- Understand which activities contribute most to revenue growth
- Use trends over time to refine sales and marketing strategies
2. Average Order Value (AOV)
This report measures the average amount customers spend per transaction over a selected time period. Average order value is calculated by dividing total revenue by the number of orders, showing the average revenue generated per order.
Tracking AOV over time helps you understand changes in customer purchasing behavior and the effectiveness of pricing, bundling, and promotion strategies. Tactics such as upselling, cross-selling, and offering incentives for larger purchases can increase revenue per order and improve overall growth for e-commerce businesses.
Key Insights You Can Get From These Reports
- Introduce product bundles, upsells, and cross-sell recommendations to increase revenue per order
- Set free shipping thresholds slightly above your current average order value to encourage higher spend
- Optimize pricing strategies based on customer purchasing behavior and order value trends
3. Session by Landing Page
Often, a customer starts their journey on your website from a landing page. A landing page is the first page they view when they begin a session. This could be a product page, collection page, blog post, or even your home page, depending on where they came from.
Sessions by landing page displays the total number of sessions and unique visitors to each page of your Shopify store.
Key Insights You Can Get From These Reports
- Optimize high-traffic landing pages for better conversion by analyzing visitor behavior
- Use heat map tracking to understand how visitors navigate different pages and where they spend the most time
- Identify high engagement and drop-off areas to improve layout, messaging, and call-to-action placement
- Prioritize SEO and paid traffic that show strong engagement and conversion potential
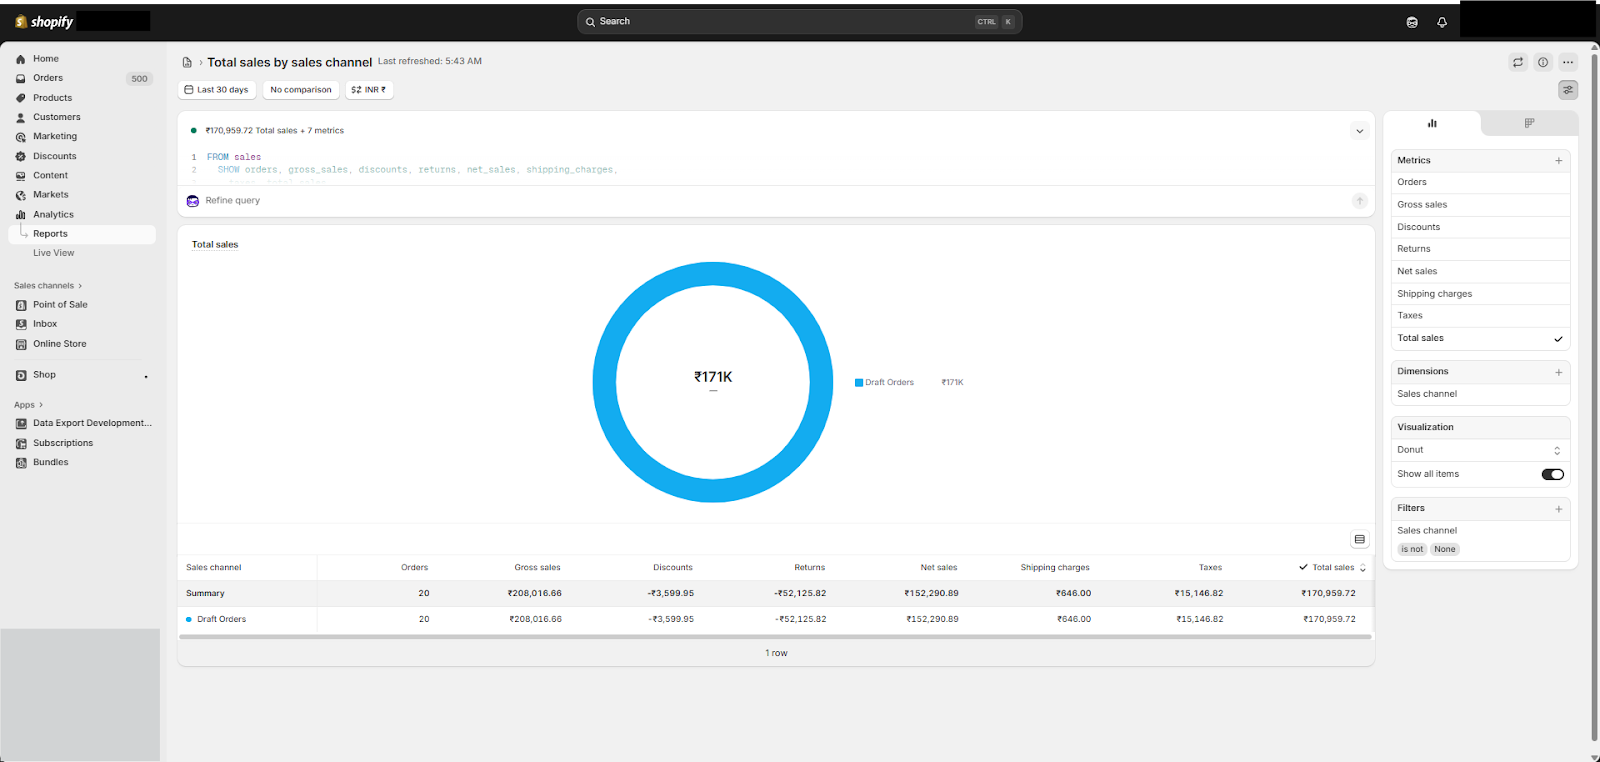
4. Total Sales by Sales Channel
The report breaks down performance by sales channel, like Online Store, Shop app, and POS, highlighting which ones generate the most revenue. And you'll have a donut chart that clearly visualizes your channel mix, ranking each channel by total sales so you can quickly grasp where revenue is coming from.
This makes it easier to identify your top-performing channels and decide where to prioritize your marketing efforts for maximum impact.
Key Insights You Can Get From These Reports
- Shift budget toward higher-ROI channels
- Reduce spend on underperforming sources
- Align channel strategy with customer acquisition vs. retention goals
- Identify products or customer segments that perform better on specific channels and tailor your approach accordingly
- Prioritize the right channels when expanding into new markets based on proven regional performance
5. Sales Attributed to Marketing
This report provides a clear view of how your marketing efforts are impacting sales over the past 30 days. By focusing on revenue and orders driven by external marketing channels, it helps you identify which campaigns and channels are performing best and where there are opportunities to optimize for growth.
Key Insights You Can Get From These Reports
- Allows you to measure the true return on investment (ROI) of your marketing campaigns
- Identify and scale high-performing campaigns to maximize revenue
- Pause or refine underperforming ads to improve overall marketing efficiency
6. New vs Returning Customer Sales
This report provides insight into how your revenue is split between first-time buyers and returning customers, giving you a clear view of the health of your customer acquisition and retention efforts. Maintaining a strong balance is ideal: new customers indicate audience growth, while returning customers reflect satisfaction and loyalty. It highlights the revenue contribution from both first-time and repeat buyers, helping you make informed decisions to drive long-term growth.
Key Insights You Can Get From These Reports
- Boost customer retention with loyalty programs and targeted email or SMS campaigns
- Balance marketing spend between acquiring new customers and retaining existing ones
- Identify opportunities to encourage repeat purchases and increase lifetime value
- You can see exactly how much a specific customer spent during a selected time period without unrelated or new customers affecting your report.
7. Bundle items versus non-bundle sales
This report compares the performance of bundled products versus individual product sales. Specifically, the Bundle Component and Product Comparison report shows the total sales of products sold as part of bundles compared to the sales of the same products sold individually. It helps you understand how bundling impacts revenue and customer purchasing behavior.
Key Insights You Can Get From These Reports
- Validate and refine bundle pricing strategies for maximum impact
- Identify bundles that drive higher average order value (AOV)
- Optimize merchandising and promotions based on bundle performance
- Bundles typically increase AOV since customers purchase multiple items together in a single purchase.
Understand Your Customer Retention Metrics for Better Decisions
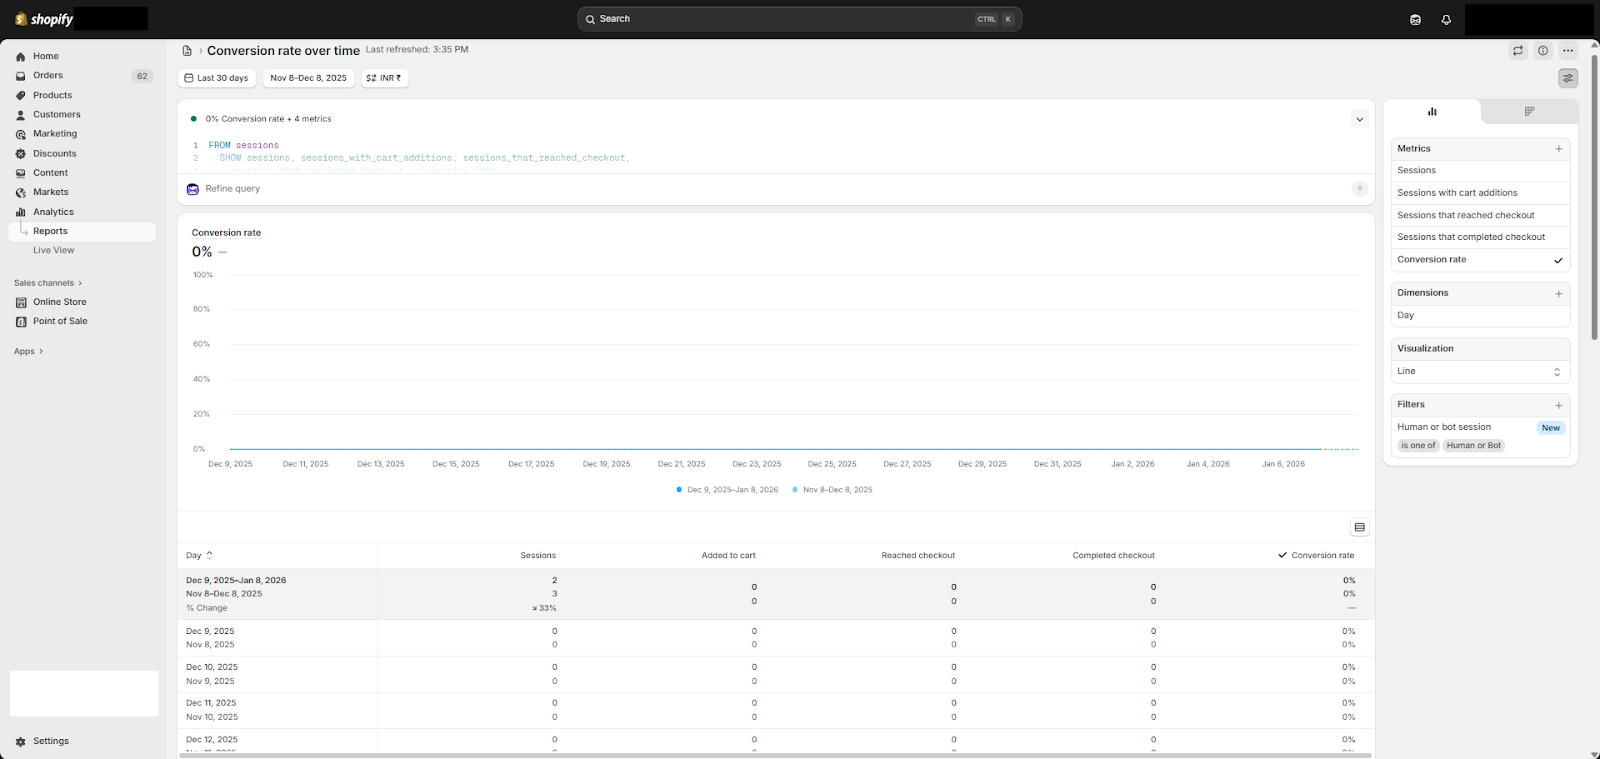
1. Conversion rate over time
This report breaks down your conversion funnel and tracks metrics like total sessions, cart additions, checkouts started, and completed purchases to calculate the overall conversion rate. You can view results by day, week, or month, and compare different date ranges to identify trends. It shows the percentage of sessions that convert into orders over a selected time period, helping you pinpoint opportunities to improve your store's performance.
Key Insights You Can Get From These Reports
- Measure the impact of UX improvements, pricing adjustments, or promotional campaigns on conversions
- Distinguish between issues caused by traffic growth and those affecting conversion rates
- Spotting patterns in how your conversion rate fluctuates helps you identify seasonal peaks, measure campaign effectiveness, and understand shifts in customer behaviour
- Time series conversion data shows how discounts, bundles, and pricing changes influence purchase decisions.
2. Returning customer rate over time
This report tracks the percentage of customers who make more than one purchase, showing how your returning customer rate changes over time. It highlights trends, patterns, and anomalies, making it easy to monitor customer loyalty. You can view both the daily rate and overall totals, complete with percent change indicators to quickly gauge shifts in repeat purchase behavior.
Key Insights You Can Get From These Reports
- Measure the effectiveness of retention efforts such as email, SMS, and loyalty programs
- Identify products that encourage repeat purchases and drive customer loyalty
- Compare performance to the previous 30-day period to track retention trends over time
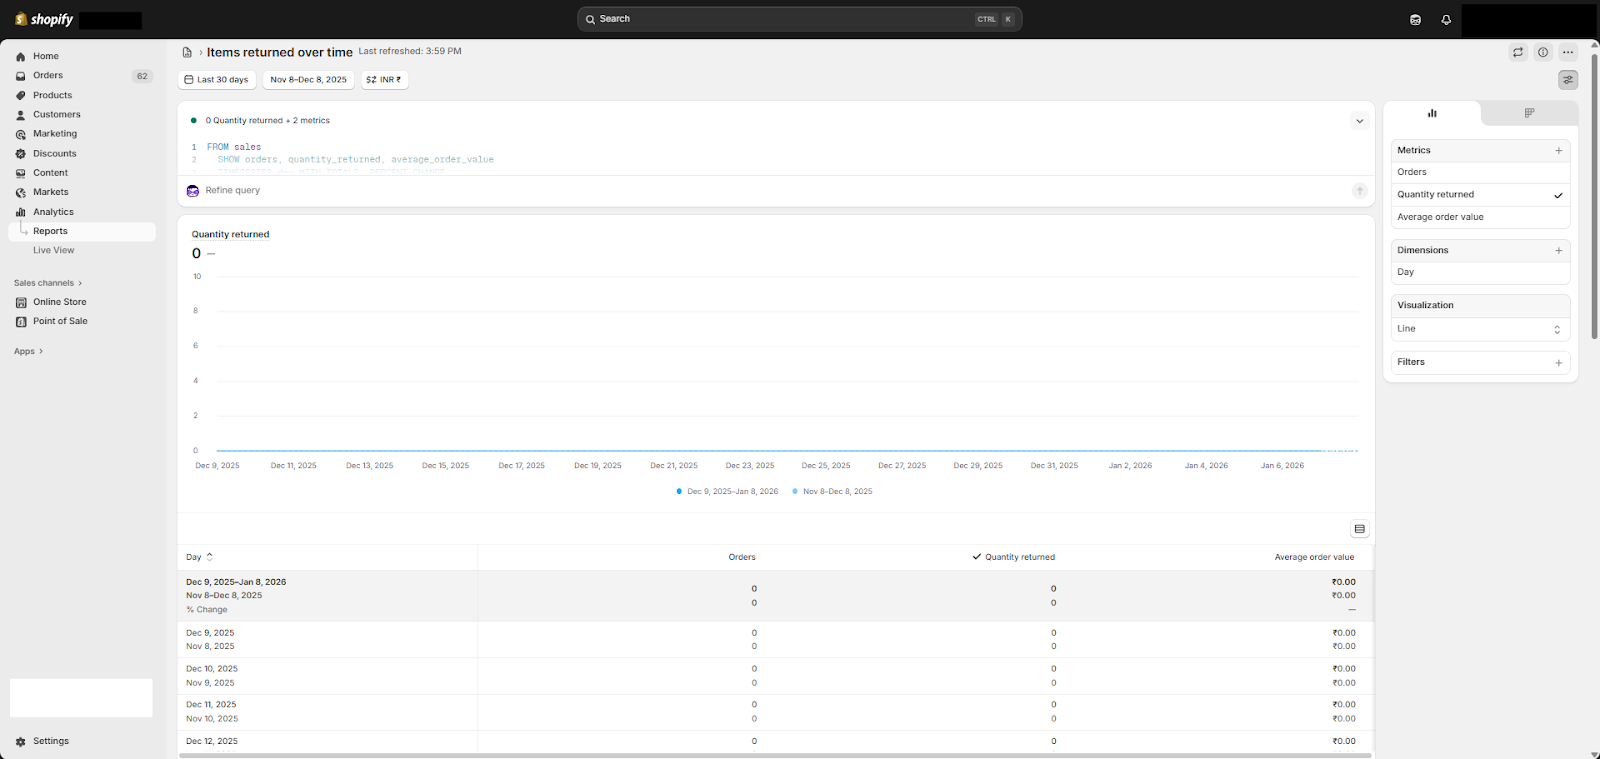
3. Items returned over time
This report tracks the volume and value of refunded or returned orders, showing how returns fluctuate over time. It highlights daily return quantities, making it easy to spot patterns, spikes, or concerning trends. You can view both daily changes and overall totals, complete with percent change indicators to monitor return activity effectively.
Key Insights You Can Get From These Reports
- Identify low-quality or misleading products that may be driving returns
- Improve product descriptions and set clearer customer expectations
- Time series return data reveals sizing accuracy and highlights products running large or small.
4. Gross profit by product
The reports show which products are actually generating profit, not just sales volume. High sales do not always translate into high profitability, making this analysis essential for smarter product decisions.
They highlight the profit margin for each item, helping you evaluate whether your pricing strategy is effective. With this insight, you can identify which products to promote more aggressively and which may require repricing or even discontinuation to improve overall profitability.
Key Insights You Can Get From These Reports
- Prioritize high-margin products in marketing and promotional efforts
- Compare high-volume, low-margin products with low-volume, high-margin products to optimize product mix
- Identify whether vendor or supplier costs are reducing overall profits
- Understand which product types are most and least profitable
- Identify opportunities to adjust pricing or negotiate better supplier costs
5. Top product variants by unit sold
This report measures the net number of items sold for each product variant over the last 30 days. It breaks down sales by product title and variant SKU, making it easy to see which specific variants are performing best. The report is sorted from highest to lowest sales volume, clearly highlighting the products and variants that generate the most sales.
Key Insights You Can Get From These Reports
- Focus inventory planning on the top-selling product variants
- Identify size distribution patterns, such as consistently high demand for specific sizes
- Understand customer preferences for colors or styles
- Spot low-performing variants that may turn into dead stock and require clearance
- Track festive trends in variant popularity to plan inventory more effectively
Maximize Your Store ROI With Actionable Reports
1. Finance Summary
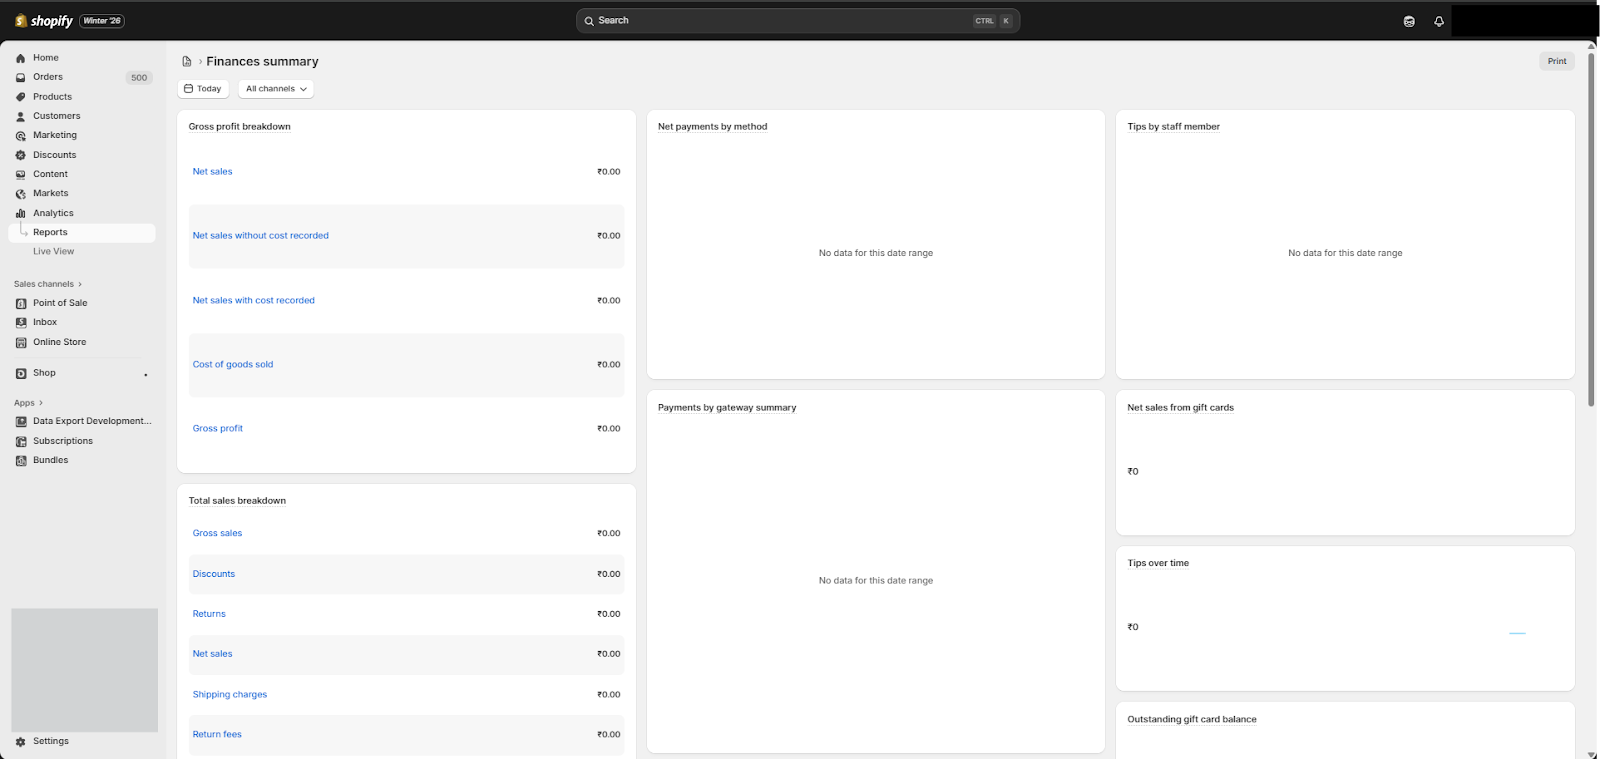
Shopify’s updated Finance Summary provides a clear snapshot of your store’s financial performance, including sales, payments, gift cards, tips, and gross profit for a selected time period. However, Shopify does not offer a dedicated report based on this Finance Summary for deeper analysis or sharing.
Report Pundit helps you overcome this limitation by consolidating all your financial metrics into one clean, accounting-ready report, which eliminates the need to switch between multiple dashboards. With automated scheduling and customizable pre-built summaries, sharing accurate finance data becomes effortless.
Key Insights You Can Get From These Reports
- View gross sales alongside discounts, returns, shipping, taxes, and fees to understand actual net revenue
- Track money coming in and going out to manage working capital effectively as you scale internationally
- Use consolidated tax data to simplify filings and maintain compliance across expanding markets
- Monitor shipping, payment processing, and other expenses to improve margins without impacting your premium brand positioning
2. Sales by discount code
This report shows how your discount codes are performing and their overall impact on revenue. It highlights how often each discount code is used and the amount of revenue generated through those discounts, helping you evaluate the effectiveness of your promotional strategies.
Key Insights You Can Get From These Reports
- Measure the ROI of discounts and promotional campaigns
- Identify whether customers are becoming dependent on discounts to convert
- Optimize discount strategies based on retention goals versus customer acquisition goals
3. Items Bought Together
The Items Bought Together report reveals which products customers commonly purchase together in the same order, so you can identify bundling, upsell, and promotional opportunities.
How You Can Turn Reports into Actionable Decisions
- Create product bundles and kits to encourage larger orders
- Add “Frequently Bought Together” recommendations to increase cross-selling opportunities
- Optimize cross-sell placements on product pages (PDP) and cart pages for higher conversions
4. RFM Customer Analysis
The RFM Customer Analysis report automatically segments customers with tags like New, Loyal, Active, Dormant, Previously Loyal, and Champions, which makes it easy to understand each customer’s status and target them with the right campaigns and offers.
Key Insights You Can Get From These Reports
- Automatically identify top customers, at-risk buyers, and win-back opportunities instead of treating all customers the same
- Build highly relevant Klaviyo email flows using RFM scores, such as VIP rewards for high-value buyers or re-engagement offers for lapsed customers
- Detect early signs of churn and intervene with timely outreach to protect and grow repeat purchase rates
- Focus marketing spend on customer segments with the highest return potential rather than broad, untargeted campaigns
- Identify customers to nurture into premium tiers and tailor engagement strategies for each segment
Common Mistakes When Using Shopify Reports
Shopify reports offer valuable insights into sales, customers, and performance across your store. However, the real impact comes from how those reports are interpreted and applied. Many stores already have access to the right data, but without a clear approach, it's pretty hard to grow, retain, and increase ROI.
1. Using the Right Filters for Clear Insights
Shopify reports become most useful when viewed with the right filters in place, such as date range, sales channel, or store location. Applying these filters helps bring clarity to recent performance and highlights trends that matter for specific decisions.
When reports are aligned with a clear goal, like reviewing a campaign or understanding seasonal demand, it becomes much easier to spot opportunities and take focused actions that support store growth.
2. Looking at Metrics Together
Each metric in Shopify tells part of a larger story. Sales, profit, conversion rate, and returns work best when viewed together to provide a complete picture of performance.
By connecting related KPIs, you can better understand how pricing, marketing, and product choices impact both revenue and profitability, leading to more balanced growth decisions.
3. Understanding How Attribution Works
Marketing reports provide helpful insight into which channels contribute to conversions. These reports often focus on the final interaction before purchase, offering a clear view of what closes the sale.
When combined with an understanding of earlier touchpoints like email or ads, attribution data becomes even more helpful to guide smarter budget allocation across channels.
4. Reviewing Trends Over the Right Time Frame
Comparing data across time periods helps smooth out short-term fluctuations and highlights true performance trends. Looking at longer ranges alongside recent data gives a better context for changes in sales, traffic, or customer behavior.
This approach supports steady decision-making and helps ensure actions are based on patterns that contribute to long-term store growth.
Why Default Shopify Reports Are Not Enough for Accurate Profit and ROI
Shopify’s reports focus on top-line metrics like revenue and order volume, which show how much you’re selling but not how much you’re actually earning. Essential metrics like shipping expenses, marketing spend, payment processing fees, refunds, and discounts are either reported separately or not fully reflected in profit calculations. This makes it difficult to see the real financial impact of each order, product, or campaign in one place.
As a result, you may rely on manual data exports, spreadsheets, and consolidate profit insights. This approach is time-consuming and prone to errors. Additionally, Shopify’s default reports offer limited flexibility. Without support for custom fields, formulas, or net profit views, it’s challenging to customize reports to your specific store needs.
This is where custom fields and advanced reporting become essential for making informed growth, retention, and ROI decisions.
Case studies
Growth Case Study
One of our customers wanted a clear way to compare Black Week sales performance year over year to understand growth trends. They were facing challenges with exporting comparison data to Excel, as the details often did not transfer correctly, making it difficult to analyze performance.
So, we recommended using the Sales Over Time comparison report and exporting it as a PDF to preserve the comparison view. This allowed the customer to see accurate sales trends across periods, evaluate the effectiveness of campaigns, and make data-driven decisions to optimize future promotions and peak sales strategies.
ROI Case Study
A customer wanted to accurately calculate profit without including taxes, while factoring in all other costs such as shipping, marketing, and product costs. Their goal was to understand the true profitability of each order and product. Our team set up customized reporting in the app to calculate both gross revenue (after taxes) and net revenue (subtracting discounts, refunds, and shipping revenue), while applying formulas to include variable shipping costs based on order weight.
This enabled our customer to see the real impact of costs on profit, make informed pricing decisions, and optimize their marketing spend for better return on investment.
Retention Case Study
Another customer wanted an easy way to track the total number of returning customers for the year, alongside first-time buyers, and correlate this with total sales. Previously, they had to export data and manually calculate totals, which was time-consuming and prone to errors. Our team created a Customer-level report that displayed both returning and new customers, as well as their total spend within a selected date range.
This allowed the customer to analyze customer loyalty, track repeat purchase behavior, and identify high-value customers, enabling them to make more efficient decisions regarding targeted retention and reward programs.
Conclusion
By using such detailed Shopify reports, you view actionable insights that go beyond basic metrics. Tracking sales trends, customer behavior, and marketing results allows you to optimize inventory, pricing, promotions, and campaigns. This allows you to identify top-selling products, maximize your marketing return on investment to encourage repeat purchases, and refine bundling or discount strategies, ultimately driving steady growth, stronger customer loyalty, and higher profitability for your store.


Build and automate your Shopify Reporting
Unlock the full potential of your Shopify store with Report Pundit. Gain access to over 2000 data fields, automate reports, and make data-backed decisions to grow your business.