Shopify Current Inventory Report for Real-Time Stock Tracking

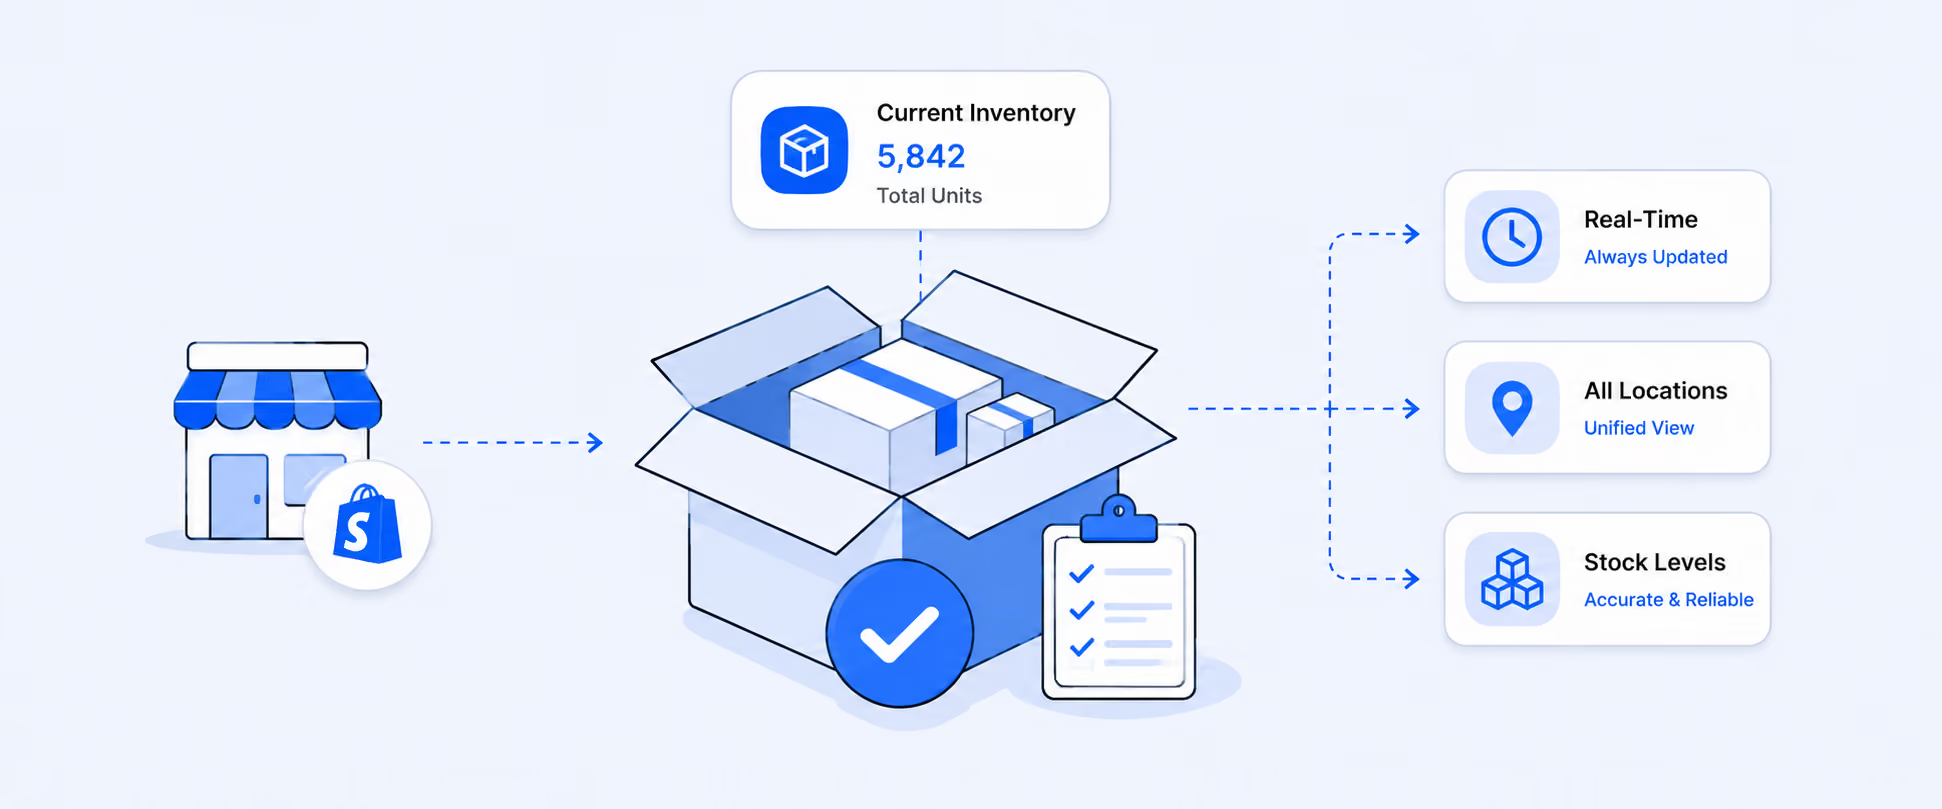
Shopify does not provide a real-time current inventory report inside its Analytics section. The built-in inventory reports only show data from a midnight snapshot, not what's actually in stock right now. To see current inventory, you either check each product manually in the Products section, export a CSV, or use a reporting app that pulls live data from the Shopify API.
This guide covers exactly what Shopify's inventory reports include, where they fall short, and how to build a current inventory report that reflects your actual stock levels across every product, variant, and location.
Key Takeaways
- Shopify's inventory reports refresh once a day at midnight and show month-end snapshots rather than current stock levels.
- You can check current inventory manually under Products > Inventory, but this view cannot be exported or filtered like a report.
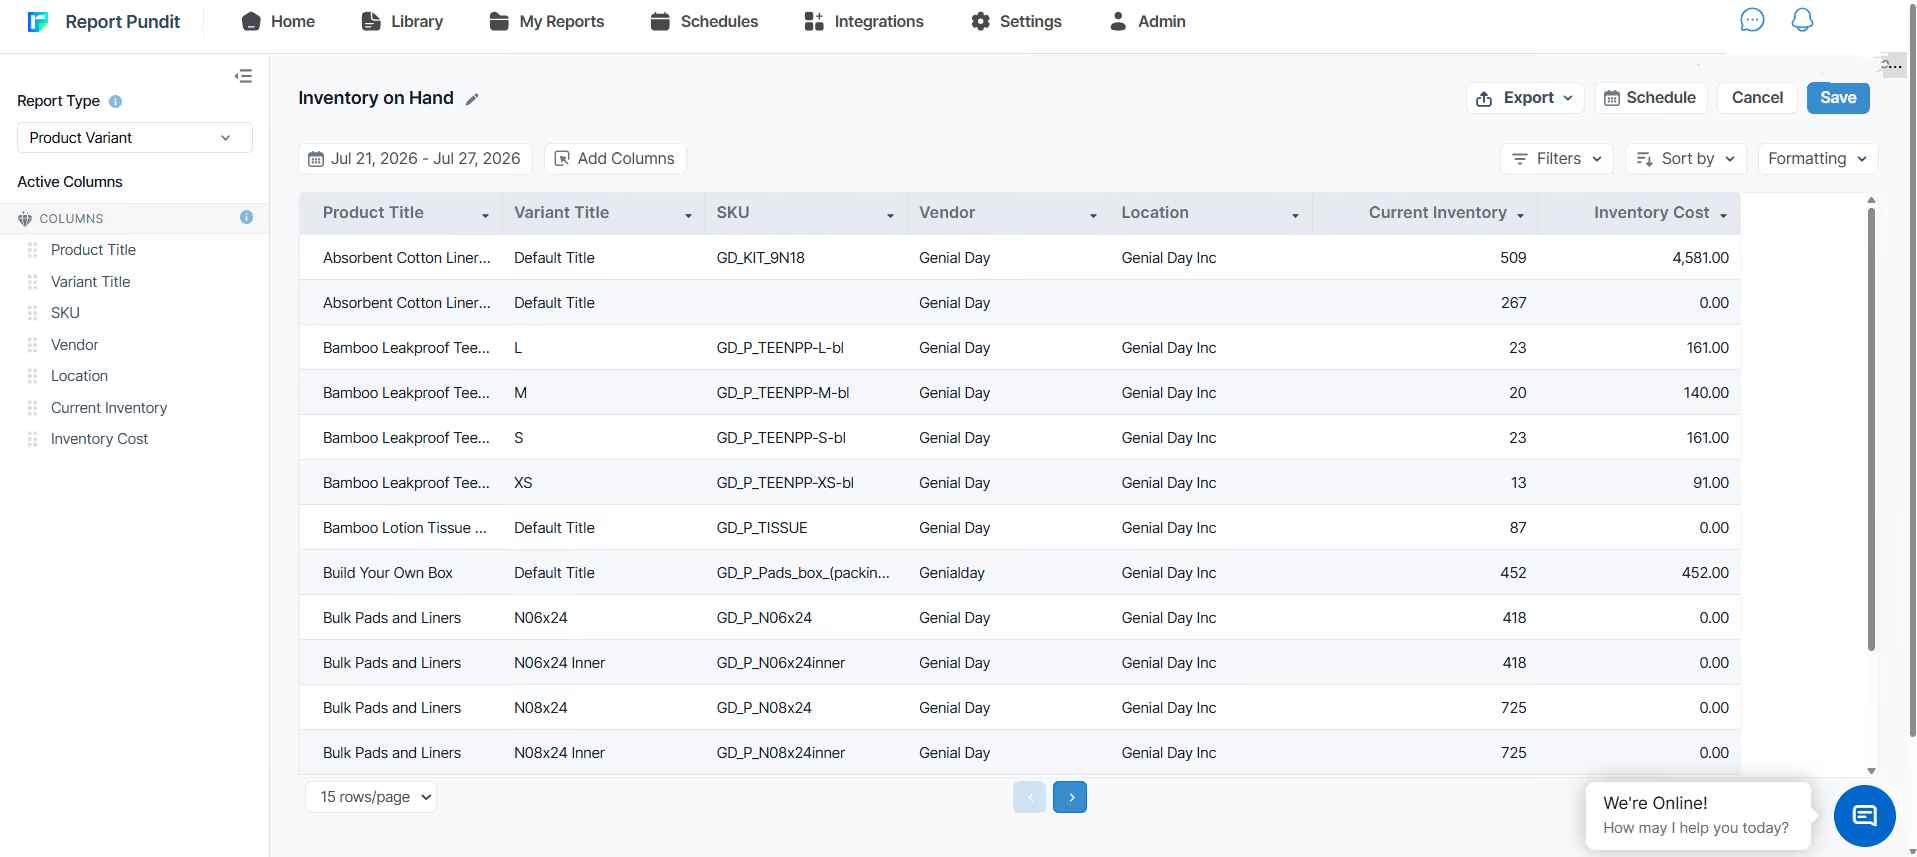
- A reporting app such as Report Pundit lets you add current inventory to any report alongside more than 30 inventory fields.
- Scheduling reports daily or hourly eliminates the need to check stock levels manually.
- Report Pundit provides 30+ native integrations, including PayPal, ShipStation, Klaviyo, and more.
- Comparing current inventory with historical snapshots helps identify fast-selling products and slow-moving stock.
Does Shopify have a current inventory report?
No. Shopify does not offer a dedicated current inventory report. Its built-in Analytics reports show inventory as it stood at midnight or at the end of the previous month. The only place to see actual current stock is the Products > Inventory page, which you have to check one product at a time.
This is a common pain point. Merchants who manage more than a handful of SKUs, or who sell across multiple locations, need to see live stock counts in a single view. Shopify's reporting simply wasn't built for that.
What Shopify's inventory reports actually show
When you go to Analytics > Reports and filter by the Inventory category, Shopify gives you access to several report types. All of them are useful, but none show current, real-time inventory. Here's what each one covers:
These reports are designed for trend analysis and planning. They answer questions like "how fast is this product selling?" and "how much was in stock at the end of last month?" They don't answer "how many units do I have right now?"
To access these reports: go to your Shopify admin, then Analytics > Reports. Click the Category filter and select Inventory. You can customize columns and apply filters, but the underlying data still comes from Shopify's periodic snapshots.
For a full walkthrough of every Shopify inventory report, see our guide to Shopify inventory report
Why there's no real-time inventory report in Shopify
The core limitation is how Shopify separates its live data from its reporting data. Two different systems are at work, and they don't behave the same way.
Shopify's Analytics dashboard and the Products > Inventory page both update quickly. Open either one, and the numbers you see reflect recent changes, usually within a minute. Shopify's API works the same way: it returns the current inventory level per variant per location the moment you query it.
But the inventory reports under Analytics > Reports are a different system entirely. Reports like the month-end inventory snapshot, sell-through rate, and ABC analysis don't pull live data every time you open them. They work from periodic snapshots that Shopify captures at fixed intervals.
The "ending inventory" figures in these reports reflect stock at a specific point in time, not a live feed. That's why the number you see on the Products > Inventory page can differ from what a saved report shows for the same product.
Shopify does flag abnormal delays with a warning icon on affected reports, which means the system expects data to flow through reasonably fast. But "reasonably fast for a snapshot" and "real-time" are two different things. You can't open an inventory report at 2 PM and know with certainty that it reflects a sale that happened at 1:45 PM.
This gap matters most for stores that:
- Sell high-velocity products that can stock out within hours
- Manage inventory across multiple warehouse or retail locations
- Need to send accurate stock data to suppliers, accountants, or warehouse teams during the day
- Use Shopify POS alongside online sales, where stock changes happen continuously
The Products > Inventory page does show current data, but it's a browsing view, not a report. You can't export it, filter it by location in bulk, schedule it to be sent somewhere, or add calculated fields like inventory cost or sale value.
How to check current inventory in Shopify (3 methods)
Even without a dedicated report, there are ways to see current stock. Each method has trade-offs depending on how many products you carry and what you need to do with the data.
Method 1: Products > Inventory page
This is the simplest approach and works for any Shopify plan.
- Go to Shopify Admin > Products > Inventory
- Browse the list of products with their stock counts
- Click on any product to see variant-level detail (sizes, colors, etc.)
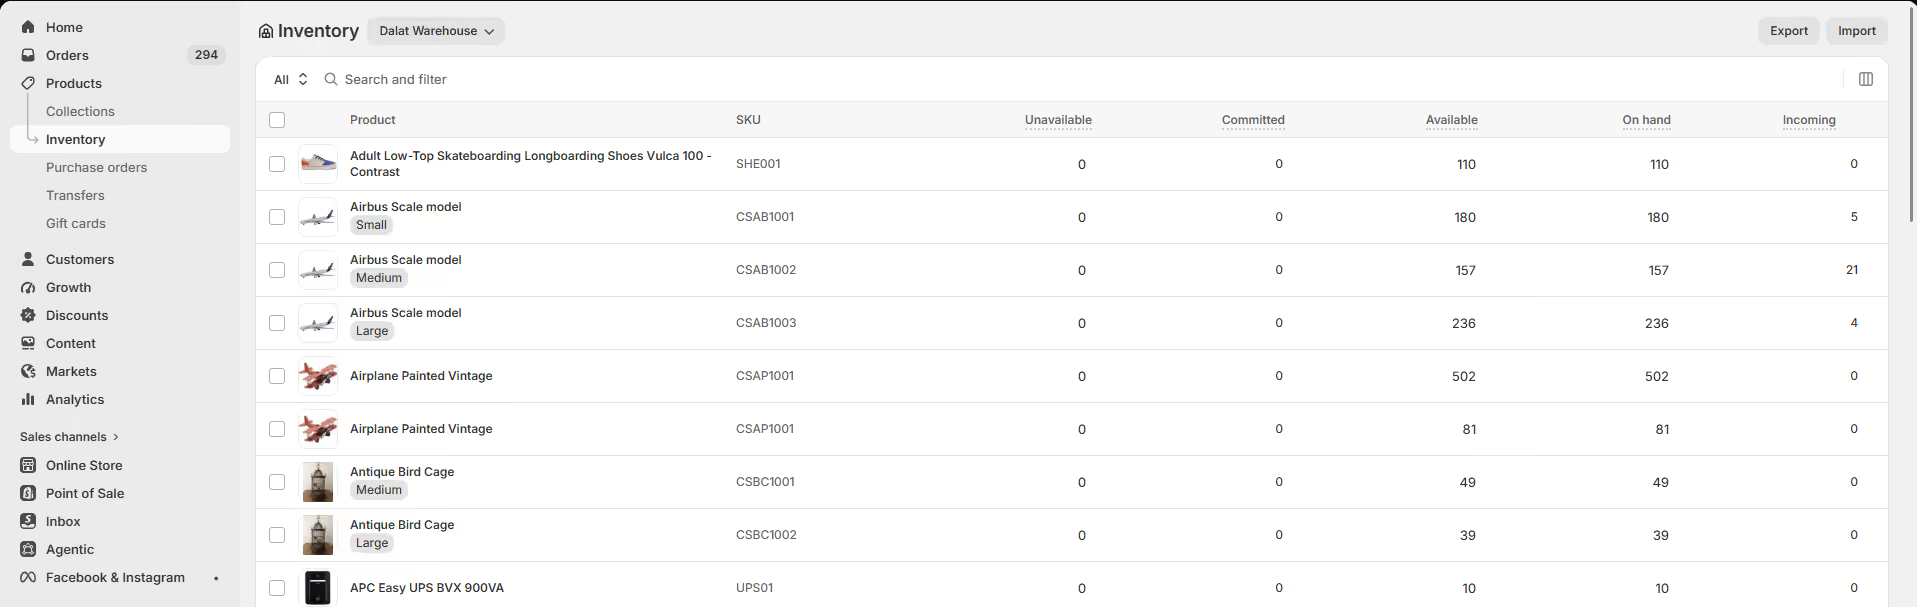
What you get: current stock quantity for each product and variant, shown per location if you have multiple.
What you don't get: there's no way to export this view. You can't add fields like inventory cost, vendor, collections, or sale value. You can't filter by collection or product type. And you can't schedule it to send to anyone. For a store with 50 products, this works. For a store with 500 or 5,000, it doesn't scale.
Method 2: Export a products CSV
You can export your full product list from Products > Export, which includes inventory quantities.
- Go to Products and click Export
- Choose "All products" or filter first
- Select CSV format
The exported file includes variant-level inventory counts at the time of export. It's more complete than browsing, but it's still a manual process. You get a flat file with product data and stock numbers, but no calculated fields, no cost data (unless you've set it per variant), and no location-level breakdown in a clean format.
This is useful as a one-off check, but not as an ongoing inventory reporting workflow.
Method 3: Shopify API or ShopifyQL
For technically inclined merchants or developers, Shopify's InventoryLevel API endpoint provides real-time stock counts per variant per location. ShopifyQL notebooks in the Shopify admin can also query some inventory data, though they're limited in what they can pull.
In practice, we've seen that most merchants don't use this route because it requires either custom development or familiarity with Shopify's query language. It's powerful but not practical for day-to-day stock checks.
One thing worth knowing about how Shopify handles inventory history. Inside the Shopify admin, you do have access to historical inventory data going back up to 3 years through Analytics reports like the month-end inventory snapshot. You can export those to CSV directly from Analytics > Reports. Shopify also provides inventory adjustment history through ShopifyQL, which logs every movement (adjustments, fulfillments, transfers) with timestamps.
But there are two practical limitations. First, when a reporting app connects to your store through Shopify's API, it only receives the current inventory level at that moment. The API doesn't hand over historical snapshots, so any external report you build outside of Shopify starts with today's number only. Second, even inside Shopify, the historical tools show month-end figures and adjustment logs, not a clean "here's exactly how many units you had on a specific Tuesday." Reconstructing a point-in-time stock level from a trail of individual adjustments takes work.
For merchants who want to compare current stock against a past date in an external report, without stitching together adjustment logs or relying on month-end figures alone, a reporting app that captures regular snapshots fills that gap. In Report Pundit, once snapshot sync is enabled, the app saves inventory levels at regular intervals so you can pull up a clean side-by-side view: what you have now versus what you had on any date the app has been tracking.
What fields should a current inventory report include?
A useful current inventory report goes beyond just "product name" and "quantity." Here are the core fields and what each one tells you:
In our experience, stores that track at least inventory quantity, cost, location, and vendor in a single report make significantly better restocking decisions. The ones that only look at quantity tend to over-order slow movers and under-order items with long lead times.
What is the difference between current inventory and inventory on hand?
These two terms sound interchangeable, but they refer to different numbers in Shopify, and confusing them leads to bad restocking decisions. Inventory on hand is the total physical stock at a location, regardless of what's already promised to customers. Current inventory (often called "available" inventory) is the portion of that stock you can actually sell right now.
The difference comes down to commitments. When a customer places an order that hasn't shipped yet, those units are still physically in your warehouse, so they count as on hand. But they're already spoken for. Selling them again means overselling.
How Shopify breaks down inventory quantities
Shopify tracks four separate inventory states for every variant at every location. You can see three of them side by side in your admin under Products > Inventory:
Say you sell a jacket in three colors from two locations. Your main warehouse shows 120 units on hand for the black variant. But 45 of those are committed to orders waiting to ship, and 5 are marked unavailable due to a quality hold. That leaves 70 units available. If your purchasing team sees "120 on hand" and assumes stock is healthy, they won't reorder. Meanwhile, you actually have 70 units to sell, and at your current sales pace, that might last less than a week.
In Shopify's reporting, the distinction matters in a specific way. The ShopifyQL field ending inventory units typically reflects the on-hand count at the end of a period, while committed stock is tracked separately at the location level. So if you're reading a Shopify Analytics report and comparing it to what you see on the Products > Inventory page, the numbers can look different depending on which state you're looking at.
Which number should you use for which decision?
The short answer: it depends on what you're deciding.
For valuation and accounting, use on hand. When you need to know the total value of stock in a warehouse for month-end books or financial reconciliation, on hand is the right number. It captures everything physically present, regardless of commitments. Shopify's Month-End Inventory Value report uses this approach.
For replenishment and reordering, use available. If you base reorder decisions on the on-hand number, you'll think you have more sellable stock than you do. Those committed units are already sold, so they shouldn't factor into "do I need to order more?" decisions. The tricky part is that the gap between on hand and available changes constantly as orders come in and ship out. A product that looks healthy at 200 units on hand might actually have only 35 available if the rest are committed to pending orders across your online store and POS.
For customer-facing stock status, use available. If you display stock counts on your storefront or set up back-in-stock alerts, available is the number that should drive those signals. Showing on-hand counts can lead to customers ordering products that are already committed to other buyers.
In Report Pundit, you can add both fields to the same report and see them side by side. The Inventory on Hand report shows total stock per variant per location, and you can add the available quantity column right next to it. This way, your warehouse team sees the full physical count while your purchasing team sees the sellable count, all in one view.
How to get a real-time current inventory report
This is where a reporting app fills the gap. The key thing to understand: "current inventory" isn't a separate report type. It's a field, specifically the Inventory Quantity field, which always reflects the current stock level at the moment you run or schedule a report.
Current inventory as a field, not a separate report
When Report Pundit syncs with your Shopify store, the Inventory Quantity field pulls the live value from Shopify's API. Every time you open a report, refresh it, or a scheduled run fires, the quantity shown is current, not from a midnight snapshot.
When you update the inventory of a product in Shopify, the new inventory values will be reflected in Report Pundit when you sync the data. The app also runs automatic syncs every six hours, plus an on-demand sync every time you open or schedule a report.
So rather than looking for a "current inventory report" as a distinct template, you add the Inventory Quantity field to any inventory report, and the data is current. That includes the pre-built Inventory on Hand report, the Inventory by Location report, the Low Stock report, or any custom report you build.
30+ inventory fields you can add to one report
Report Pundit gives you access to over 30 inventory-related fields that you can combine in a single report. That includes everything in the table above, plus fields like:
- Inventory Level Indicator (custom High, Medium, Low labels based on thresholds you set)
- Reorder Point and Replenishment fields
- Stock Status (In Stock vs. Out of Stock)
- Product image URLs
- Product created and updated dates
- Product tags, product type, and custom metafields
This flexibility matters because different teams need different views. Your warehouse team might want SKU, location, and quantity. Your finance team wants cost and value. Your marketing team wants collections and stock status before running a promotion. One app, one data source, but different reports for different needs.
See the full Inventory on Hand report & Inventory Level Indicator report guide
Filtering and grouping by location, vendor, or collection
One of the biggest limitations of Shopify's native inventory view is that you can't easily filter or group stock data across dimensions. In Report Pundit, you can:
- Filter to a single location (or compare across locations side by side)
- Group by vendor to see all stock from one supplier
- Group by collection to see whether a featured collection has enough inventory before a promotion
- Filter by product status to exclude drafts or archived items
- Filter by stock level to show only out-of-stock or low-stock items
From what we've seen, the location filter is the one merchants use most often. If you run two warehouses and a retail shop, knowing that Product A has 200 units in Warehouse 1 and zero in the retail store is more useful than knowing you have "200 total."
For location-based inventory tracking, see our post to tracking Shopify inventory by product and location
Current inventory vs. past inventory: tracking stock changes over time
Seeing what you have right now is only half the picture. Knowing how your stock changed, what sold, what was transferred, what went up or down, is what turns a snapshot into a planning tool.
Shopify's built-in reports offer month-end snapshots, which give you ending inventory at month close. But they don't let you compare current stock against a specific past date, or see the movement between two points in time.
In Report Pundit, once snapshot sync is enabled, the app captures inventory levels at regular intervals and stores them. This means you can run a report that shows:
This comparison is useful for a few specific situations:
Identifying fast movers before they stock out. If a product dropped from 300 units to 40 in two weeks, you know the velocity. Reorder before it hits zero.
Catching shrinkage or data errors. If stock went down but there are no corresponding orders, you may have a counting problem, a theft issue, or a sync error worth investigating.
Planning seasonal restocks. Compare your inventory position now versus the same date last year (once you have enough snapshot history) to plan ahead.
Reporting to suppliers or partners. Some B2B relationships require periodic inventory status updates. A side-by-side current vs. previous report gives them what they need.
For more on inventory snapshots and historical tracking, see Shopify Inventory Snapshot Reports
How to automate Shopify inventory reports
Checking inventory manually is fine occasionally. But if you need stock data regularly (daily, weekly, or even hourly), automation saves real time and keeps your team working from the same numbers.
Schedule reports by email, Slack, or Google Sheets
In Report Pundit, you set a schedule on any saved report. Options include:
- Frequency: hourly, daily, weekly, or monthly
- Delivery: email (to yourself, your team, your accountant, or your supplier), Slack channel, Google Sheets (overwrites or appends), Google Drive, FTP/SFTP, Power BI, or BigQuery
- Format: Excel, CSV, or PDF
One thing we've found helpful: a daily morning report sent to email with the Inventory on Hand data filtered to show only items below a threshold. That way your purchasing team sees only what needs attention, not the full catalog.
For stores that sell fast-moving products (food, fashion, seasonal goods), hourly scheduling can prevent overselling. Most stores don't need hourly, but the option exists for peak periods like holiday sales or flash promotions.
Beyond scheduled reports, you can set inventory level indicators that flag products as High, Medium, or Low based on thresholds you define. This works like a traffic light for your stock.
You pick the quantity thresholds for each level. When a product crosses the Low threshold, it shows up in the report. Schedule that filtered report to arrive daily, and you have an automated low-stock alert without relying on Shopify Flow
Report Pundit also has a pre-built Out of Stock report that shows every variant at zero inventory, with its SKU, cost, and location. It's useful for catching items that slipped through without a reorder.
Check out our blogs for Low Stock Product report & Out of Stock Product report details
Conclusion
Shopify gives you solid inventory reports for trend analysis and month-end reviews. But when you need to know what's actually in stock right now, across locations and variants, those reports weren't designed for that job.
The gap is easy to close. Current inventory is a field you add to any report, not a separate report you need to find. Build an Inventory on Hand report in Report Pundit, add the fields your team needs, filter by location or vendor, and schedule it to land in your inbox every morning. Your warehouse team, purchasing team, and accountant all work from the same numbers, updated every time the report runs.
Frequently asked questions
Does Shopify's inventory quantity update in real time?
Shopify's inventory screens and its Analytics reports don't behave the same way. The Products > Inventory page is your operational inventory view, while reports under Analytics > Reports vary: some use month-end snapshots, others calculate values over a selected date range, and some (like sell-through rate) can have a 2 to 3 day processing delay. Because of that, the quantity shown in your inventory view may not always match what appears in an inventory report. Report Pundit pulls fresh data from the Shopify API each time it syncs, so its inventory quantity reflects stock levels at that moment.
Can I export current inventory from Shopify without an app?
You can export a Products CSV from Products > Export, which includes inventory quantities at the time of export. But it's a manual process, lacks fields like inventory cost or collection grouping, and doesn't break down by location in a report-friendly format. For an automated, filterable export, you need a reporting app or custom API work.
Should I reorder based on inventory on hand or available quantity?
Use available quantity for reorder decisions, not on hand. On-hand counts include units committed to unfulfilled orders, so they overstate how much sellable stock you actually have. If you reorder based on on hand alone, you risk ordering too late. For example, a variant showing 150 units on hand might only have 20 available after commitments across your online store and retail locations. Those 20 units are what should trigger a restock. For a deeper breakdown of how these numbers work in Shopify, see the current inventory vs. inventory on hand section above.
How often does Report Pundit sync inventory data with Shopify?
Report Pundit automatically syncs every six hours in the background. It also syncs on demand every time you open the app, open a report, or a scheduled report runs. You can trigger a manual force sync at any time from the app settings. So for practical purposes, the data is as current as your last interaction with the app.
Can I see inventory for a specific past date in Report Pundit?
Yes, once snapshot sync is enabled. Report Pundit captures and stores inventory levels at regular intervals, so you can view stock as it stood on a specific date in the past. Shopify's API only provides the current inventory, not historical levels, so without a tool that stores these snapshots, past inventory data isn't available.

5.0 ( 2000+ Reviews)
