Analyze Your Shopify Store Growth with Date Comparison

.svg)
.svg)
.svg)
Shopify’s Compare Date feature is a favorite among merchants, and it’s easy to see why. Tracking data and measuring performance are essential for growing your store, but the numbers don’t mean much without context. A rise or drop in performance only makes sense when compared to a previous period. Date comparisons help reveal real trends and seasonal patterns. Trying to do this manually for monthly or yearly comparisons can be time-consuming and often leads to mistakes.
What Is the Shopify Compare Date Feature?
- Allows you to easily compare sales, edited sales, and order data from a selected period against either the previous period or the same period last year.
- Comparison is only available for certain report types (sales, edited sales, orders) and only on single shop summary reports.
Note: You must include the Date column for this to work.
The Basic Shopify’s Native Analytics
Shopify’s built-in dashboard does provide date comparisons, but the way it groups and flips comparison periods can sometimes be confusing or limiting. For example, you won’t be able to hide any product with date comparison if you have used metafields as dates.
There have been situations where the dashboard unexpectedly switched comparisons or didn’t allow the specific metrics merchants wanted, especially with vendor-level drilldowns.
Many merchants wish Shopify offered more flexible data comparisons and customizable dashboards. And that’s exactly where tools like Report Pundit come, extending Shopify’s analytics so you can always see the real story behind your sales.
If you’d like to set up something like:
- You can set up vendor-specific sales and product comparisons and even run multi-store comparisons in the same report.
- Automated exports to Google Sheets
- Allows you to easily switch between summary and detailed views of your reports.
- You can only export comparison reports as PDF files in Report Pundit (RP), not as XLSX or CSV files.
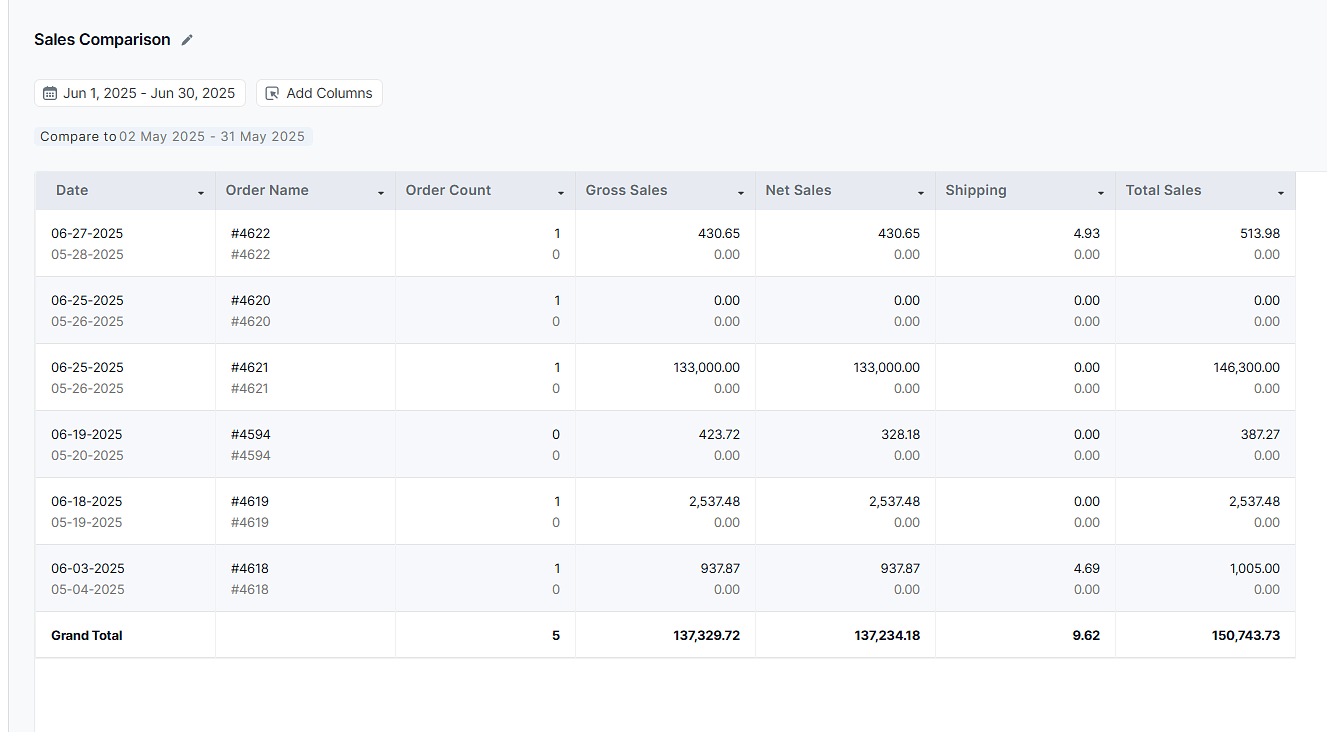
How to Use Date Compare in Report Pundit
- Open or create a report with a Date column.
- Hit the date range picker, then turn on the “Show Comparison” icon.
- Choose whether to compare to the previous period or the previous year, for example, July 2025 vs July 2024.
- Save, and the table will display both sets of numbers side-by-side for easy analysis.
Many customers often request custom dashboards to track specific vendors or brands. With Report Pundit, you can:
- See total sales for a selected brand (e.g., Estee Lauder)
- Get the Top 10 bestsellers for that brand, by month
- Compare this month to last month AND the same month last year. (based on the previous period or previous year.)
- Easily replicate the report for any vendor you want, just update the vendor filter.
- If you want to automate or visualize further, you can even connect Report Pundit exports with Google Sheets, BigQuery, and Power BI tools.
If you're looking to set up a custom report or just need a hand, our team is here to help at no extra cost
Common FAQs
1. What happens when Date Compare is enabled?
Some features, such as subtotal, total on top, and group by, are not available when Date Compare is on
2. Will both periods show when I export the report?
No. Only the current period’s data is included in the export, not the comparison data.
3. Why is my comparison not showing?
This can happen if you use numeric filters or if the current data is missing.
4. Can I compare custom date ranges like Monday-to-Sunday?
No. Date Compare only works with standard date-based ranges like previous period or previous year.
Note: In case you need a very specific, non-dynamic date range, just reach out to our team support.
Shopify’s Compare Date feature helps you spot trends, but it has its limits. With Report Pundit, you can dig deeper, compare vendors, track multiple stores, and customize reports exactly the way you need.Less time on manual work. More clarity on what’s actually driving your growth.

Build and automate your Shopify Reporting
Unlock the full potential of your Shopify store with Report Pundit. Gain access to over 2000 data fields, automate reports, and make data-backed decisions to grow your business.