

.svg)
.svg)
.svg)
Easily track your Shopify store's finances with Report Pundit's Finance Summary Report. Get insights into orders, sales taxes, refunds, and shipping costs—automate reports, reduce errors, and make data-driven decisions effortlessly.
Think of the Finance Summary Report as your store’s financial dashboard. It delivers a clear snapshot of how much money is coming in from your customers through orders, sales taxes, and shipping fees, and how much stays in your pocket after discounts and refunds.
How the Shopify Finance Summary Report Helps
Tracking financial metrics is crucial for understanding revenue, expenses, and profitability. The Finance Summary Report from Report Pundit provides a clear breakdown of key financial figures, making it easier to reconcile accounts and ensure accuracy.
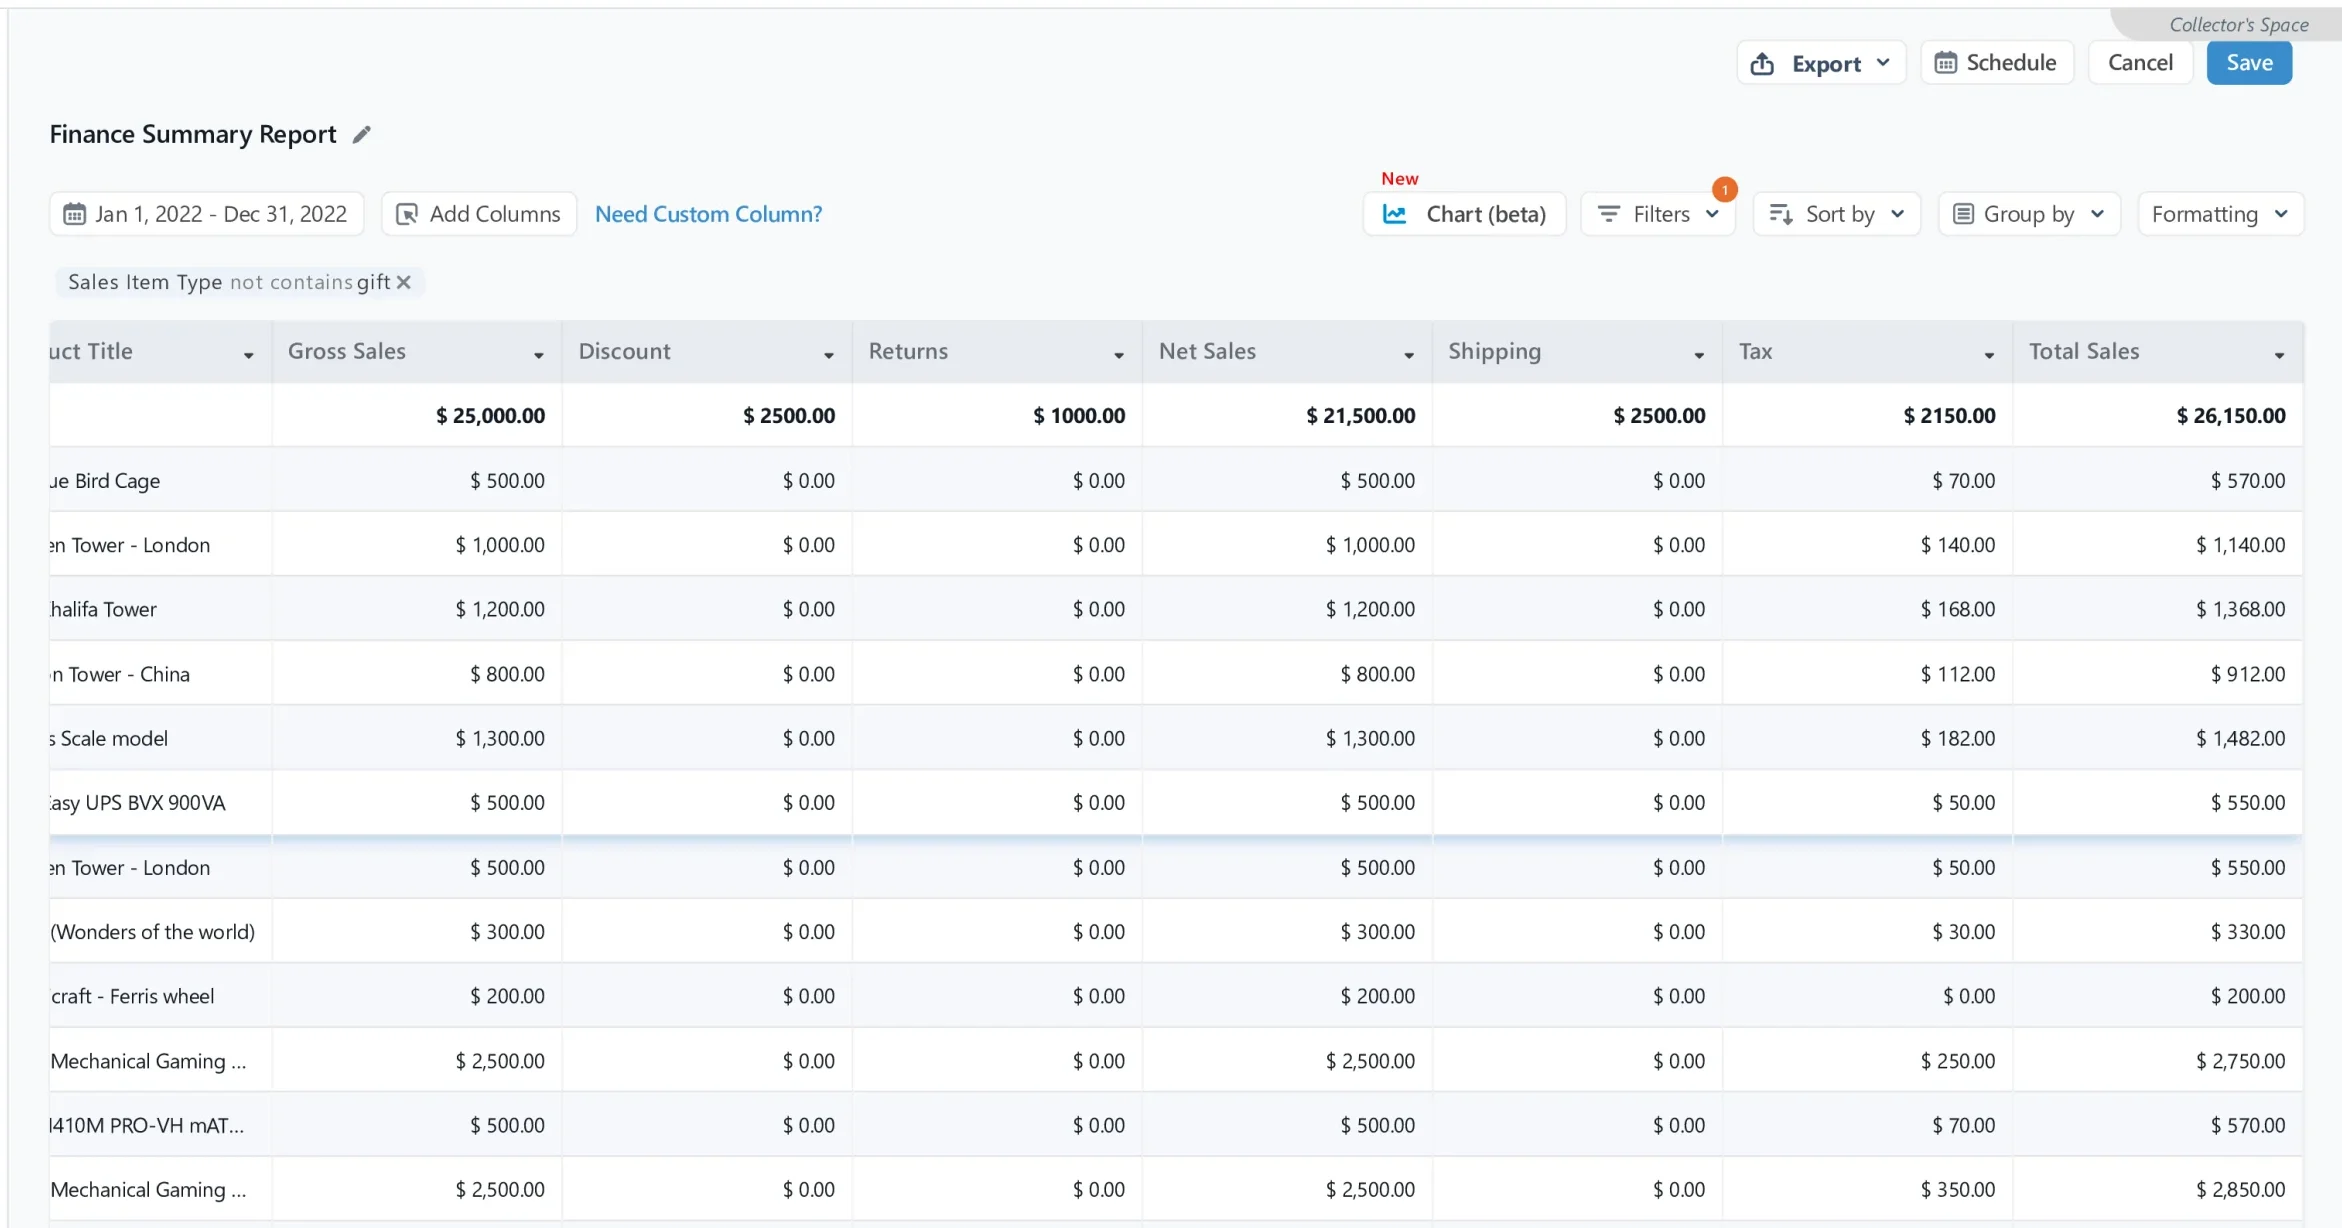
Imagine selling 1,000 units at $25 each. That’s $25,000 in gross sales. After a 10% discount and $1,000 in refunds, your net sales would be $21,500. Add $2,150 in taxes and $2,500 in shipping, and your total sales amount is $26,150. Now you have the full picture beyond just sales volume to help you make informed business decisions.
Example Breakdown:
- Price per Item: $25
- Total Units Sold: 1,000
- Gross Sales: $25 x 1,000 = $25,000
- Total Discounts (10%): $2,500
- Total Refunds: $1,000
- Net Sales: $25,000 - $2,500 - $1,000 = $21,500
- Total Shipping Costs: $2,500
- Total Taxes (10%): 10% of $21,500 = $2,150
- Duties: 0
- Additional Fee: 0
Using these figures, the total sales amount is calculated as:
Total Sales = Net Sales + Taxes + Shipping Received + duties + Additional fee + return fee
Total Sales=21,500+2,150+2,500 + 09 +0 =26,150
With this financial overview, businesses can better understand their revenue, track refunds, and account for discounts and taxes.
The Shopify Finance Summary Report provides an overview of your store’s financial health by aggregating key data related to sales, payments, liabilities, taxes, returns, shipping, and gross profit over a selected time frame.
Data Fields in the Shopify Finance Summary Report:
Order Details
- Date: The date the order was placed.
- Order ID: A unique identifier assigned to each order.
- Order No: The sequential number assigned to an order based on when it was received.
- Product Title: The name of the product in the order.
Sales Breakdown
- Gross Sales: Total revenue before deductions, calculated as:
Number of Units Sold × Product Price - Discounts: The total discount applied to the order, including individual product and overall order discounts.
- Refunds: Any refunds issued (full or partial) for the order.
- Net Sales: The actual revenue earned, calculated as:
Gross Sales - Discounts - Refunds
Why Do Shopify Stores Need a Finance Summary Report?
- Sales summary: Gross sales, discounts applied, returns processed, net sales, shipping income, and taxes collected.
- Payment summary: Details of amounts processed through various payment gateways (e.g., PayPal, Shopify Payments), making it easier to reconcile bank deposits against sales data.
- Liabilities: Outstanding gift card balances and collected tips if those features are used.
- Gross Profit: If you track the cost of goods sold (COGS), the report will calculate gross profit as net sales minus COGS.
This report is primarily used for:
- Financial tracking and planning: Understanding overall profitability, cash flow, and major cost drivers.
- Bookkeeping and accounting: Providing the necessary figures to record sales and liabilities accurately in accounting systems like QuickBooks or Xero.
- Identifying trends and problems: Evaluating growth, sales performance across channels, and pinpointing problem areas like high refunds or returns
- Simplified reconciliation: Assists in reconciling Shopify sales, payments, and liabilities with external accounting records.
Shopify has made recent changes to this report, adding more visual elements (charts and graphs) but, according to some users, removing or reducing detailed accounting sections like liabilities and gift card data, making it less useful for in-depth bookkeeping without additional apps.
You can access it via the Shopify Admin under Analytics > Reports > Summary, and customize the date range and view breakdowns by sales channel or product.
Conclusion
In summary, the Shopify Finance Summary Report is your central dashboard for tracking the most important financial data from your Shopify store, supporting business and accounting decisions

FAQs
1. Can I run the Finance Summary Report based on the order date?
Yes, you can generate the report based on order date and schedule it to run hourly, daily, weekly, monthly, quarterly, or for any custom date range. You can also automate delivery to Email, Google Drive, FTP, or BigQuery.
2. Is it possible to recreate the previous version of Shopify’s Finance Summary Report?
Yes, Report Pundit allows you to recreate the former Finance Summary layout. You can access data like partial refunds, exchanges, and detailed breakdowns of sales and net payments by payment type, location, and date.
3. Can I include payout details in the Finance Summary Report?
Absolutely. You can include payout date, amount, payment method, gateway, and additional fields tailored to your reporting requirements.
Reviewed on

1.8 K Reviews


Build and automate your Shopify Reporting
Unlock the full potential of your Shopify store with Report Pundit. Gain access to over 2000 data fields, automate reports, and make data-backed decisions to grow your business.