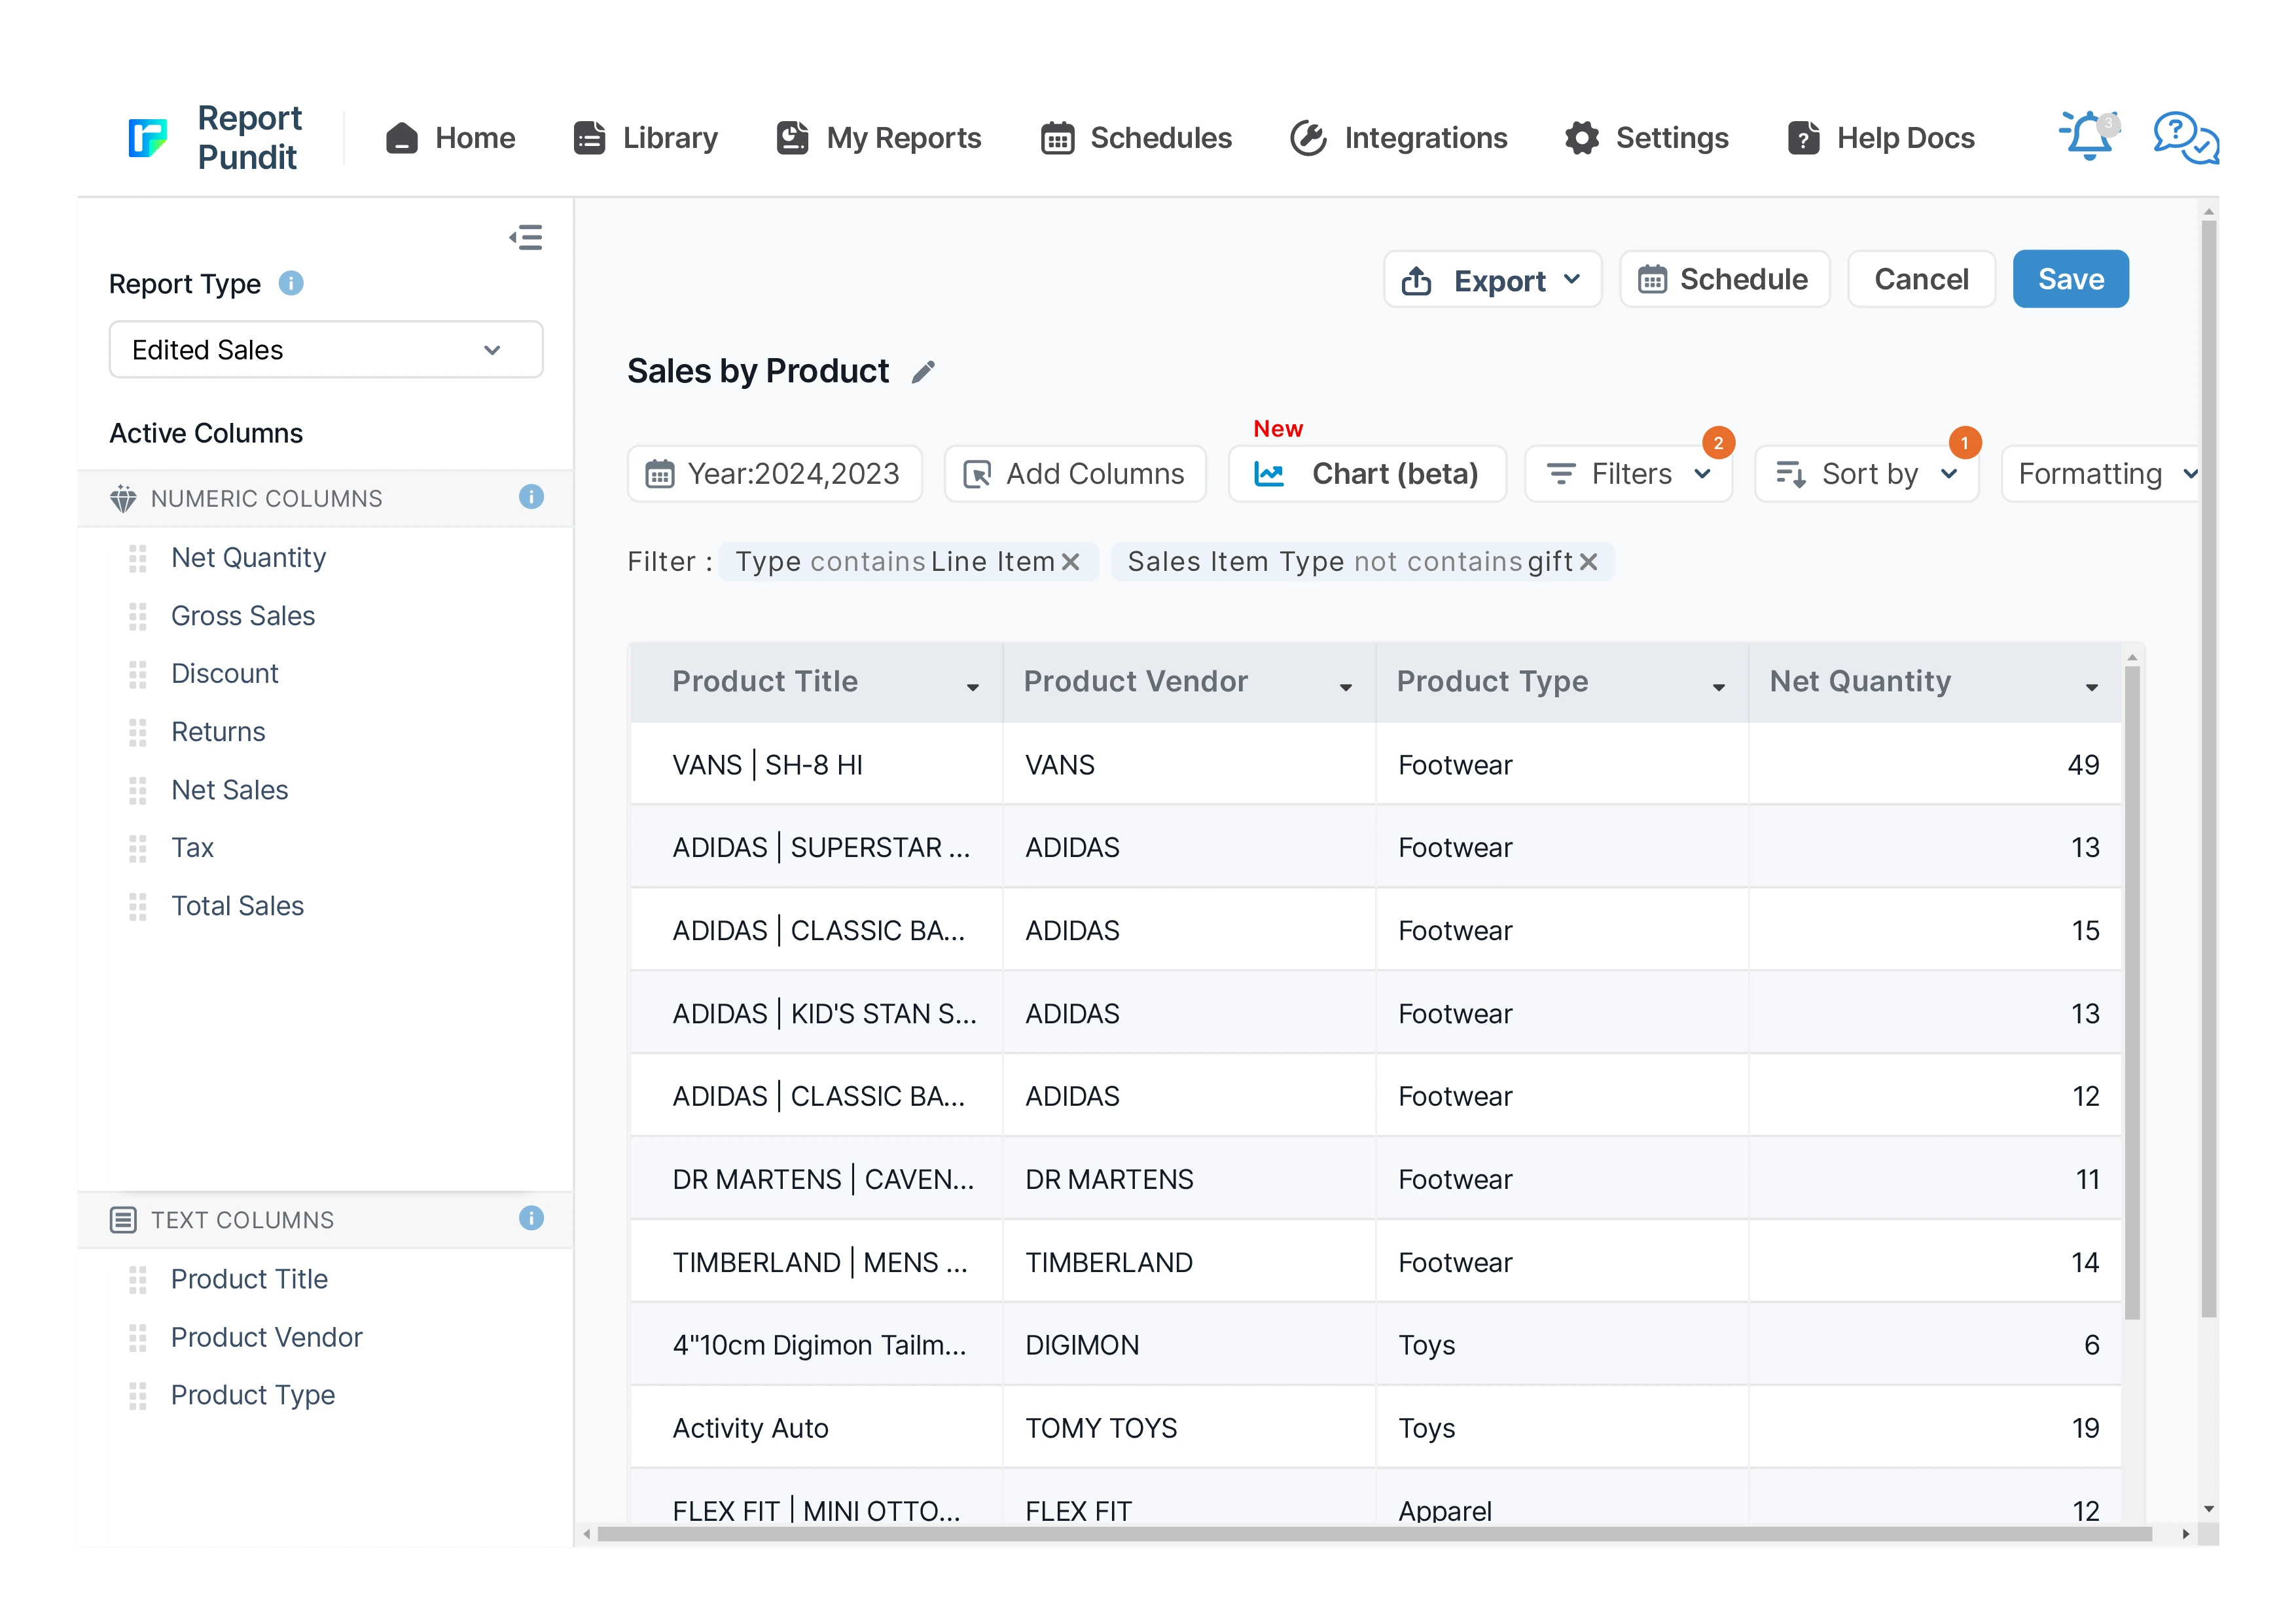
Sales by Product Report for Shopify
The Sales by Product report offers details about each product’s sales performance over a given time frame. It provides valuable insights into which of your products are and aren’t selling well. These insights will enable you to make informed decisions about inventory management and marketing and improve your business.


5 from 1,800+ merchants
2,000+ data fields
Trusted by 40,000+ Shopify stores
Updated June 2026
.png)
.png)

.svg)
.svg)
.svg)
Why this report matters
“What’s selling?” sounds simple until you ask it properly. Units sold flatters cheap products; gross sales ignores the discounts and refunds eating into them. The product that looks like your hero on a units chart can be a margin sink once you net it out.
Shopify’s product analytics show units and sales, but the detailed, exportable, discount-and-refund-aware view is gated to higher plans and can’t be scheduled. Buyers end up making purchase decisions on a partial picture.
Ranking by net sales and revenue share fixes the lens. With Pareto holding in most catalogs — roughly 20% of products driving ~80% of revenue — knowing exactly which 20% is the single most useful thing a merchandiser can have on a Monday morning.
What’s included
Identification
Product title
The product name as it appears in your catalog.
Vendor & type
The product’s vendor and product type/category, the natural grouping fields.
Example: Vendor “Northwind”, Type “Outerwear”.
Volume & revenue
Units sold
Total quantity sold across all variants of the product in the period.
Gross sales
Revenue before discounts and returns.
Formula: Gross sales = Σ (unit price × quantity)
Discounts
Discount value attributed to this product’s lines.
Heads up: Order-level discounts are allocated across products; allocation method matters when you compare like for like.
Returns
Refunded value for this product in the period.
Net sales
The true earned revenue for the product.
Formula: Net sales = Gross sales − Discounts − Returns
Example: Gross $9,000, discounts $1,100, returns $400 → net $7,500.
Mix & quality
% of total revenue
The product’s share of net sales — the column that reveals your Pareto curve.
Formula: Share % = Product net sales ÷ Total net sales × 100
Refund rate
How return-prone the product is, a quality and sizing signal.
Formula: Refund rate = Returned units ÷ Units sold × 100
Heads up: A high refund rate on a high-revenue product quietly erodes the margin the revenue figure implies.
Who uses this report
Merchandiser
Buyer
Marketing
Owner
How to read the report
- Sort by net sales, not units. Units rewards cheap, high-velocity SKUs; net sales tells you what actually pays the bills.
- Read the revenue-share column as a curve. Find where cumulative share crosses 80% — everything above it is your core, everything below is the tail.
- Cross the refund rate against revenue. A top-10 product with a double-digit refund rate isn’t the winner the gross figure suggests.
- Watch movers between periods. Rank change matters more than rank — a product climbing fast is a trend; a steady #1 is just a fact.
How to build the report in Report Pundit
- Open Report Pundit in your Shopify admin and choose Create Report (or the pre-built “Sales by Product” template).
- Set the data source to Sales / Order line items.
- Group the report by Product.
- Add columns: Units sold, Gross sales, Discounts, Returns, Net sales.
- Add a calculated % of total revenue column (product net sales ÷ total net sales).
- Add a calculated refund rate column (returned units ÷ units sold).
- Set your date range and sort by Net sales descending.
- Optional: add a prior-period comparison to surface rank movement.
- Run, sanity-check the top product, Save, and schedule a weekly send to merchandising.
Sample report
Customization & filters
- Group by product type, vendor, or collection instead of product.
- Filter to a single channel, location, or customer tag.
- Add a gross-margin column if product cost is set in Shopify.
- Compare two periods side by side to surface rank movement.
- Drill from any product into its variants with the Sales by Variant report.
Automate & export
- Schedules — hourly, daily, weekly, monthly, or custom cron
- Delivery formats — Excel, CSV, PDF, or push to Google Sheets in real time
- Group by month or week — trends instead of a static snapshot
- Destinations — email (multiple recipients), Google Sheets, Google Drive, FTP/SFTP, Looker Studio, BigQuery
- Conditional alerts — get notified only if a channel's net sales drop more than X% week-over-week
Report Pundit vs Shopify's native Sales by Channel report
Frequently Asked Questions
Units rewards cheap, fast-moving products and hides discounting and returns. Net sales — gross minus discounts and returns — shows which products actually contribute revenue.
Yes. A calculated share column (product net sales ÷ total net sales) reveals your Pareto curve, so you can see which ~20% of products drive most of the revenue.
Yes, order-level discounts are allocated to the products on the order. Because allocation method affects per-product figures, keep it consistent when comparing periods.
Benefits

Production Volumes
Customer Preferences
Profitability Assessment
Related Reports
Refund
Report Pundit’s Refund Report records the details of money returned by a Shopify merchant to unsatisfied customers when they return the product/service. These reports help the merchant keep track of the refunds issued, monitor customer satisfaction and have a proper record of financial transactions for filing taxes.
Last 30 days Sales Summary
A report that provides a comprehensive overview of sales performance over the past 30 days, including total revenue, order count, average order value, and product-specific sales trends for detailed analysis.
Sales by Checkout Currency
This report displays the breakdown of your sales by customer currency used at the checkout with the total sales value also being displayed in your local currency.
Finance Summary
The Finance Summary Report provides an overview of your store’s financial performance by aggregating key revenue, expense, and tax data. This report helps store owners understand their overall profitability, cash flow, and key cost drivers, making it essential for budgeting and financial planning
Sales by Billing Location
The Sales by Billing Location report in Shopify provides a detailed breakdown of sales based on the billing addresses of your customers. This report categorizes sales data of your customer base by country, region, or city.
Sales by Customer
The Sales by Customer Report provides Shopify merchants with valuable insights into customer purchasing behavior. This report breaks down sales by individual customers, highlighting the most valuable and active customers.
Sales by Channel
The Sales by Channel report displays sales data based on the source of each sale. It's a valuable report offering insights into multichannel Shopify selling.
Sales by Variant
Gain detailed insights into each product variant's performance with the Sales by Variant Report. Beyond basic sales data, it shows how each variant impacts your store's success. Use it to fine-tune inventory management and identify popular options, helping you make strategic decisions to boost your bottom line.
Sales by Staff
A report designed for quick analysis of sales attributed to each staff member across all POS locations, with details from gross sales to net sales calculations.
Sales by Discount Code
Sales by Discount Code report in Report Pundit provides a detailed analysis of sales generated through specific discount codes over a defined period.
Order vs Return (Monthly)
A report interpreting monthly returns by comparing the total sales value with the sales value of returned orders, including percentage calculations for both return orders and return value.
Sales by Collections
The Sales by Collections report provides a detailed view of your product sales, inventory costs, and profitability by collection, helping you see which collections drive revenue and how they resonate with your audience, allowing you to tailor your product strategies accordingly.
Detailed Sales
The full-detail sales export — every line with channel, payment, tax, cost, and margin — built for deep analysis and your data warehouse.
Order Tags and Line Item Properties
A detailed report built to include order tags and line items added to each placed order, along with essential sales and product details for thorough analysis and processing.
Commission
The Commission Report is the key to rewarding store staff and affiliates for sales they generate. It provides an overview of their sales performance along with calculated commissions share.
Last 24 Hours Orders
Use the Last 24 Hours Orders report to stay updated on all orders placed within the past day. It provides critical insights into sales trends, customer transactions, and order statuses, allowing you to monitor your store's recent activity and make informed business decisions.
Sales by Fulfillment Location
Data reported to analyze sales based on order fulfillment locations for any specified date range, including product quantity sold and corresponding sales value.
Sales by Device ID
The report displays sales data segmented by device type, such as mobile, desktop, or tablet, allowing merchants to analyze performance based on customer device usage.
Weekly Sales Pattern
Your true day-of-week rhythm — which days and hours actually sell — so you staff, schedule ads, and send emails when buyers are buying.
Completed Draft Order
This report provides insights into finalized draft orders, displaying detailed information on converted orders, including product details, pricing, and customer data for analysis.
Sales by Vendor
The Sales by Vendor report analyzes how each vendor's products contribute to your store's success. By examining sales, purchase costs, and profitability, this report provides insights to make strategic decisions, maximize profits, and optimize inventory management based on vendor performance.

Build and automate your Shopify Reporting
Unlock the full potential of your Shopify store with Report Pundit. Gain access to over 2000 data fields, automate reports, and make data-backed decisions to grow your business.