The Complete Guide to Shopify Reports (2026 Edition)

.avif)
Shopify reports are built-in analytics tools that turn your store's raw order, customer, and inventory data into graphs and tables you can act on. Every Shopify plan includes access to the core report categories (Sales, Finance, Customers, Inventory, Marketing, Behavior, Acquisition, Orders, and Fraud), you don't need Advanced Shopify or Plus to see them.
This guide walks through every report category, what each one is for, which plan gives you access to what, and when a reporting app makes more sense than Shopify's native reports.
Key Takeaways
- Every Shopify plan, including Starter and Basic, includes the core report categories. Advanced Shopify and Plus add the ability to save filtered and custom reports permanently.
- Digital ad spend is projected to reach roughly $835.82 billion in 2026 making it more important than ever to know which marketing channels are actually converting.
- Shopify's Spring '26 Edition added Insights, Annotations, and metric targets directly to the Analytics dashboard, helping merchants understand why numbers change.
- Custom reports (saved data explorations) require Advanced Shopify or Shopify Plus. Standard Shopify plans allow filtering and editing, but changes cannot be saved permanently.
- Reporting apps like Report Pundit fill the gaps in Shopify's native reports by combining multiple data sources, automating delivery, and adding fields Shopify does not track.
Which Shopify Plan Gives You Which Reports?
Shopify doesn't lock report categories behind specific plans the way it used to. According to Shopify's own documentation, the Analytics dashboard and the main report categories are available on every plan. What changes by plan is your ability to save customizations and a small number of individual reports within those categories.
Which Shopify plans include marketing and attribution reports?
Marketing and attribution reports, including sessions and sales attributed tomarketing, marketing channel performance, and first-interaction versuslast-interaction attribution, are available on every Shopify plan, from Starter and Basic to Advanced and Plus. No plan upgrade is required to view them.
A few things worth knowing that competitors' comparison tables tend to gloss over:
- On the standard Shopify plan, you can add filters and edit columns on any report, but those changes are temporary. Refresh the page and you're back to the default view. You'd need Advanced Shopify or Plus to click Save as and keep it.
- Finance reports can't be filtered or edited at all, on any plan, this is a Shopify limitation, not a plan restriction.
- Retail sales reports require Shopify POS with at least the Standard plan, since they pull from in-person, point-of-sale transactions.
- A handful of individual reports inside a category, like Loyal Customers, are gated to Advanced/Plus even though the rest of that category (Customer Reports) is open to everyone.
What's New in Shopify Reports for 2026?
Shopify shipped several analytics updates in its Spring '26 Edition (June 2026) worth knowing about if you haven't checked your dashboard in a while:
- Insights: your Analytics dashboard now surfaces trending signals automatically, a multi-week sales streak, an unusual pacing shift, without you having to dig for them.
- Annotations: charts now show color-coded markers for store events (a product launch, a theme deploy, an app install) right at the date they happened, so a spike or dip has an explanation attached to it.
- Metafield and metaobject filtering: if you've tagged products, customers, or orders with custom attributes, you can now filter and group reports by those attributes directly.
- Metric targets: set a goal for any metric and track a progress gauge against it, including days remaining in the period.
- Analytics data in Shopify Flow: a new Flow action lets you pull ShopifyQL query results into automations, so you can trigger a Slack alert or email when a metric crosses a threshold.
A few smaller but useful changes from the broader 2026 changelog: reports can now be filtered by physical storefront, bubble, sunburst, scatter, and radar charts joined the existing visualization options, cumulative (running-total) views were added for time-series metrics, and the Returns metric was renamed to Reversals to better reflect order adjustments beyond physical product returns. Sidekick can also now build a report from a plain-English question instead of requiring you to write ShopifyQL.
How Do You Access and Navigate Shopify Reports?
You'll find every report under Analytics > Reports in your Shopify admin. Reports are grouped by category (Acquisition, Behavior, Customers, Finance, Fraud, Inventory, Marketing, Orders, Profit, Retail sales, Sales), and you can filter the list by category using the dropdown at the top.
Default Reports vs. Custom Reports
Reports created by Shopify itself show up with "Shopify" in the Created by column, these are the default, pre-built reports. Any report you've filtered and saved, or built from scratch using a new data exploration, shows up under Users instead. Creating a new data exploration is available on every plan, but saving it as a permanent custom report requires Advanced Shopify or Plus.
What Are the Shopify Finance Reports? (Sales, Taxes, Payouts, Profit)
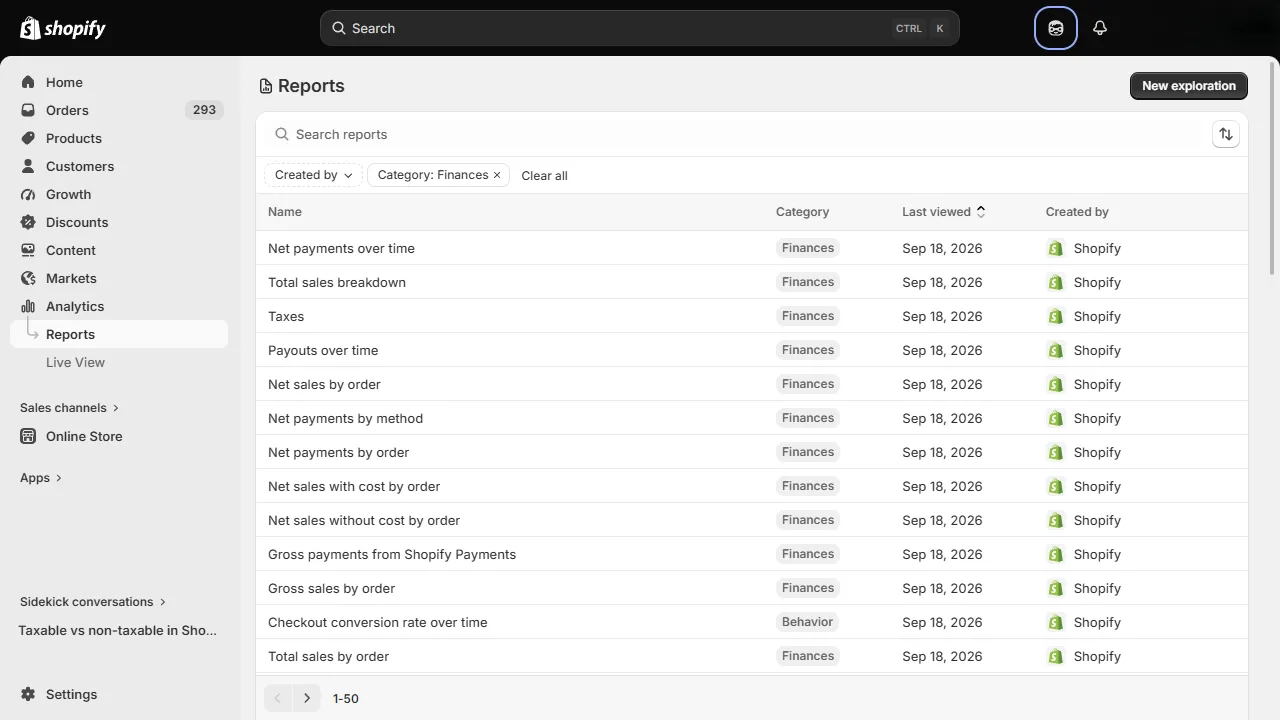
Purpose: Finance reports answer the most basic business question there is, is your store making money, and where is it going. They cover sales, discounts, returns, shipping, taxes, and payouts in one place.
Key metrics: Gross sales, net sales, total sales, taxes, shipping, gift card sales, tips, and gross profit.
Example: If your gross margin drops from 45% to 35% over a quarter, the Finance Summary breaks down whether the cause is rising discounts, higher shipping costs, or a shift in payment gateway fees, rather than leaving you to guess.
Finance Summary Report Breakdown
The Finance Summary report is the core finance report and covers Sales, Payments, Liabilities, and Gross Profit sections, all filterable by date range and sales channel. Sales breaks down into Gross Sales, Discounts, Returns, Net Sales, Shipping, Taxes, and Total Sales. Gross Profit breaks down into Net Sales With/Without Cost Recorded, Cost of Goods Sold (COGS), and Gross Profit itself, calculated as Net Sales minus COGS.
For a deeper walkthrough, see our Shopify Finance Summary Report guide.
What Do Shopify Acquisition Reports Show You?
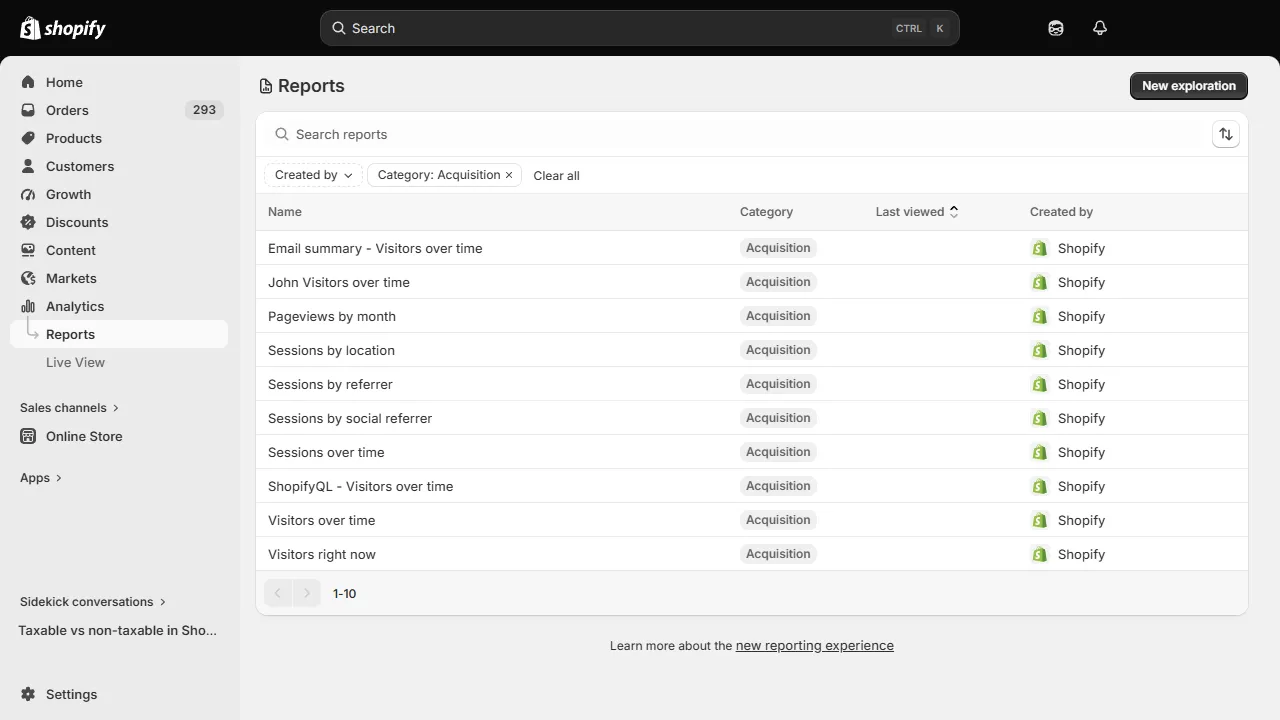
Purpose: Acquisition reports tell you where your visitors and customers are coming from, so you know which channels to invest more in and which to cut.
Key metrics: Sessions over time, sessions by referrer, sessions by location, visitors over time.
Example: If 65% of new sessions come from Instagram but convert at 0.8%, while Google Ads sessions convert at 2.1%, that's a signal to refine Instagram targeting or shift budget toward search.
How Shopify Tracks Sessions vs. Visitors
Shopify uses cookies to identify a device and track how long each visit lasts. A session typically expires after 30 minutes of inactivity. If the same visitor returns within that window, it counts as one session; if they come back after 30 minutes, it's a new session but still the same visitor. That's why your total session count is often higher than your unique visitor count, and it's normal, not a data error.
See Shopify's documentation for the full technical definition.
What Are Shopify Behavior Reports Used For?
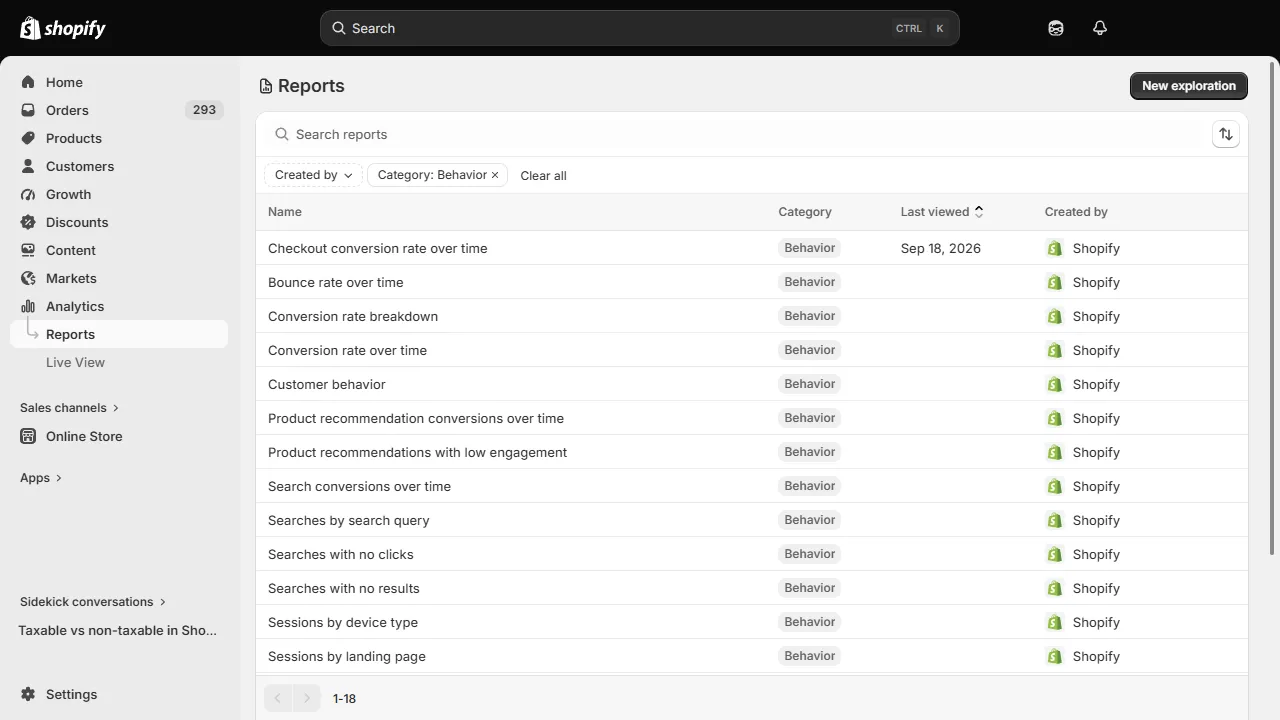
Purpose: Behavior reports show how people interact with your store once they land on it: where they click, what they search for, and where they abandon the process.
Key metrics: Bounce rate, conversion rate breakdown, sessions by device, search conversions, checkout conversion rate.
Example: If your "summer essentials" landing page has a 68% bounce rate, and your on-site search data shows customers searching for "linen shirts" that aren't featured on that page, adding those products prominently is a direct fix.
Key Behavior Reports at a Glance
Bounce rate over time, conversion rate over time, conversion rate breakdown (the full funnel from session to completed checkout), sessions by device type, sessions by landing page, and four search-specific reports: searches by query, searches with no results, searches with no clicks, and search conversions over time. Searches with no results is particularly worth checking regularly, it flags product gaps and confusing navigation before they cost you sales.
View more insights about Behavior Reports here.
What Do Shopify Fraud Reports Track?
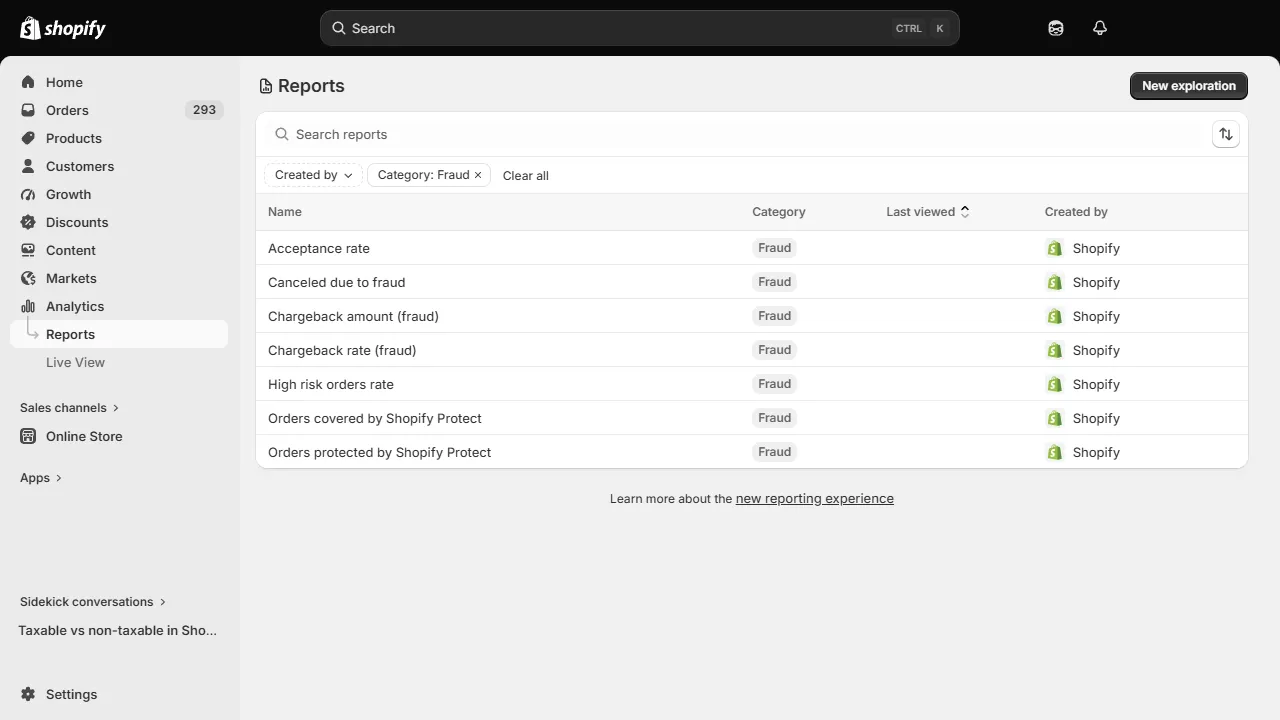
Purpose: Fraud reports flag orders that Shopify's fraud analysis considers high-risk, so you can review or cancel them before fulfillment.
Key metrics: Acceptance rate, high-risk orders rate, chargeback rate (fraud), orders canceled due to fraud, orders covered by Shopify Protect.
Example: If your store canceled five high-risk orders worth $1,200 total in a week, the report shows you avoided that revenue at risk, framing it as protected margin rather than lost sales.
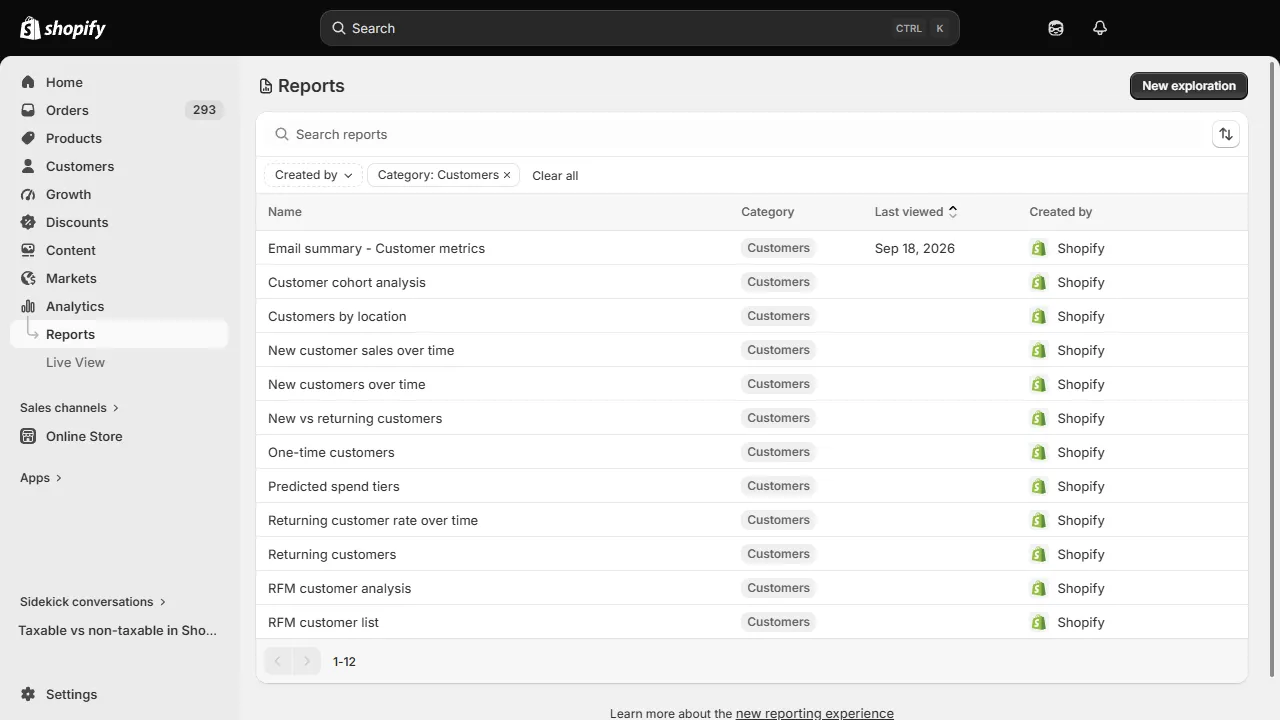
What Are Shopify Customer Reports? (Cohorts, LTV, Segments)
Purpose: Customer reports reveal who's buying, how often, and what they're worth over time, the foundation for retention and loyalty strategy.
Key metrics: New vs. returning customers, customer lifetime value tiers, average days since last order, one-time customer count.
Example: If your 90-day repurchase rate slips from 35% to 22% after a recent influencer campaign, the Customer Cohort Analysis report shows exactly which acquisition cohort isn't returning, so you know which post-purchase email flow to trigger.
RFM Customer Analysis Explained
RFM stands for Recency (days since last purchase), Frequency (total orders), and Monetary (total spent). Shopify scores each customer 1 to 5 on each dimension based on your store's own data, then groups them into 11 RFM categories you can use to plan targeted campaigns. Individual scores aren't shown, only the group classification, and discrepancies between total and grouped customer counts can occur due to data sync delays.
See our guide on using Shopify customer reports to understand your customers.
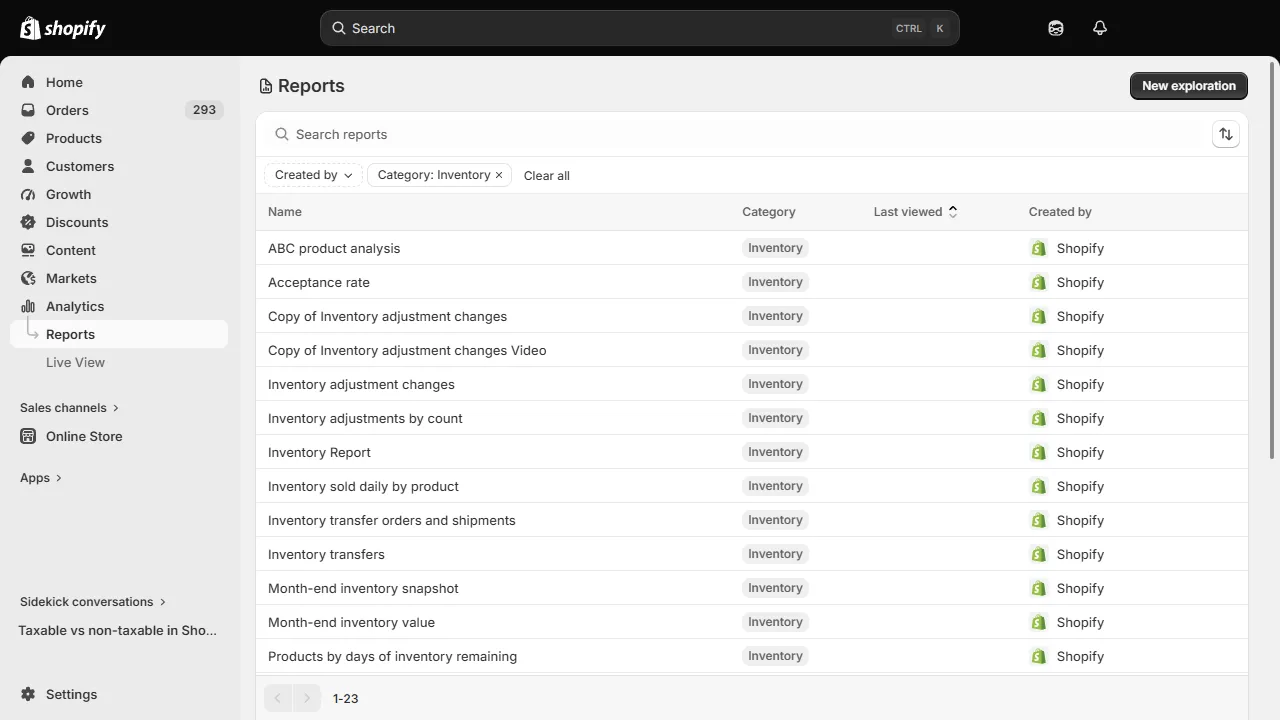
What Are Shopify Inventory Reports? (Stock, Sell-Through, Replenishment)
Purpose: Inventory reports track what's moving, what's stuck, and what's about to run out, so you can plan restocking before you lose sales to a stockout.
Key metrics: Days of inventory remaining, sell-through rate, ABC analysis grade, month-end inventory snapshot.
Example: If your best-selling product stocks out three times in two months, the Days of Inventory Remaining report shows a mismatch between your reorder threshold and actual lead times, telling you to raise safety stock or negotiate faster replenishment.
ABC Analysis grades products A, B, or C based on their share of revenue over a 28-day window, roughly the Pareto principle applied to your catalog: A-grade items typically drive about 80% of revenue, B-grade about 15%, and C-grade the remaining 5%. It takes 12 to 72 hours for inventory changes to reflect in these reports.
See Our guide on Tracking Real-Time Stock with Inventory Reports to improve your Inventory Management.
What Do Shopify Marketing Reports Measure? (Campaigns, ROAS, Attribution)
Purpose: Marketing reports connect your campaigns to actual dollars, telling you which channels and campaigns are earning their spend.
Key metrics: Sessions attributed to marketing, sales attributed to marketing, conversion by first/last interaction.
Example: If a Google Shopping campaign shows strong traffic but a 1.3x ROAS while your Klaviyo email flows produce 10x, that's a clear signal to shift budget rather than keep scaling the underperforming channel.
First-Interaction vs. Last-Interaction Attribution
First interaction credits the very first touchpoint that brought a customer to your site, useful for understanding what generates initial awareness. Last interaction credits whatever touchpoint happened immediately before the purchase, useful for understanding what closes the sale. A customer might discover you through a Google search (first interaction) but come back and buy after an email reminder (last interaction), the Attribution Model Comparison report shows both side by side so you're not over-crediting one channel.
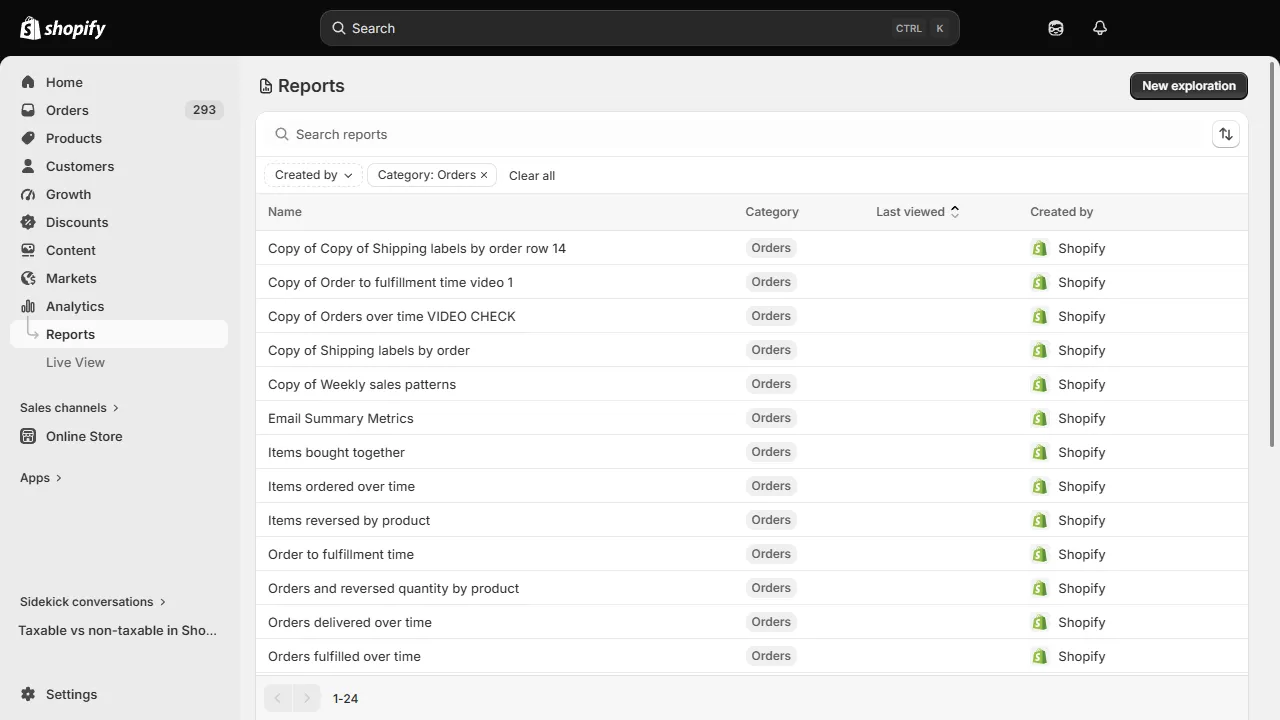
What Are Shopify Order Reports? (Fulfillment, Returns, Delivery)
Purpose: Order reports track the full lifecycle of an order from placement to delivery, including where returns and delays happen.
Key metrics: Orders over time, fulfillment/shipping/delivery times, return rate over time, items bought together.
Example: If Fulfillment, Shipping, and Delivery Times shows average delivery jumping from 3 to 6 days after switching carriers, that's a direct, dated cause you can raise with the new carrier rather than a vague customer complaint pattern.
What Do Shopify Profit Margin Reports Show?
Purpose: Profit reports reveal true profitability per product, variant, or POS location, once you've entered product costs.
Key metrics: Gross profit, gross margin percentage, net quantity sold, cost of goods sold.
Example: If your new product line generates strong revenue but only a 25% margin against your core line's 45%, Gross Profit by Product tells you to fix sourcing costs or prioritize marketing spend on the higher-margin line instead.
Profit reports only populate once you've entered a cost per item for your products in the Shopify admin. Without that data, the reports have nothing to calculate from.
What Are Shopify Retail Sales (POS) Reports?
Purpose: Retail sales reports isolate in-person, point-of-sale performance from your online sales, essential if you sell both online and in a physical location.
Key metrics: Total sales by POS location, sales by staff member, sales by product at POS.
Example: If your Mall location generates $5,000 in monthly profit and your Outlet location generates $3,000, POS-location-level profit reporting tells you where to focus staffing and inventory investment.
Retail sales reports require the Shopify POS channel and at least the Standard Shopify plan.
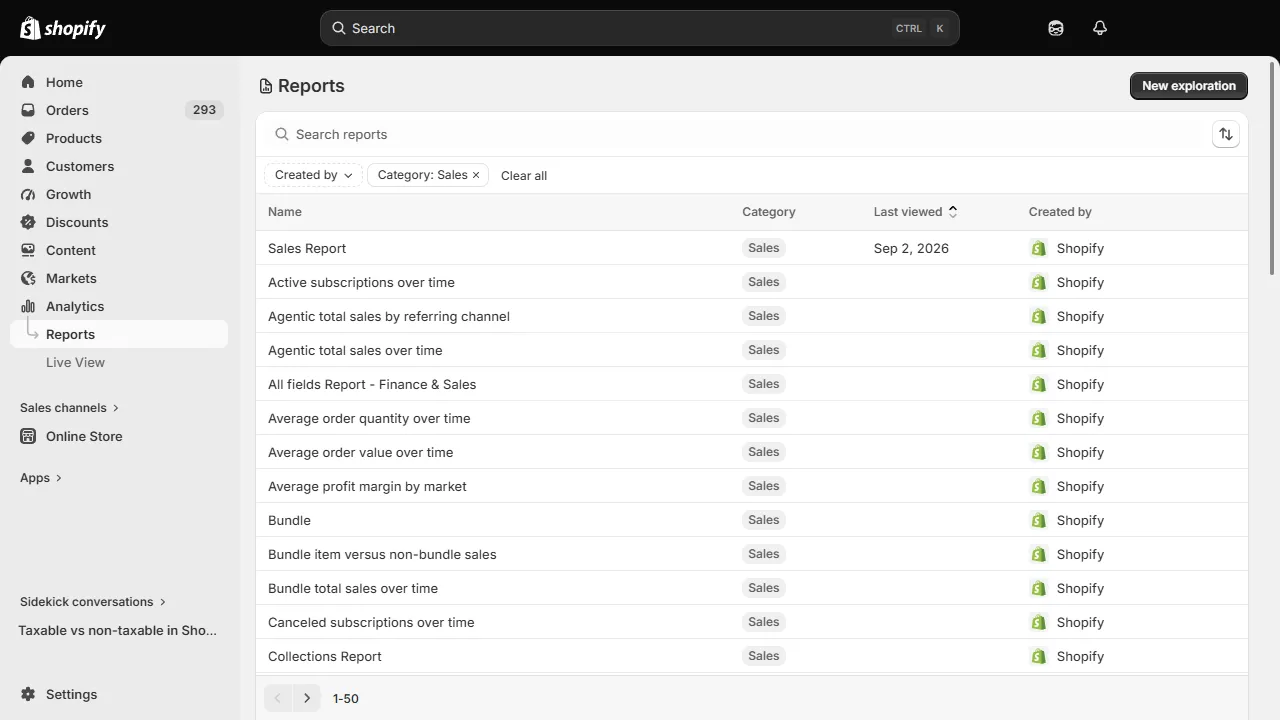
What Are Shopify Sales Reports? (Channels, Products, Bundles, Subscriptions)
Purpose: Sales reports are the broadest revenue view Shopify offers, covering products, channels, discounts, bundles, and subscriptions in one category.
Key metrics: Total sales over time, sales by product, sales by channel, average order value, bundle vs. non-bundle sales.
Example: A 20% AOV decline during a holiday sale while POS AOV holds steady usually means your online promotions are attracting bargain hunters rather than higher-value buyers, worth testing a minimum purchase threshold on future discounts.
Sales reporting has its own metrics and pitfalls, covered in depth in Shopify sales reports explained.
Key Terms and Formulas Glossary
How Do You Create a Custom Shopify Report?
Step-by-Step Process
- Go to Analytics > Reports in your Shopify admin.
- Click New exploration, or open an existing default report to modify it.
- Add at least one metric (required), then add dimensions to break it down, for example, Net Sales as the metric, grouped by Product.
- Apply filters to narrow the data, by date range, channel, location, or customer segment.
- Click Save as, name the report, and save. (Requires Advanced Shopify or Plus to keep the save permanently, otherwise the changes reset when you leave the page.)
You can also describe what you want in plain English and have Shopify's Sidekick assistant generate or refine the ShopifyQL query for you.
When Should You Use a Reporting App Instead of Shopify's Built-In Reports?
Shopify's native reports cover a lot of ground, but they hit real limits once your data needs grow past what a single store's dashboard can show. A dedicated reporting app makes sense when:
- You need a single consolidated view instead of exporting and manually merging several reports (for example, one report combining products, variants, SKUs, inventory levels, and sales performance, something Shopify doesn't offer natively)
- You want reports delivered automatically on a schedule rather than pulled manually
- You need to blend third-party app data with Shopify sales data in one place
- You need custom fields beyond what Shopify's default report columns track
Report Pundit gives you access to over 2,000 data fields, automated report delivery, and the ability to build reports Shopify's native tools simply don't offer. Start a free trial or book a demo to see it against your own store's data.
Frequently Asked Questions
Which Shopify plan includes marketing attribution reports?
Marketing reports, including sessions and sales attributed to marketing and first/last interaction attribution, are available on every Shopify plan. What requires Advanced Shopify or Plus is saving a customized version of these reports permanently.
What's the difference between Shopify Analytics and Shopify Reports?
Analytics is the umbrella section in your admin (Analytics > Reports) that houses the dashboard, Live View, and all report categories. Reports are the individual, detailed breakdowns within Analytics, Sales, Finance, Customers, and so on, that you drill into from the dashboard or the Reports list.
Are there Shopify report templates?
Shopify's own default reports function as pre-built templates, ready to use without configuration. If you want templates for specialized needs Shopify doesn't cover natively (combined product/inventory/sales views, for example), Report Pundit's prebuilt report library covers over 100 templates you can use as-is.
Is there a Shopify reports API?
Yes. Shopify's Admin API and the ShopifyQL query language let developers pull and query analytics data programmatically. Shopify Flow can also now run ShopifyQL queries on a schedule and act on the results automatically.
Which plan required for custom marketing channel performance reports (basic vs. advanced)?
Viewing marketing channel performance data is available on every plan. Saving a customized, filtered version of that report (for example, isolating one channel permanently) requires Advanced Shopify or Shopify Plus.
What changed in Shopify reports recently?
Shopify's Spring '26 Edition (June 2026) added Insights, Annotations, metafield-based filtering, metric targets, and new Flow automation actions for analytics data. See the "What's New" section above for details.
Do Shopify sales reports include POS (in-store) sales?
Yes, standard Sales reports include both online and POS sales unless you filter by channel. Retail Sales reports specifically isolate POS-only activity, and require the Standard Shopify plan or higher with the POS channel enabled.
Can I export Shopify reports?
Yes, every report can be exported as a CSV file from the Export button in the top-right corner after applying your filters.

5.0 ( 2000+ Reviews)
