Shopify Custom Reports: The Complete Guide (2026)

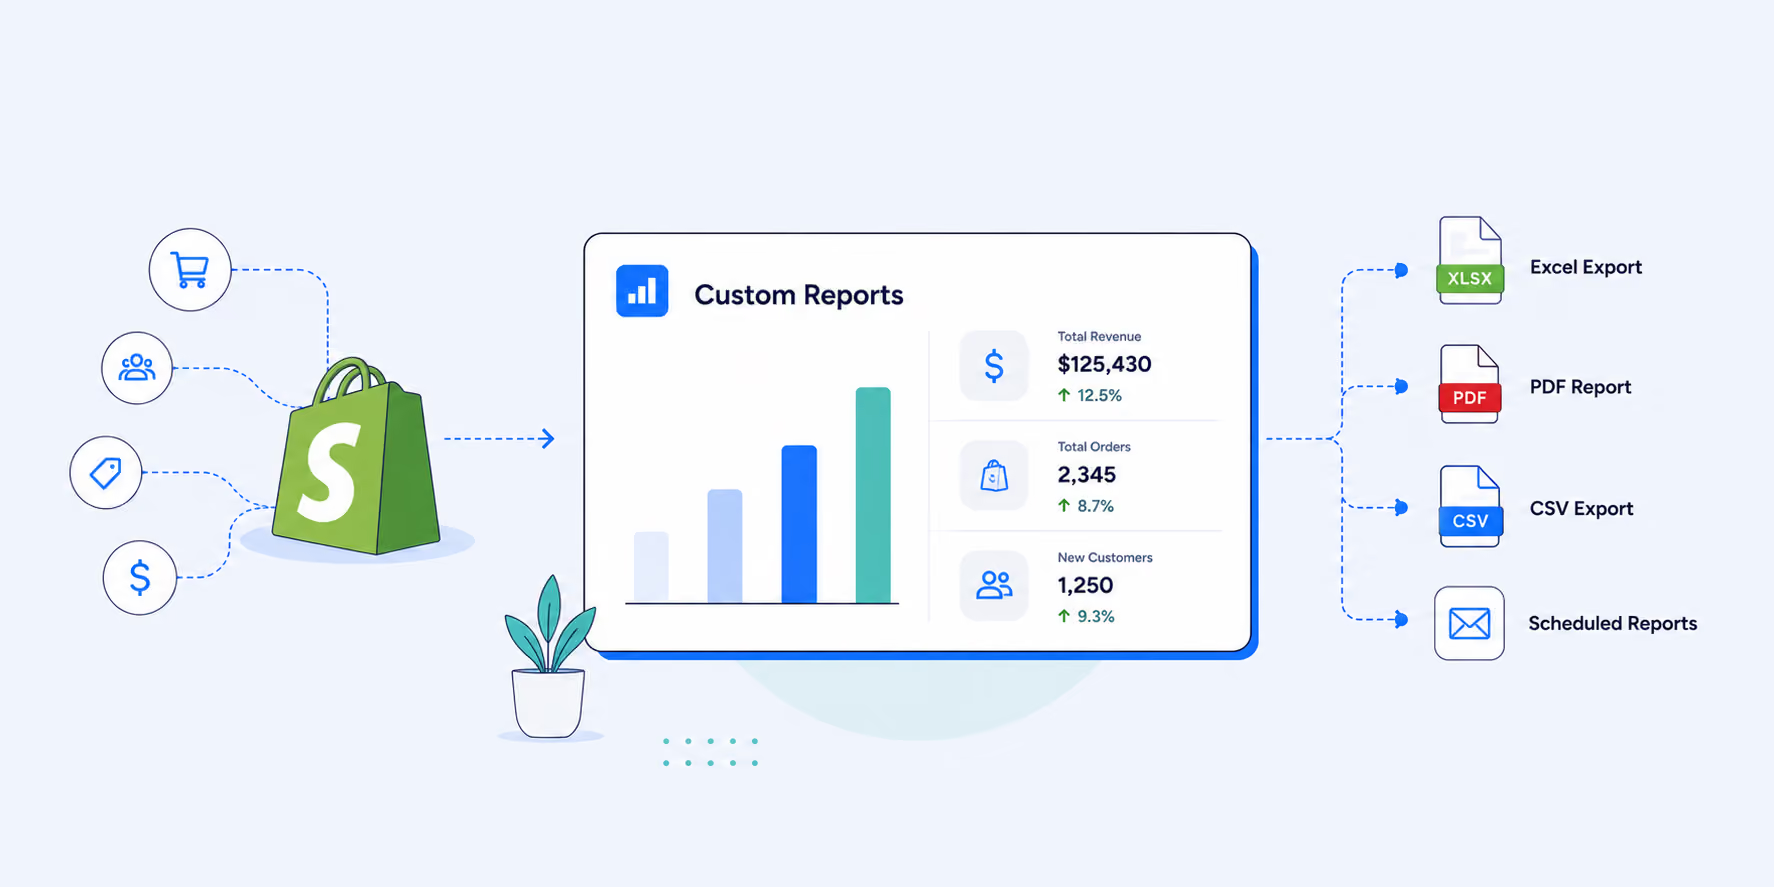
A Shopify custom report is a report you build or modify to show the exact data your store needs: the columns, filters, date ranges, and layout that match a specific business question. Every Shopify merchant reaches the point where default reports stop being enough. The sales summary does not break down revenue by discount code. The order report does not show fulfillment location alongside payment gateway fees. The inventory view does not include cost data grouped by vendor. That is when custom reports become essential.
Shopify's built-in custom reporting gives you a starting point: you can modify certain default reports or build from a blank exploration using metrics, dimensions, and filters. But for stores running multiple locations, managing vendor relationships, reconciling payouts, or reporting to stakeholders on a weekly schedule, the native tools often get you most of the way there, and the last stretch ends up finished in a spreadsheet. This guide covers how Shopify custom reports work, where the limitations appear, and how to close the gap so every team in your store gets a report that actually answers their question.
We have built custom reports for more than 10,000 Shopify stores across sales, orders, inventory, products, customers, taxes, payouts, fulfillment, and marketing. What follows is based on what we see merchants need most, where they get stuck, and what works.
Key Takeaways
Shopify's custom report builder is available on the Shopify, Advanced Shopify, and Shopify Plus plans. Merchants on the Basic plan can view the analytics dashboard and default reports but cannot create or save custom reports natively. A dedicated reporting app closes this gap, making custom reporting available on every Shopify plan, including Basic.
Shopify's native reports use a limited set of fields. Report Pundit provides access to 300+ reporting fields across orders, products, inventory, customers, taxes, payouts, fulfillment, marketing attribution, metafields, line item properties, and connected apps like PayPal, ShipStation, and Facebook/Meta Ads.
Start with the business question, not the data. Define what you need to know first, then choose the columns, filters, and date range that answer it. Reports built around business questions become reusable; reports built around curiosity rarely do.
Automation delivers the biggest time savings. Building a report once is useful. Scheduling it to arrive automatically in your inbox, Google Sheets, or Slack every week eliminates repetitive exporting and manual reporting.
What Shopify custom reports are and how they work
Shopify custom reports are modified or newly created reports that go beyond the default views in your Shopify admin. There are two paths to creating them.
The first path is modifying an existing default report. Shopify provides default reports across categories including sales, orders, customers, acquisition, inventory, behavior, marketing, and finances — see our guide on what Shopify's standard reports cover and how to customize them for a full breakdown by category. If a default report is close to what you need, you can open it, adjust the metrics and dimensions, apply filters, change the date range, and save the result as a custom report under your own name.
The second path is building from a blank exploration. From Analytics > Reports > New exploration, you start with an empty canvas and select the metrics you want to analyze. Once you add at least one metric, Shopify unlocks the visualization, dimensions, comparison, and filter panels. You choose what to measure, how to group it, and how to narrow it down.
Both paths produce a saved custom report that appears in your Reports list, attributed to the staff member who created it. Shopify displays up to 250 custom reports at a time (the 250 most recently viewed), though you can create more than that.
One important distinction: Shopify's own custom report builder is available on the Shopify plan, the Advanced Shopify plan, and Shopify Plus. Merchants on the Basic plan have access to the analytics dashboard and some default reports, but cannot create or save custom reports natively — this is one of the most common points of confusion for new store owners who try to customize a report and find the option unavailable. If your store is on the Basic plan and you need custom reporting, this is exactly the gap a reporting app closes: with Report Pundit, custom report creation is available on every Shopify plan, Basic included.
Metrics and dimensions
Two terms are worth understanding before you build your first report. Metrics are the numbers you are measuring like total sales, gross sales, net sales, order count, average order value, and similar figures. Dimensions are how you slice those numbers, and they are not limited to neat categories. Dimensions can be straightforward groupings like product, channel, or location, but they also include text-based fields such as customer name, email address, product title, or order tags. When building an exploration, you combine one or more metrics with one or more dimensions to shape the report, for example, total sales (metric) grouped by discount code (dimension).
What you can customize natively
Within a customizable report, Shopify lets you adjust several elements. You can add or remove data columns (metrics and dimensions), apply filters to narrow results by product, customer, channel, location, or other attributes, change the date range using presets or custom dates, sort and group the output, and use ShopifyQL to write queries directly if you prefer a code-based approach.
Visualization options go well beyond a basic bar or line chart. Shopify's exploration tool includes more than 25 visualization types, covering trend views, comparisons, and more specialized formats like Bar and line, Grouped vertical, Simple horizontal, Stacked horizontal, Donut, Treemap, Waterfall, Calendar heatmap, Scatter plot, Histogram (frequency), Target gauge, Display table &List by dimension.
Shopify also introduced Sidekick integration with custom reports, you can describe what you want in plain English and Sidekick generates a ShopifyQL query for you. This makes the blank-exploration path more accessible for merchants who are not comfortable writing queries manually.
What you cannot customize natively
Not every Shopify report category supports customization. Certain reports, particularly some within the finances and behavior categories, are fixed and cannot be modified. The Shopify documentation lists the specific report types that support customization, and it is worth checking before you spend time trying to adjust a report that does not allow it.
Even within customizable reports, the available fields are limited to what Shopify exposes through its analytics system. This typically covers core order data, product data, and customer data. It does not include fields like line item properties (the custom data attached to individual cart items), metafields (the custom data fields merchants add to products, orders, variants, or customers), note attributes, or data that lives in connected third-party apps — payment gateway transaction detail from providers like PayPal, shipping and fulfillment detail from apps like ShipStation, or ad-spend and attribution data from Facebook/Meta Ads and Google Ads.
Where Shopify's custom reports fall short
Every reporting tool has boundaries, and Shopify's native custom reports are no exception. The limitations become visible when reporting stops being a quick check and starts becoming a regular business process. For example, when the finance team needs a weekly reconciliation, operations needs a daily fulfillment status by location, or an agency needs to send a branded report to a client every month, those limitations become much more apparent.
Here are the specific areas where merchants hit the wall most often, based on building custom reports for more than 10,000 stores.
Limited field selection
This is the most common pain point. Shopify's native custom reports draw from a comparatively narrow set of fields — enough for the basics like order totals, product names, SKUs, and customer emails, but thinner once a report needs to combine several kinds of detail at once. The moment you need a report that includes discount codes alongside payment gateway fees alongside fulfillment location alongside vendor name, you start running into gaps. Fields that many merchants expect to find, like net payment amounts after gateway fees, detailed tax breakdowns by jurisdiction, or cost-of-goods-sold per variant, are either absent or require manual calculation outside the report.
A dedicated Shopify reporting app addresses this by pulling from a much broader set of data. Report Pundit exposes over 300 fields across orders, products, inventory, customers, taxes, payouts, fulfillment, marketing, and POS data.
No data from connected third-party apps
Most growing Shopify stores do not run on Shopify data alone. A merchant using PayPal alongside Shopify Payments needs gateway fee and settlement detail that lives in PayPal, not Shopify. A store using ShipStation for fulfillment needs shipping label cost and carrier data that Shopify's own reports do not carry. A brand running ads through Facebook/Meta or Google needs spend and attribution data to sit next to sales data in one report.
Shopify's native custom reports have no way to bring this outside data in — the report only ever reflects what is stored in Shopify itself. Report Pundit connects with 30+ payment, shipping, and marketing apps (including PayPal, ShipStation, Facebook, and Google Ads) so that data from these tools can appear as columns alongside native Shopify fields in the same report.
No metafield or line item property support
Many Shopify stores rely on metafields and line item properties to store business-critical data. A merchant selling customizable products might store engraving text, gift messages, or size specifications in line item properties. A store using metafields might track supplier lead times on products, loyalty tiers on customers, or internal notes on orders. Metaobjects, Shopify's structured custom data model, extend this further for stores with more complex data relationships; see our guide on tracking and reporting Shopify metaobjects data if your store uses them.
Shopify's native custom reports cannot pull any of this into a report. The workaround is exporting raw order data and joining the metafield or line item property values manually in a spreadsheet, a process that does not scale once the store is processing hundreds or thousands of orders per month.
Report Pundit solves this with a Custom Properties feature that lets merchants add metafields (order, product, variant, or customer metafields), line item properties, and note attributes directly as columns in any report. No export-and-merge required.
No cross-report data combination
In Shopify's native reporting, each report type operates within its own data silo. A sales report shows sales data. An inventory report shows inventory data. You cannot build a single report that combines sales velocity with current stock levels and cost-of-goods data to calculate days-of-supply and margin in one view, and Shopify's native metrics do not support the kind of custom calculated fields many merchants need for store-specific KPIs — see our guide on building custom calculation reports for unique KPIs for examples.
Merchants who need this kind of combined analysis end up exporting two or three reports and joining them in Excel. It works, but it adds real manual work every time, and it introduces the risk of merge errors.
No automated delivery
Shopify's custom reports live inside the admin. You can view them and export them as CSV, and that is essentially where the workflow ends, there is no way to schedule a report to send automatically on a recurring basis. For a solo founder checking numbers once a week, this is fine. For a team where the finance lead, the warehouse manager, the marketing lead, and the agency all need different reports on different schedules, the manual export-and-send cycle quickly becomes the bottleneck. We cover how scheduled delivery works in detail later in this guide.
No multi-store consolidation
Merchants running more than one Shopify store, whether for different brands, different regions, or different sales channels, cannot create a combined report in Shopify's native reporting. Each store's analytics are completely separate.
Report Pundit's multi-shop reporting lets merchants connect multiple stores and run a single report across all of them, one of them, or any combination. This is especially useful for agencies managing client portfolios and for multi-brand merchants who need a consolidated revenue view.
For a closer look at workarounds for each of these limitations, see Shopify Custom Reports: How They Work, Where They Fall Short, and Fixes.
How to build a custom report that answers a real business question
The difference between a useful custom report and one that gets created once and never opened again is whether it starts with a question or starts with data. The best custom reports are built backward from a decision, not forward from a data table.
Here is the process that works, whether you are building inside Shopify's native tools or using a reporting app.
Step 1: Start with the question
Write down the exact question the report needs to answer. Not "I want a sales report" but "I need to know which products sold the most units last month, broken down by discount code, so I can see whether our promotions are driving volume on the right items."
The question determines everything that follows: which columns belong in the report, which filters matter, what date range to use, and who should receive it.
Step 2: Choose the right starting point
If a ready-made report gets you close, start there. Shopify's default report library covers the most common categories. Report Pundit's Report Library includes over 150 prebuilt templates across sales, orders, inventory, products, customers, taxes, payouts, fulfillment, marketing, and POS, so there is usually one that matches most of your question. For more starting-point ideas, see effortless ways to create Shopify custom reports.
Starting from a template and customizing it is faster than building from scratch, and it reduces the chance of missing a useful field you did not think of.
Step 3: Add the columns that support the question
Open the report and review the current columns. Add the fields that your question requires and remove anything that adds noise. A good custom report shows only the data needed to answer the question, no more, no less.
For example, if your question is about product performance by discount code, you need product title, variant, SKU, quantity sold, gross sales, discount code, and discount amount. You do not need customer email, billing address, or fulfillment status in this particular report.
If a field you need is not in the standard list, such as a metafield, a line item property, or a payment gateway detail, this is where a reporting app fills the gap. In Report Pundit, you would open Add Columns to browse or search from over 300 available fields, or use Custom Properties to pull in metafields and line item properties.
Step 4: Apply filters to narrow the data
Filters are what turn a general report into an answer. Common filters include date range (last 30 days, last quarter, month-to-date), financial status (paid, refunded, partially refunded), fulfillment status (unfulfilled, shipped, delivered), sales channel (online store, POS, wholesale), location, product type, vendor, customer tag, and order tag.
Apply one filter at a time and check the output after each one. If the results look wrong, test with a shorter date range or fewer filters to isolate the issue.
Step 5: Save, export, or schedule
Once the report answers your question, save it with a clear, descriptive name that another team member would understand, not "Custom Report 3" but "Weekly Sales by Product and Discount Code, Last 30 Days."
If this report needs to go to someone regularly, schedule it. A report that requires someone to log in, click export, and send a file every Monday morning will eventually stop getting done. A scheduled report that arrives automatically in the finance team's inbox at 8am on Monday never misses a week.
The custom reports every Shopify team actually needs
Different teams ask different questions. Here are the custom reports merchants request most often, organized by the team that typically needs them. Some needs are specialized enough that they deserve their own report structure entirely. For example, stores that sell product bundles often need a dedicated view of bundle performance separate from standard product reports; see our guide on building custom reports for bundle sales if that applies to your catalog.
Finance and accounting
Sales and tax reconciliation: A report combining gross sales, discounts, returns, net sales, tax collected (broken down by jurisdiction), shipping charges, and payment gateway fees for a given period. This is the single most common custom report request, and it is the one Shopify's native reporting handles least completely because it requires fields from multiple data categories.
Payout reconciliation: Matching Shopify payouts to the underlying orders, including transaction fees, refunds, and adjustments. Merchants on Shopify Payments need this for bookkeeping, and merchants using third-party gateways like PayPal or Stripe need it for cross-platform reconciliation. See our guide on going beyond Shopify's native payout reports for full reconciliation for a detailed walkthrough.
Tax reports by country or state: Detailed tax breakdowns by jurisdiction, essential for merchants selling across multiple US states or internationally. Report Pundit includes prebuilt templates for US state tax, Canadian tax, IOSS VAT, and monthly tax summary reports.
Gift card tracking: Reconciling gift card issuance, activation, redemption, and outstanding balances. This is easy to lose track of in native reporting since gift card activity spans several report categories; see our guide on tracking Shopify gift card usage and trends for the specific fields to include.
Operations and fulfillment
Unfulfilled orders by location: A daily view of orders that are paid but not yet shipped, filtered by fulfillment location. Operations teams use this as their morning checklist.
Shipping and fulfillment status: Tracking which orders are partially shipped, fully shipped, or still pending, with carrier and tracking details where available.
Orders with specific tags or properties: Many Shopify stores use order tags to flag orders for internal workflows (rush orders, wholesale orders, gift orders). A custom report filtered by order tag gives operations visibility into these subsets.
Custom order exports for vendors and warehouses: Stores that work with external vendors, 3PLs, or multiple warehouses often need order exports formatted to match what each partner's system expects. See our guide on custom order exports for vendors, warehouses, and ops teams for how this is typically set up.
Marketing
Sales by UTM source, medium, and campaign: Connecting revenue back to the marketing channel that drove it. This report answers the question "which campaign actually produced sales, not just clicks?"
Sales by discount code: Measuring the revenue, order count, and average order value generated by each promotion. Useful for deciding which discounts to repeat and which to retire.
Sales by referring site: Identifying which external websites and traffic sources are driving converting traffic, beyond what Shopify's acquisition reports show.
Inventory and warehouse
Inventory on hand by location: Current stock levels across all warehouses and fulfillment centers, with cost values. This is the foundation for purchase-order planning.
Low stock and out-of-stock alerts: A filtered view of products below a threshold quantity. When scheduled daily, this becomes an early-warning system.
Inventory replenishment: Combining sales velocity with current stock to calculate which products need reordering and in what quantities.
Agencies and multi-store operators
Multi-store sales comparison: Revenue, order count, and average order value across all connected stores in a single view. This is only possible with an app that supports multi-shop reporting.
Client-ready exports: Reports formatted with the right currency display, date format, column labels, and branding for external sharing. Report Pundit supports custom formatting for currency symbols, date formats, number formats, CSV delimiters, PDF headers, and column renaming.
Automating and sharing custom reports
Building a custom report is a one-time effort. The real value comes from automation, making sure the report reaches the right person with the right data at the right time, without anyone having to log in and click export.
Scheduling options
Report Pundit supports scheduled delivery on any frequency: daily, weekly, biweekly, monthly, or custom intervals. Each schedule includes advanced date logic so the report automatically covers the correct period. A weekly report scheduled for Monday can be set to cover the previous Monday through Sunday. A monthly report scheduled for the 1st can be set to cover the previous full month. Quarter-to-date, year-to-date, and rolling-window date ranges are also supported.
Delivery destinations
Scheduled reports can be sent to email (individual or group addresses, with an optional custom sender domain so reports arrive from your own address), Google Sheets (auto-updated on schedule), Google Drive, OneDrive, FTP/SFTP, Slack, BigQuery, and Power BI.
The export format is configurable per schedule: Excel, CSV, or PDF. Different audiences often need different formats: PDF for executive summaries, Excel for finance teams who will pivot the data, CSV for system imports.
Share links for external stakeholders
For stakeholders who need access to a report but do not need a full app account, Report Pundit offers password-protected share links. A share link gives view-only access to a live report, the recipient sees current data without being able to edit the report structure. This is commonly used for sharing with accountants, investors, and business partners.
User management and permissions
Stores with multiple team members can control who sees which reports through user permissions. Admins have full access; restricted users see only the reports assigned to them. This is important for stores where warehouse staff need fulfillment reports but should not access financial data.
When to use Shopify's built-in reporting vs a reporting app
Not every store needs a reporting app. Here is an honest breakdown of when Shopify's native custom reports are enough and when they are not.
Shopify's built-in reporting is enough when
Your store is on the Shopify plan or above, you need standard reports on sales, orders, and customers, the fields Shopify exposes cover your questions, you are comfortable exporting CSV files manually, and your team is small enough that one person can handle the reporting workflow.
For many new and small stores, this is perfectly adequate. Shopify's native analytics have improved significantly — ShopifyQL and Sidekick make custom reports more accessible, and the default report library covers the most common needs.
A reporting app makes sense when
Your reporting needs include any of the following: fields that Shopify does not expose in its custom reports (gateway fees, metafields, line item properties, detailed tax jurisdiction data), data that lives in connected apps like PayPal, ShipStation, or your ad platforms, automated delivery on a schedule, exports to Google Sheets, FTP, Slack, or BI tools rather than just CSV downloads, multi-store reporting, reports that combine data from multiple categories in a single view, custom calculations or KPIs that Shopify's metrics do not cover, or reports formatted for external stakeholders with specific layout and branding requirements.
The transition typically happens when a store grows from one person checking numbers occasionally to a team that depends on specific reports arriving on time for decisions. The trigger is usually not a single missing feature, it is the cumulative time spent on manual exports, spreadsheet cleanup, and repeated report building that adds up to several hours per week.
Report Pundit offers a free plan for lower-volume stores, covering all Shopify data, prebuilt reports, custom reports, filters, grouping, user management, and exports. Paid plans scale with your Shopify plan and add charts, calculated data fields, unlimited custom reports, and automated scheduling.
Frequently asked questions
Can I create custom reports on Shopify Basic?
Not natively. Shopify's own custom reporting feature is only available on the Shopify plan, Advanced Shopify plan, and Shopify Plus. Basic plan merchants can view default reports but cannot modify them or create new custom reports within Shopify itself. With Report Pundit, however, custom reports are available on every Shopify plan, including Basic. Report Pundit's free plan gives Basic merchants full access to custom reports, filters, column selection, and exports.
Are there free Shopify custom report templates?
Shopify provides roughly 50 built-in default report templates at no extra cost on qualifying plans, but they are not "custom" until you modify them. Report Pundit includes over 150 prebuilt report templates at no additional cost, available on the free plan, covering sales, orders, inventory, products, customers, taxes, payouts, fulfillment, marketing, and POS. These templates are ready to use immediately and can be customized further.
How do I get Shopify reports that show payment gateway fees?
Shopify's native reports do not include detailed payment gateway fee breakdowns within custom reports. To see transaction fees, payout amounts, and net payment details in a single report alongside order data, you need a reporting app that pulls from Shopify's transaction and payout data, and, if you use an external gateway like PayPal, from that connected account too. Report Pundit includes prebuilt payout reconciliation, payment gateway, and transaction fee reports with this data.
Can I schedule a Shopify custom report to send automatically?
Shopify's native custom reports do not support scheduled delivery. You can view and export them manually from the admin. For automated scheduling, daily, weekly, or monthly delivery to email, Google Sheets, FTP, Slack, or BI tools, you need a reporting app. Report Pundit supports scheduled delivery with advanced date logic and multiple export destinations.
How do I include metafields in a Shopify report?
Shopify's native custom reports do not support metafields as report columns. If your store uses order metafields, product metafields, variant metafields, or customer metafields, and you need that data in a report, use Report Pundit's Custom Properties feature. It lets you add any metafield key as a column in your report without exporting and merging data manually.
Can I combine data from multiple Shopify stores in one report?
Shopify's native reporting is limited to a single store. Each store's analytics are separate with no consolidation option. Report Pundit's multi-shop reporting lets you connect multiple stores and run combined or store-by-store reports from a single account. This is useful for multi-brand merchants, regional store operators, and agencies managing client portfolios.
What is the difference between Shopify Analytics and Shopify custom reports?
Shopify Analytics is the broader analytics system that includes the dashboard (metric cards, live view), the reports section (default and custom reports), and the tools for building explorations. Custom reports are one part of Shopify Analytics, they are the reports you create or modify yourself, as opposed to the default reports Shopify provides. If you are looking to customize the dashboard view itself rather than an individual report, see our guide on customizing and building your Shopify report dashboard.
When should I ask support to build a custom report for me?
If you have tried the ready-made templates and basic column/filter adjustments but the report still does not match your requirement, it is worth asking for help. Common scenarios include reports that need specific multi-field combinations, unusual date logic, calculated columns, or data from connected third-party apps. Report Pundit offers free report setup on all paid plans, you describe the question you want answered, and the support team builds the report for you.

5.0 ( 2000+ Reviews)
