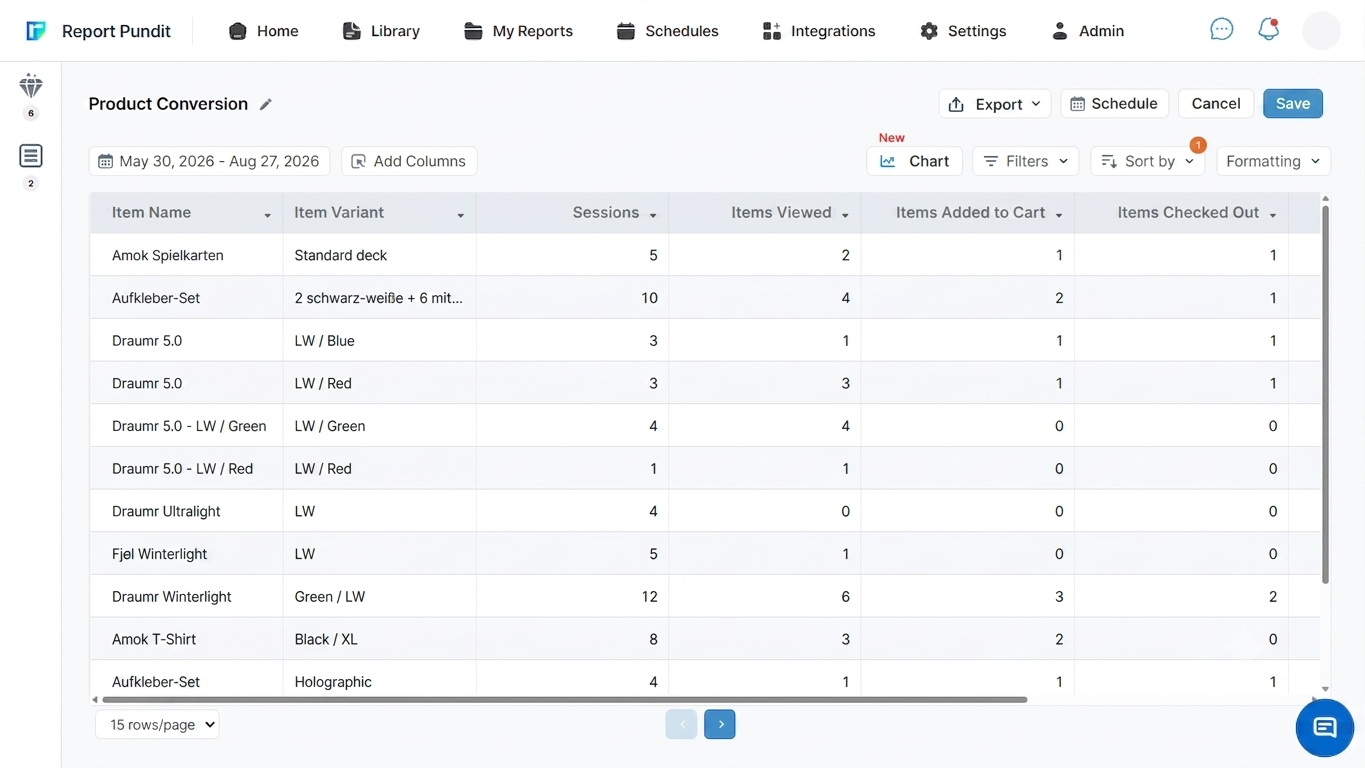
What Is the Product Conversion Report?
The Product Conversion report tracks how shoppers move through the on-site funnel for each product, from viewing it to adding it to a cart, reaching checkout, and completing the purchase. It is built on Google Analytics (GA4) item-scoped data, so every row ties a specific product, and optionally a specific variant, to the number of times shoppers took each of those steps.
This report answers a question that sales reports cannot: not how much a product sold, but where it lost the shoppers who looked at it. A product can attract heavy views and still convert poorly, and the funnel columns show exactly which stage the drop-off happens at.
One distinction worth clarifying up front: Sessions counts visits to your store, while Items Viewed counts how many times a particular product was looked at. They measure different things, and comparing them tells you how much of your traffic actually reaches a given product.
Because it uses GA4 metrics, this report requires your Google Analytics account to be connected to your Shopify store.
Which Fields Are Included in the Product Conversion Report?
These fields let you follow a single product from first view to completed sale and see its revenue alongside each funnel stage.
You can customize the pre-made report by adding, removing, or rearranging columns so the funnel reads the way you review your catalog.
Important Insights You Can Find in This Report
At which funnel stage does each product lose the most shoppers?
Read the four funnel columns left to right for a single product: Items Viewed, then Items Added to Cart, then Items Checked Out, then Items Purchased. The largest gap between two neighboring stages is where that product is leaking. A steep fall from Items Viewed to Items Added to Cart points to the product page itself, while a fall between Items Checked Out and Items Purchased points to something happening later in the buying process. Locating the gap tells you what to fix instead of guessing.
Which products pull strong interest but weak revenue?
Compare Items Viewed against Items Purchased and Item Revenue for the same product. A product with high views but few purchases is generating interest that never converts, which is a different problem from a product that few people view at all. The first needs a better product page, price, or offer. The second needs more visibility. Sorting by views and scanning the purchase column surfaces both groups quickly.
Is the conversion problem the product or one specific variant?
When Item Variant is included, you can see whether a product converts unevenly across its options. One size or color may draw views and add-to-carts while another stalls, often because of price, availability, or how it is presented. Reading conversion at the variant level stops you from redesigning a whole product page when the real issue is a single underperforming variant.
THE ANALYST'S READ: The Signal Most Merchants Miss
The stage where a product drops off tells you whether the fix belongs to the product or to your store. A drop concentrated between Items Viewed and Items Added to Cart is usually product-specific: the page, the price, the photos, or the description. But a drop concentrated between Items Checked Out and Items Purchased is often not about that product at all. If you see the same late-stage fall repeated across many products, the pattern points to store-wide checkout friction, such as shipping costs revealed late, limited payment options, or a required account step.
The practical read is this: before rebuilding a product page, check whether the product actually loses shoppers before the cart or after checkout begins. Fixing the product page will do nothing for a product that shoppers happily add to their cart and then abandon at payment.
How Can You Automate the Product Conversion Report?
Once your Google Analytics account is connected, open the pre-made Product Conversion report in Report Pundit and save it with its columns already set, or rebuild it under Custom Reports by adding the fields listed above. Set your date range and apply a filter if you want to focus on one product or variant.
You can schedule it to send automatically on a daily, weekly, or monthly basis by email, or push it to Google Sheets or Google Drive so the funnel refreshes without manual work. Exports are available in Excel, CSV, and PDF, which makes it easy to hand a clean funnel view to a merchandiser or share deeper data with your team.
Frequently Asked Questions
What data source does the Product Conversion report use?
It uses Google Analytics (GA4) item-scoped metrics, not Shopify order data. Your Google Analytics account has to be connected to your Shopify store for the report to populate.
What is the difference between Items Viewed and Sessions?
Sessions counts visits to your store as a whole, while Items Viewed counts how many times a specific product was looked at. Comparing the two shows how much of your traffic actually reaches a given product.
How is this different from the Sales by Product report?
Sales by Product is built on Shopify order data and shows financial performance such as net quantity and total sales. Product Conversion is built on GA4 behavioral data and shows the view-to-purchase funnel, so it explains why a product does or does not sell rather than only how much it sold.
Can I see conversion for a single variant?
Yes. Include the Item Variant field to read Items Viewed, Added to Cart, Checked Out, and Purchased for each variant, so you can tell whether one option is dragging down an otherwise healthy product.
Can I schedule or export the Product Conversion report?
Yes. It can be exported to Excel, CSV, or PDF, sent to Google Sheets or Google Drive, and scheduled to arrive by email on a daily, weekly, or monthly basis.